

Comprehensive analysis of codon bias in 13 Ganoderma mitochondrial genomes
- PMID: 37213503
- PMCID: PMC10192751
- DOI: 10.3389/fmicb.2023.1170790
Comprehensive analysis of codon bias in 13 Ganoderma mitochondrial genomes
Abstract
Introduction: Codon usage bias is a prevalent phenomenon observed across various species and genes. However, the specific attributes of codon usage in the mitochondrial genome of Ganoderma species remain unknown.
Methods: In this study, we investigated the codon bias of 12 mitochondrial core protein-coding genes (PCGs) in 9 Ganoderma species, including 13 Ganoderma strains.
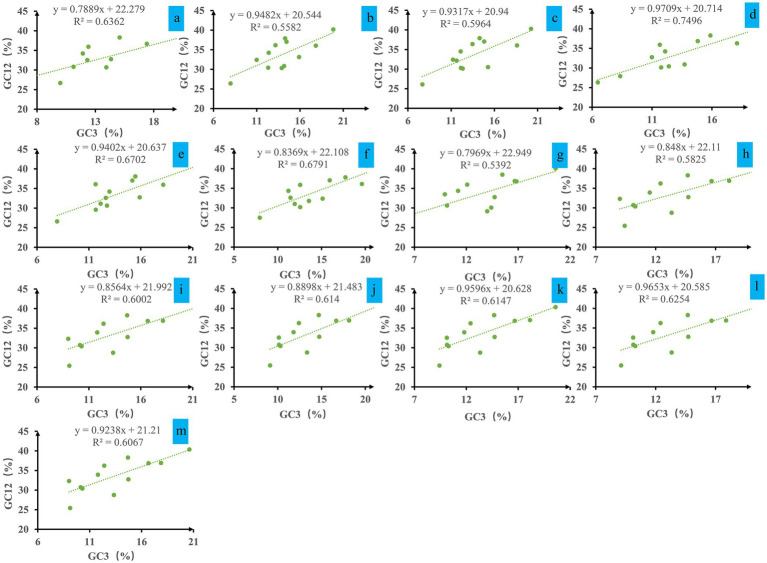
Results: The codons of all Ganoderma strains showed a preference for ending in A/T. Additionally, correlations between codon base composition and the codon adaptation index (CAI), codon bias index (CBI) and frequency of optimal codons (FOP) were identified, demonstrating the impact of base composition on codon bias. Various base bias indicators were found to vary between or within Ganoderma strains, including GC3s, the CAI, the CBI, and the FOP. The results also revealed that the mitochondrial core PCGs of Ganoderma have an average effective number of codons (ENC) lower than 35, indicating strong bias toward certain codons. Evidence from neutrality plot and PR2-bias plot analysis indicates that natural selection is a major factor affecting codon bias in Ganoderma. Additionally, 11 to 22 optimal codons (ΔRSCU>0.08 and RSCU>1) were identified in 13 Ganoderma strains, with GCA, AUC, and UUC being the most widely used optimal codons in Ganoderma. By analyzing the combined mitochondrial sequences and relative synonymous codon usage (RSCU) values, the genetic relationships between or within Ganoderma strains were determined, indicating variations between them. Nevertheless, RSCU-based analysis illustrated the intra- and interspecies relationships of certain Ganoderma species.
Discussion: This study deepens our insight into the synonymous codon usage characteristics, genetics, and evolution of this important fungal group.
Keywords: codon usage; fungi; genetics; mitochondrial genome; natural selection.
Copyright © 2023 Wu, Xiao, Luo, Xiong, Chen, He, Sha, Gui and Li.
Conflict of interest statement
The authors declare that the research was conducted in the absence of any commercial or financial relationships that could be construed as a potential conflict of interest.
Figures


Similar articles
-
Intraspecific and interspecific variations in the synonymous codon usage in mitochondrial genomes of 8 pleurotus strains.BMC Genomics. 2024 May 10;25(1):456. doi: 10.1186/s12864-024-10374-3. BMC Genomics. 2024. PMID: 38730418 Free PMC article.
-
Analysis of synonymous codon usage patterns in mitochondrial genomes of nine Amanita species.Front Microbiol. 2023 Mar 8;14:1134228. doi: 10.3389/fmicb.2023.1134228. eCollection 2023. Front Microbiol. 2023. PMID: 36970689 Free PMC article.
-
Natural Selection as the Primary Driver of Codon Usage Bias in the Mitochondrial Genomes of Three Medicago Species.Genes (Basel). 2025 May 30;16(6):673. doi: 10.3390/genes16060673. Genes (Basel). 2025. PMID: 40565565 Free PMC article.
-
Analysis of codon usage bias of thioredoxin in apicomplexan protozoa.Parasit Vectors. 2023 Nov 21;16(1):431. doi: 10.1186/s13071-023-06002-w. Parasit Vectors. 2023. PMID: 37990340 Free PMC article.
-
Codon-based indices for modeling gene expression and transcript evolution.Comput Struct Biotechnol J. 2021 Apr 22;19:2646-2663. doi: 10.1016/j.csbj.2021.04.042. eCollection 2021. Comput Struct Biotechnol J. 2021. PMID: 34025951 Free PMC article. Review.
Cited by
-
Intraspecific and interspecific variations in the synonymous codon usage in mitochondrial genomes of 8 pleurotus strains.BMC Genomics. 2024 May 10;25(1):456. doi: 10.1186/s12864-024-10374-3. BMC Genomics. 2024. PMID: 38730418 Free PMC article.
-
Characterization of the complete mitochondrial genome of the medical fungus Ganoderma resinaceum Boud., 1889 (Polyporales: Ganodermataceae).Mitochondrial DNA B Resour. 2024 Sep 30;9(10):1291-1297. doi: 10.1080/23802359.2024.2410449. eCollection 2024. Mitochondrial DNA B Resour. 2024. PMID: 39359381 Free PMC article.
-
Comparative analysis of the whole mitochondrial genomes of four species in sect. Chrysantha (Camellia L.), endemic taxa in China.BMC Plant Biol. 2024 Oct 12;24(1):955. doi: 10.1186/s12870-024-05673-6. BMC Plant Biol. 2024. PMID: 39395971 Free PMC article.
-
Multichromosomal mitochondrial genome of Punica granatum: comparative evolutionary analysis and gene transformation from chloroplast genomes.BMC Plant Biol. 2023 Oct 25;23(1):512. doi: 10.1186/s12870-023-04538-8. BMC Plant Biol. 2023. PMID: 37880586 Free PMC article.
-
Analysis of Codon Usage Bias of 30 Chloroplast Genomes in Ulva (Ulvophyceae, Chlorophyta).Genes (Basel). 2025 May 21;16(5):608. doi: 10.3390/genes16050608. Genes (Basel). 2025. PMID: 40428430 Free PMC article.
References
-
- Angulo-Sanchez L. T., López-Peña D., Torres-Moreno H., Gutiérrez A., Gaitán-Hernández R., Esqueda M. (2022). Biosynthesis, gene expression, and pharmacological properties of triterpenoids of Ganoderma species (Agaricomycetes): a review. Int. J. Med. Mushrooms 24, 1–17. doi: 10.1615/IntJMedMushrooms.2022044016, PMID: - DOI - PubMed
LinkOut - more resources
Full Text Sources