

Digital dashboards visualizing public health data: a systematic review
- PMID: 37213621
- PMCID: PMC10192578
- DOI: 10.3389/fpubh.2023.999958
Digital dashboards visualizing public health data: a systematic review
Abstract
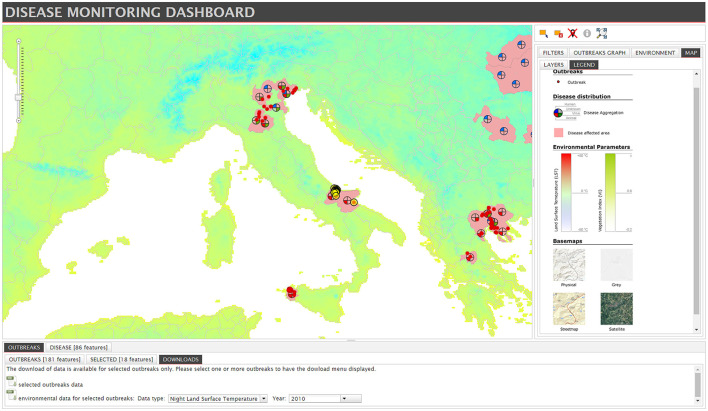
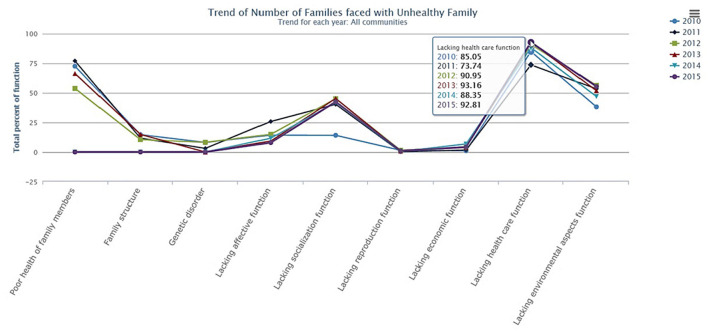
Introduction: Public health is not only threatened by diseases, pandemics, or epidemics. It is also challenged by deficits in the communication of health information. The current COVID-19 pandemic demonstrates that impressively. One way to deliver scientific data such as epidemiological findings and forecasts on disease spread are dashboards. Considering the current relevance of dashboards for public risk and crisis communication, this systematic review examines the state of research on dashboards in the context of public health risks and diseases.
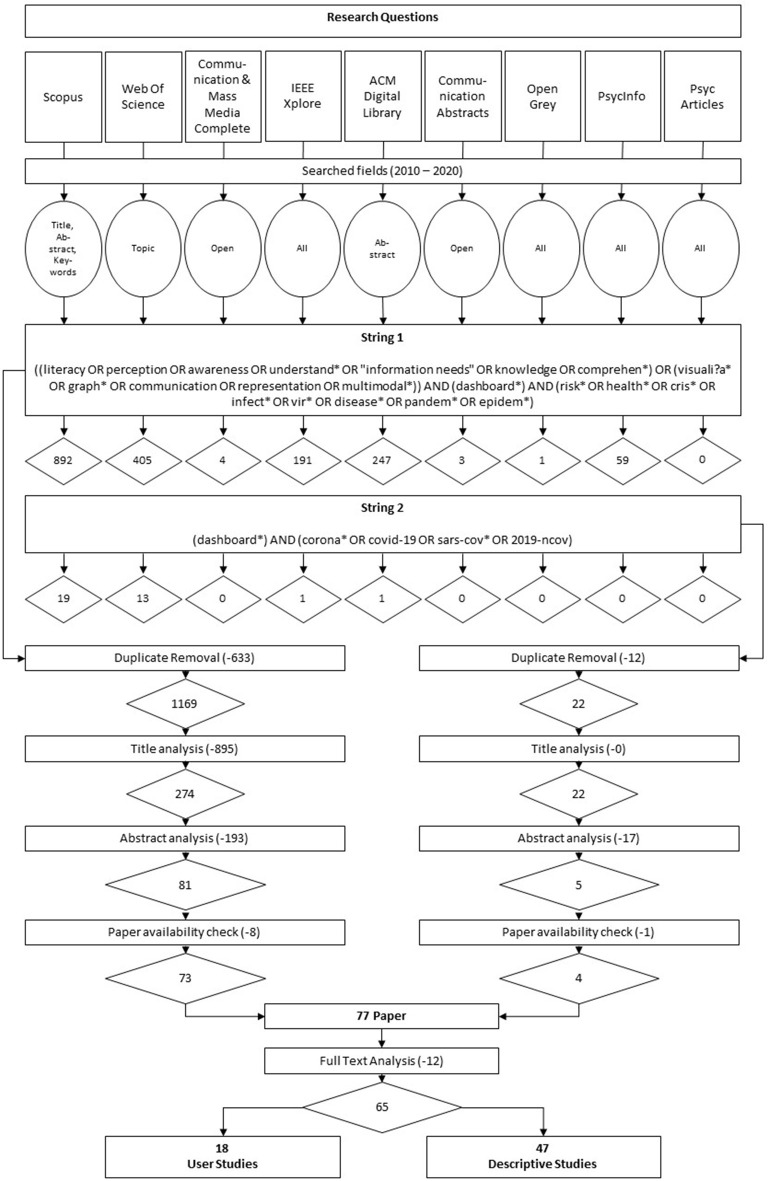
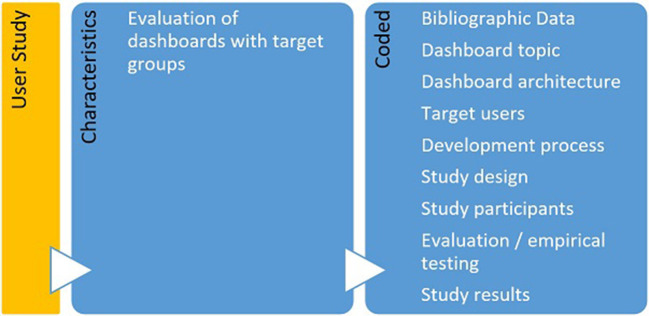
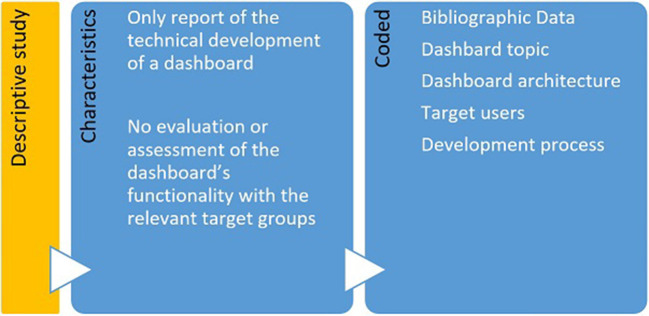
Method: Nine electronic databases where searched for peer-reviewed journal articles and conference proceedings. Included articles (n = 65) were screened and assessed by three independent reviewers. Through a methodological informed differentiation between descriptive studies and user studies, the review also assessed the quality of included user studies (n = 18) by use of the Mixed Methods Appraisal Tool (MMAT).
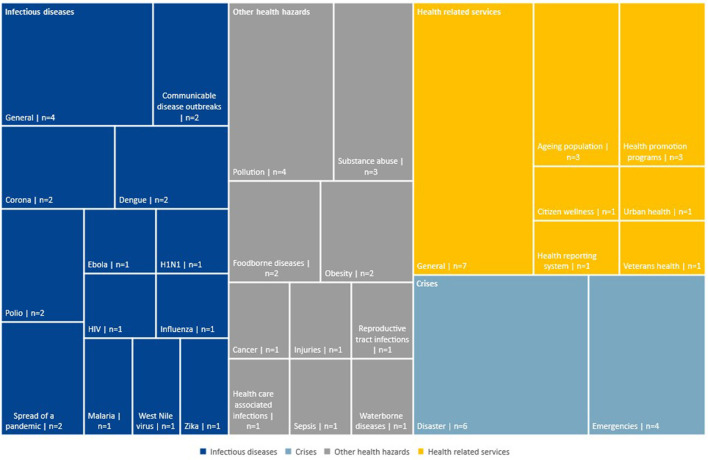
Results: 65 articles were assessed in regards to the public health issues addressed by the respective dashboards, as well as the data sources, functions and information visualizations employed by the different dashboards. Furthermore, the literature review sheds light on public health challenges and objectives and analyzes the extent to which user needs play a role in the development and evaluation of a dashboard. Overall, the literature review shows that studies that do not only describe the construction of a specific dashboard, but also evaluate its content in terms of different risk communication models or constructs (e.g., risk perception or health literacy) are comparatively rare. Furthermore, while some of the studies evaluate usability and corresponding metrics from the perspective of potential users, many of the studies are limited to a purely functionalistic evaluation of the dashboard by the respective development teams.
Conclusion: The results suggest that applied research on public health intervention tools like dashboards would gain in complexity through a theory-based integration of user-specific risk information needs.
Systematic review registration: https://www.crd.york.ac.uk/prospero/display_record.php?RecordID=200178, identifier: CRD42020200178.
Keywords: dashboard; health literacy; information needs; representations; risk information; visualization.
Copyright © 2023 Schulze, Brand, Geppert and Böl.
Conflict of interest statement
The authors declare that the research was conducted in the absence of any commercial or financial relationships that could be construed as a potential conflict of interest.
Figures
References
-
- Matheus R, Janssen M, Maheshwari D. Data science empowering the public: data-driven dashboards for transparent and accountable decision-making in smart cities. Gov Inf Q. (2020) 37:101284. 10.1016/j.giq.2018.01.006 - DOI
-
- World Health Organization . Surveillance in Emergencies. World Health Organization; (2022). Available online at: https://www.who.int/emergencies/surveillance (accessed April 13, 2023).
-
- Abeysinghe S. Global Health Governance and Pandemics: Uncertainty and Institutional Decision-Making. In: Pandemics, Publics, and Politics: Staging Responses to Public Health Crises. Singapore: Springer; (2018). p. 11–28. 10.1007/978-981-13-2802-2_2 - DOI
Publication types
MeSH terms
LinkOut - more resources
Full Text Sources
Medical