. 2023 May 11:2023:5469258.
doi: 10.1155/2023/5469258. eCollection 2023.

In Silico Identification and Analysis of Potentially Bioactive Antiviral Phytochemicals against SARS-CoV-2: A Molecular Docking and Dynamics Simulation Approach

Affiliations

In Silico Identification and Analysis of Potentially Bioactive Antiviral Phytochemicals against SARS-CoV-2: A Molecular Docking and Dynamics Simulation Approach

Sajal Kumar Halder et al. Biomed Res Int. .

Abstract

SARS-CoV-2, a deadly coronavirus sparked COVID-19 pandemic around the globe. With an increased mutation rate, this infectious agent is highly transmissible inducing an escalated rate of infections and death everywhere. Hence, the discovery of a viable antiviral therapy option is urgent. Computational approaches have offered a revolutionary framework to identify novel antimicrobial treatment regimens and allow a quicker, cost-effective, and productive conversion into the health center by evaluating preliminary and safety investigations. The primary purpose of this research was to find plausible plant-derived antiviral small molecules to halt the viral entrance into individuals by clogging the adherence of Spike protein with human ACE2 receptor and to suppress their genome replication by obstructing the activity of Nsp3 (Nonstructural protein 3) and 3CLpro (main protease). An in-house library of 1163 phytochemicals were selected from the NPASS and PubChem databases for downstream analysis. Preliminary analysis with SwissADME and pkCSM revealed 149 finest small molecules from the large dataset. Virtual screening using the molecular docking scoring and the MM-GBSA data analysis revealed that three candidate ligands CHEMBL503 (Lovastatin), CHEMBL490355 (Sulfuretin), and CHEMBL4216332 (Grayanoside A) successfully formed docked complex within the active site of human ACE2 receptor, Nsp3, and 3CLpro, respectively. Dual method molecular dynamics (MD) simulation and post-MD MM-GBSA further confirmed efficient binding and stable interaction between the ligands and target proteins. Furthermore, biological activity spectra and molecular target analysis revealed that all three preselected phytochemicals were biologically active and safe for human use. Throughout the adopted methodology, all three therapeutic candidates significantly outperformed the control drugs (Molnupiravir and Paxlovid). Finally, our research implies that these SARS-CoV-2 protein antagonists might be viable therapeutic options. At the same time, enough wet lab evaluations would be needed to ensure the therapeutic potency of the recommended drug candidates for SARS-CoV-2.


Conflict of interest statement

There are no conflicts of interest to declare.

Figures

Figure 1
Figure 1
Complete work flow of the structure-based virtual screening study.
Figure 2
Figure 2
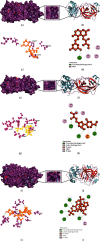
Schematic illustration of 7NT3_CHEMBL503 (Lovastatin), 7NT3_Molnupiravir, and 7NT3_Paxlovid complexes. (a, b) Share the pose and surface view of protein and ligand complex. Here, protein is in purple and cyan colors and ligand is in blue color. (c, d) Share 3D and 2D interactions of protein and ligand complex. Magenta color represents proteins, and yellow color presents ligands. (e, f) Share the pose and surface view of protein and ligand complex. Here, protein is in purple and cyan colors and ligand is in blue color. (g, h) Share 3D and 2D interactions of protein and ligand complex. Here, protein is in agenta color and ligand is in yellow color. (i, j) Share the pose and surface view of protein and ligand complex. Here, protein is in purple and cyan colors and ligand is in blue color. (k, l) Share 3D and 2D interactions of protein and ligand complex. Here, protein in magenta color and ligand in yellow color.
Figure 3
Figure 3
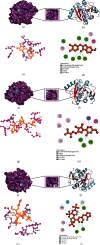
Schematic illustration of 7KQP_CHEMBL490355 (Sulfuretin), 7KQP_Molnupiravir, and 7KQP_Paxlovid complexes. (a, b) Share the pose and surface view of protein and ligand complex. Here, protein is in purple and cyan colors and ligand is in blue color. (c, d) Share 3D and 2D interactions of protein and ligand complex. Magenta color represents proteins and yellow color presents ligands. (e, f) Share the pose and surface view of protein and ligand complex. Here, protein is in purple and cyan colors and ligand is in blue color. (g, h) Share 3d and 2D interactions of protein and ligand complex. Here, protein in magenta color and ligand in yellow color. (i, j) share the pose and surface view of protein and ligand complex. Here, protein is in purple and cyan colors and ligand is in blue color. (k, l) Share 3D and 2D interactions of protein and ligand complex. Here, protein is in magenta color and ligand is in yellow color.
Figure 4
Figure 4
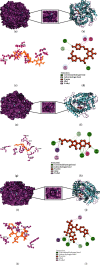
Schematic illustration of 1R4L_CHEMBL4216332 (Grayanoside A), 1R4L_Molnupiravir, and 1R4L_Paxlovid complexes. (a, b) Share the pose and surface view of protein and ligand complex. Here, protein is in purple and cyan colors and ligand is in blue color. (c,, d) Share 3D and 2D interactions of protein and ligand complex. Magenta color represents proteins and yellow color presents ligands. (e, f) Share the pose and surface view of protein and ligand complex. Here, protein is in purple and cyan colors, and ligand is in blue color. (g, h) Share 3D and 2D interactions of protein and ligand complex. Here, protein in magenta color and ligand in yellow color. (i, j) Share the pose and surface view of protein and ligand complex. Here, protein is in purple and cyan colors and ligand is in blue color. (k, l) Share 3D and 2D interaction of protein and ligand complex. Here, protein in magenta color and ligand in yellow color.
Figure 5
Figure 5
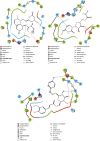
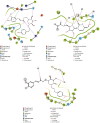
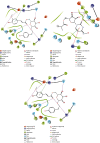
2D interaction of (a) 7NT3_Lovastatin, (b) 7NT3_Molnupiravir, and (c) 7NT3_Paxlovid complexes.
Figure 6
Figure 6
2D interaction of (a) 7KQP_Sulfuretin, (b) 7KQP_Molnupiravir, and (c) 7KQP_Paxlovid complexes.
Figure 7
Figure 7
2D interaction of (a) 1R4L_Grayanoside A, (b) 1R4L_Molnupiravir, and (c) 1R4L_Paxlovid complexes.
Figure 8
Figure 8
Illustration of 3D representation of (a) 7NT3_complexes, (b) 7KQP_complexes, and (c) 1R4L_complexes. Black circle portrays the binding pockets and incorporates ligands and cocrystallized compounds.
Figure 9
Figure 9
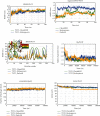
Schematic illustration of 100 ns molecular dynamics simulation of 7NT3_CHEMBL503 (Lovastatin) (green), 7NT3_Molnupiravir (blue), and 7NT3_Paxlovid complexes (yellow). Representations (a, b, c, d, e, and f) share the RMSD, RMSF, Rg, hydrogen bonds, and SASA values of 7NT3_CHEMBL503 (Lovastatin), 7NT3_Molnipiravir, and 7NT3_Paxlovid complexes. Representation b shares ligand RMSD value of Chembl503, Molnupiravir and Paxlovid.
Figure 10
Figure 10
Schematic illustration of 100 ns molecular dynamics simulation of 7KQP_CHEMBL490355 (Sulfuretin) (green), 7KQP_Molnupiravir (blue), and 7KQP_Paxlovid complexes (yellow). Representations (a, b, c, d, e, and f) shares the RMSD, RMSF, Rg, hydrogen bonds, and SASA values of 7KQP_CHEMBL490355 (Sulfuretin), 7KQP_Molnipiravir, and 7KQP_Paxlovid complexes. Representation b share Ligand RMSD value of CHEMBL490355, Molnupiravir, and Paxlovid.
Figure 11
Figure 11
Schematic illustration of 100 ns molecular dynamics simulation of 1R4L_CHEMBL4216332 (Grayanoside A) (green), 1R4L_Molnupiravir (blue), and 1R4L_Paxlovid (yellow). Representations (a, b, c, d, e, and f) share the RMSD, RMSF, Rg, hydrogen bonds, and SASA values of 1R4L_CHEMBL4216332 (Grayanoside A), 1R4L_Molnipiravir, and 1R4L_Paxlovid complexes. Representation b share ligand RMSD value of CHEMBL4216332, Molnupiravir and Paxlovid.
Figure 12
Figure 12
Simulation graph of root-mean-square deviation (RMSD) showing Lovastatin_7NT3 (orange), Molnupiravir_7NT3 (yellow), and Paxlovid_7NT3 (green). (b) Simulation graph of root-mean-square deviation (RMSD) showing Lovastatin (orange), Molnupiravir (yellow), and Paxlovid (green). (c) Simulation findings showing of root-mean-square fluctuation (RMSF) of Lovastatin_7NT3 (orange), Molnupiravir_7NT3 (yellow), and Paxlovid_7NT3 (green).
Figure 13
Figure 13
Contact maps of Lovastatin_7NT3 (a), Molnupiravir_7NT3 (b), and Paxlovid_7NT3 (c) complexes.
Figure 14
Figure 14
Simulation graph of root-mean-square deviation (RMSD) showing Sulfuretin_7KQP (orange), Molnupiravir_7KQP (yellow), and Paxlovid_7KQP (green). (b) Simulation graph of root-mean-square deviation (RMSD) showing Sulfuretin (orange), Molnupiravir (yellow), and Paxlovid (green). (c) Simulation findings showing of root-mean-quare fluctuation (RMSF) of Sulfuretin_7KQP (orange), Molnupiravir_7KQP (yellow), and Paxlovid_7KQP (green).
Figure 15
Figure 15
Contact maps of Sulfuretin_7KQP (a), Molnupiravir_7KQP (b), and Paxlovid_7KQP (c) complexes.
Figure 16
Figure 16
Simulation graph of root-mean-square deviation (RMSD) showing Grayanoside A_1R4L (orange), Molnupiravir_1R4L (yellow), and Paxlovid_1R4L (green). (b) Simulation graph of root-mean-square deviation (RMSD) showing Grayanoside A (orange), Molnupiravir (yellow), and Paxlovid (green). (c) Simulation findings showing of root-mean-square fluctuation (RMSF) of Grayanoside A_1R4L (orange), Molnupiravir_1R4L (yellow), and Paxlovid_1R4L (green).
Figure 17
Figure 17
Contact maps of Grayanoside A_1R4L (a), Molnupiravir_1R4L (b), and Paxlovid_1R4L (c) complexes.
Figure 18
Figure 18
Superimposed representation of the pre-MD and post-MD structures of Ligand_7NT3, Ligand_7KQP, and Ligand_1R4L complexes.
Figure 19
Figure 19
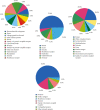
Predicted top 25 classes of H. sapiens molecular targets for (a) Lovastatin, (b) Sulfuretin, (c) Grayanoside A, and (d) Paxlovid.

References

    1. Shawan M. M. A. K., Halder S. K., Hasan M. A. Luteolin and abyssinone II as potential inhibitors of SARS-CoV-2: an in silico molecular modeling approach in battling the COVID-19 outbreak. Bulletin of the National Research Centre . 2021;45(1):p. 27. doi: 10.1186/s42269-020-00479-6. - DOI - PMC - PubMed
    1. WHO Coronavirus (COVID-19) Dashboard | WHO Coronavirus (COVID-19) Dashboard with Vaccination Data. https://covid19.who.int/
    1. Liu J., Liao X., Qian S., et al. Community transmission of severe acute respiratory syndrome coronavirus 2, Shenzhen, China, 2020. Emerging Infectious Diseases . 2020;26:1320–1323. - PMC - PubMed
    1. Srivastava A. K., Kumar A., Misra N. On the inhibition of COVID-19 protease by Indian herbal plants: an in silico investigation. 2020, https://arxiv.org/abs/2004.03411.
    1. Zhu N., Zhang D., Wang W., et al. A novel coronavirus from patients with pneumonia in China, 2019. The New England Journal of Medicine . 2020;382(8):727–733. doi: 10.1056/NEJMoa2001017. - DOI - PMC - PubMed