. 2023 May 15:11:e14973.
doi: 10.7717/peerj.14973. eCollection 2023.

Functional and comparative analysis of THI1 gene in grasses with a focus on sugarcane

Affiliations

Functional and comparative analysis of THI1 gene in grasses with a focus on sugarcane

Henrique Moura Dias et al. PeerJ. .

Abstract

De novo synthesis of thiamine (vitamin B1) in plants depends on the action of thiamine thiazole synthase, which synthesizes the thiazole ring, and is encoded by the THI1 gene. Here, we investigated the evolution and diversity of THI1 in Poaceae, where C4 and C3 photosynthetic plants co-evolved. An ancestral duplication of THI1 is observed in Panicoideae that remains in many modern monocots, including sugarcane. In addition to the two sugarcane copies (ScTHI1-1 and ScTHI1-2), we identified ScTHI1-2 alleles showing differences in their sequence, indicating divergence between ScTHI1-2a and ScTHI1-2b. Such variations are observed only in the Saccharum complex, corroborating the phylogeny. At least five THI1 genomic environments were found in Poaceae, two in sugarcane, M. sinensis, and S. bicolor. The THI1 promoter in Poaceae is highly conserved at 300 bp upstream of the start codon ATG and has cis-regulatory elements that putatively bind to transcription factors associated with development, growth, development and biological rhythms. An experiment set to compare gene expression levels in different tissues across the sugarcane R570 life cycle showed that ScTHI1-1 was expressed mainly in leaves regardless of age. Furthermore, ScTHI1 displayed relatively high expression levels in meristem and culm, which varied with the plant age. Finally, yeast complementation studies with THI4-defective strain demonstrate that only ScTHI1-1 and ScTHI1-2b isoforms can partially restore thiamine auxotrophy, albeit at a low frequency. Taken together, the present work supports the existence of multiple origins of THI1 harboring genomic regions in Poaceae with predicted functional redundancy. In addition, it questions the contribution of the levels of the thiazole ring in C4 photosynthetic plant tissues or potentially the relevance of the THI1 protein activity.

Keywords: Evolutionary diversity; Gene expression; Genetic complementation; Genomic characterization; Plant development; Promoter analysis; Thiazole biosynthesis.


Conflict of interest statement

The authors declare that they have no competing interests.

Figures

Figure 1
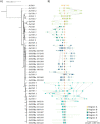
Figure 1. Phylogenetic relationships of THI1 (thiamine thiazole synthase) in Poaceae.
(A) The tree containing 51 protein sequences is subdivided into two major clades. Clade A (dashed line) comprises the C3 grasses (B. distachyum (Bd), B. hybridum (Bh), B. mexicanum (Bd), B. stacei (Bs), B. sylvaticum (Bsy), H. vulgare (Hv), T. aestivum (Ta), T. turgidum (Tt), T. intermedium (Ti)) and Clade B (black line) the C4 grasses (E. coracana (Ec), C. americanus (Ca), P. hallii (Ph), P. virgatum (Pv), M. sinensis (Ms), Saccharum sp. var. R570 (ScTHI1), S. spontaneum (Ss), S. italica (Si), S. viridis (Sv), S. bicolor (Sb), and Z. mays (Zm)). The outgroups are represented by A. thaliana (At) and J. ascendens (Ja). The circle indicate species and are colored according to the numbers of gene copies. Circles with dashed border show a THI1 homolog single copy. The triangle shows collapsed BAC sequences. The scale shows the phylogenetic distance between protein sequences. For an expanded version with protein names and IDs see Table S2. (B) Multiple sequence alignment of THI1 homologs from Saccharomyces cerevisiae, Arabidopsis thaliana, Saccharum sp. var. R570, Hordeum vulgare, Triticum aestivum, Triticum turgidum, and Thinopyrum intermedium showing diversity at position 238 (stars).
Figure 2
Figure 2. Comparison of THI1 gene and its genomic flanking regions in sugarcane and other plants through phylogenetic and synteny analyses.
(A) Numbers at nodes are branch support values estimated by the aLRT SHlike method implemented in PhyML3.0 (see Methods). The tree is based on the multiple alignments of the two exons of the single THI1 copy from A. thaliana (AtTHI1), E. coracana (EcTHI1), C. americanus (CaTHI1), O. sativa (OsTHI1), O. brachyantha (ObTHI1), S. italica (SiTHI1), S. viridis (SvTHI1), S. bicolor (SbTHI1), M. sinensis (MsTHI1), S. spontaneum (SsTHI1) and BACs sequences of R570 sugarcane (BAC 108_C04, BAC 017_B18, and BAC 094_O04 represent ScTHI1-1, ScTHI1-2a, and ScTHI1-2b, respectively). (B) Synteny analysis was performed using blastx among sugarcane BAC sequences and sequences from the other genomes obtained from the plant’s database (see Table S2). Rectangles indicate genes.
Figure 3
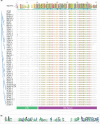
Figure 3. Alignment of amino acid sequences of THI1.
(A) 51 THI1 sequences alignment across various species of Poaceae, using J. ascendens and A. thaliana as outgroups. The alignment was built with MAFFT v7. (B) WebLogo representation of multiple sequence alignment of N-terminal protein region indicating the relative frequency of amino acids at a given position (height). Abbreviation: CTP, Chloroplast Transient Peptide.
Figure 4
Figure 4. Promoter analysis and motif enrichment of THI1 genes.
(A) Motif identification in promoter regions (2,000 bp upstream of ATG) at THI1 genes. The following parameters were used: site distribution = zero or one occurrence per sequence (zoops); minimum width = 5; minimum width = 25 bp; number of motifs = 20. The blue boxes showed conserved motifs among all grasses and the green boxes showed motifs present in ScTHI1 paralogues. (B) Sequence logo of seven motifs (highly conserved) identified in the core promoter region of THI1 of grasses. (C) GO enrichment analysis of motifs localized in the core promoter region of THI1 of grasses (blue boxes in A). (D) GO enrichment analysis of motifs localized in the promoter region of ScTHI1 (green boxes in A).
Figure 5
Figure 5. Network analysis of THI1 gene in Saccharum complex.
The network was built using the NETWORK 4.6.1.3 software (Bandelt, Forster & Röhl, 1999) with default parameters (Median-joining method). An alignment of a region of 539 bp of 210 sequences of varieties of sugarcane was used to construct the network. The right part of the figure is a close-up of the entire network shown on the left. The size of the circles is proportional to the number of sequences in the haplotype; the distance between clusters is proportional to the number of substitutions observed between sequences.
Figure 6
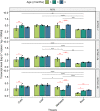
Figure 6. Expression analysis of ScTHI1 genes in different tissues and ages in the sugarcane cultivar R570.
Data are the means of three biological replicates; error bars indicate SD. Asterisks indicate significant differences among compared groups using the ANOVA and p-adjust (Bonferroni method) <0.05 (*), 0.01(**), 0.001 (***), and 0.0001(****). Black and red lines represent statistically significant differences between tissues and ages.
Figure 7
Figure 7. Functional yeast complementation assay.
S. cerevisiae strain KBY5 was transformed with the three versions of the ScTHI1 gene found in the sugarcane genome, with the positive control A184V and the negative control and DelN, and plated in YNB media with or without tryptophan and thiamine. W303a strain was used as positive control. W = tryptophan and “thia” = thiamine. Each column represents one transformant. Lines represent dilution series. (A and B) are the experimental controls to check if all strains can grow (A) and if all transformed ones can grow without tryptophan (B). (C and D) show growth after 4 days of incubation, while (E and F) after 28 days of incubation, at 30 °C.

References

    1. Ahn I-P, Kim S, Lee Y-H. Vitamin B1 functions as an activator of plant disease resistance. Plant Physiology. 2005;138(3):1505–1515. doi: 10.1104/pp.104.058693. - DOI - PMC - PubMed
    1. Anand L, Rodriguez Lopez CM. ChromoMap: an R package for interactive visualization of multi-omics data and annotation of chromosomes. BMC Bioinformatics. 2022;23(1):1–9. doi: 10.1186/s12859-021-04556-z. - DOI - PMC - PubMed
    1. Armenteros A, Juan J, Salvatore M, Emanuelsson O, Winther O, von Heijne G, Elofsson A, Nielsen H. Detecting sequence signals in targeting peptides using deep learning. Life Science Alliance. 2019a;2(5):e201900429. doi: 10.26508/lsa.201900429. - DOI - PMC - PubMed
    1. Armenteros JJA, Tsirigos KD, Sønderby CK, Petersen TN, Winther O, Brunak S, Von Heijne G, Nielsen H. SignalP 5. 0 improves signal peptide predictions using deep neural networks. Nature Biotechnology. 2019b;37(4):410–423. doi: 10.1038/s41587-019-0036-z. - DOI - PubMed
    1. Bailey TL, Boden M, Buske FA, Frith M, Grant CE, Clementi L, Ren J, Li WW, Noble WS. MEME Suite: tools for motif discovery and searching. Nucleic Acids Research. 2009;37(Web Server):202–208. doi: 10.1093/nar/gkp335. - DOI - PMC - PubMed

Publication types

LinkOut - more resources