. 2023 May 16:11:e15058.
doi: 10.7717/peerj.15058. eCollection 2023.

Identification of immune-related genes in acute myocardial infarction based on integrated bioinformatical methods and experimental verification

Affiliations

Identification of immune-related genes in acute myocardial infarction based on integrated bioinformatical methods and experimental verification

Jian Liu et al. PeerJ. .

Abstract

Background: Acute myocardial infarction (AMI) is one of the leading causes of death worldwide. The etiology of AMI is complex and has not been fully defined. In recent years, the role of immune response in the development, progression and prognosis of AMI has received increasing attention. The aim of this study was to identify key genes associated with the immune response in AMI and to analyze their immune infiltration.

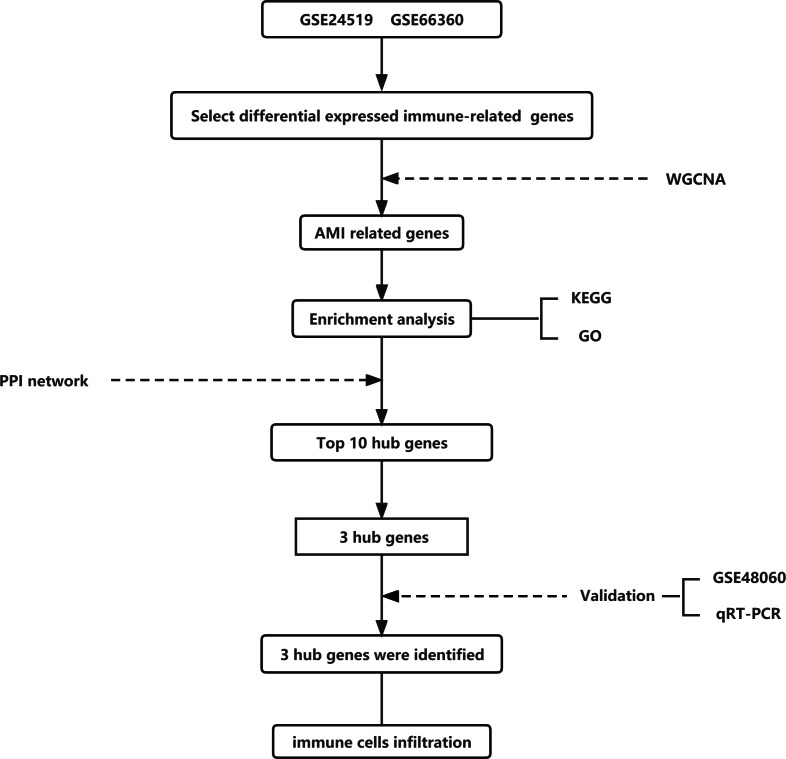
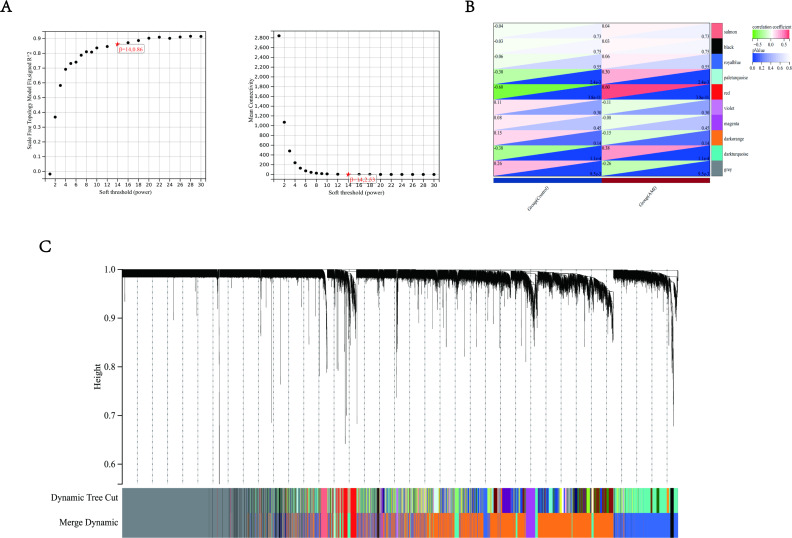
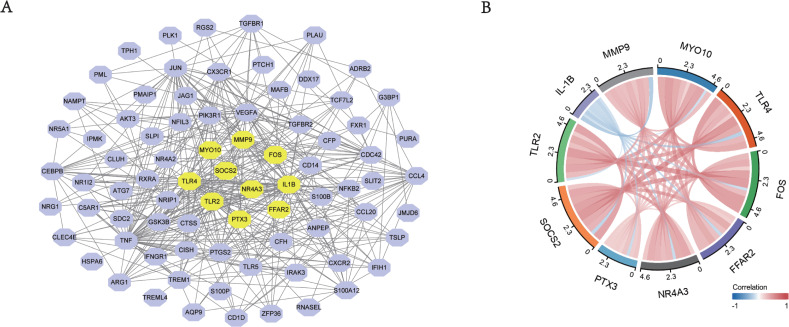
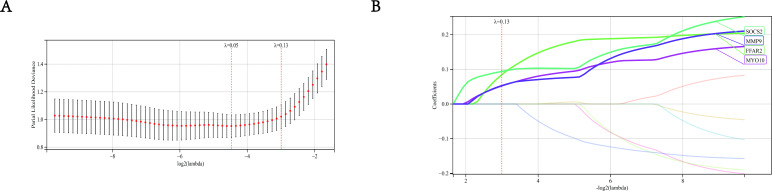
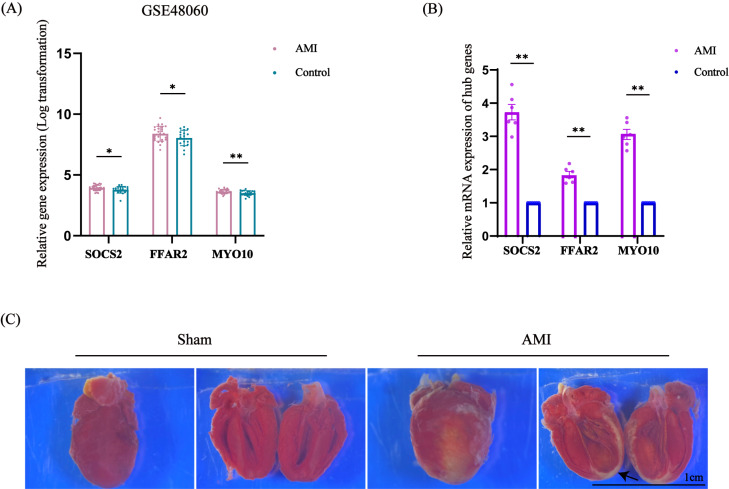
Methods: The study included a total of two GEO databases, containing 83 patients with AMI and 54 healthy individuals. We used the linear model of microarray data (limma) package to find the differentially expressed genes associated with AMI, performing weighted gene co-expression analysis (WGCNA) to further identify the genes associated with inflammatory response to AMI. We found the final hub genes through the protein-protein interaction (PPI) network and least absolute shrinkage and selection operator (LASSO) regression model. To verify the above conclusions, we constructed mice AMI model, extracting myocardial tissue to perform qRT-PCR. Furthermore, the CIBERSORT tool for immune cells infiltration analysis was also carried out.

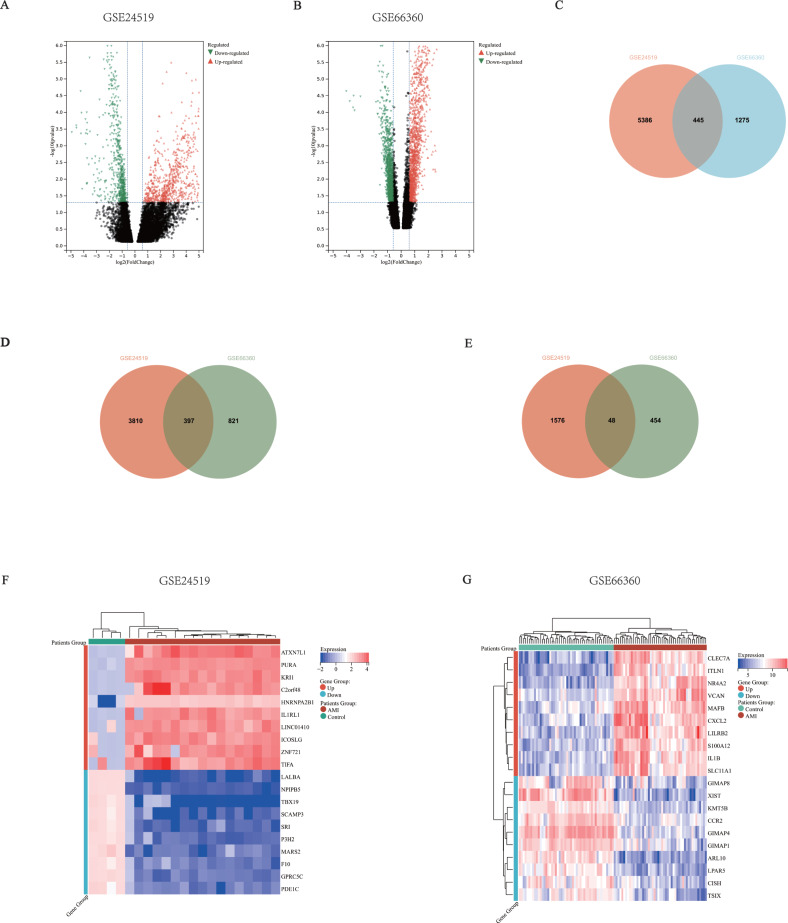
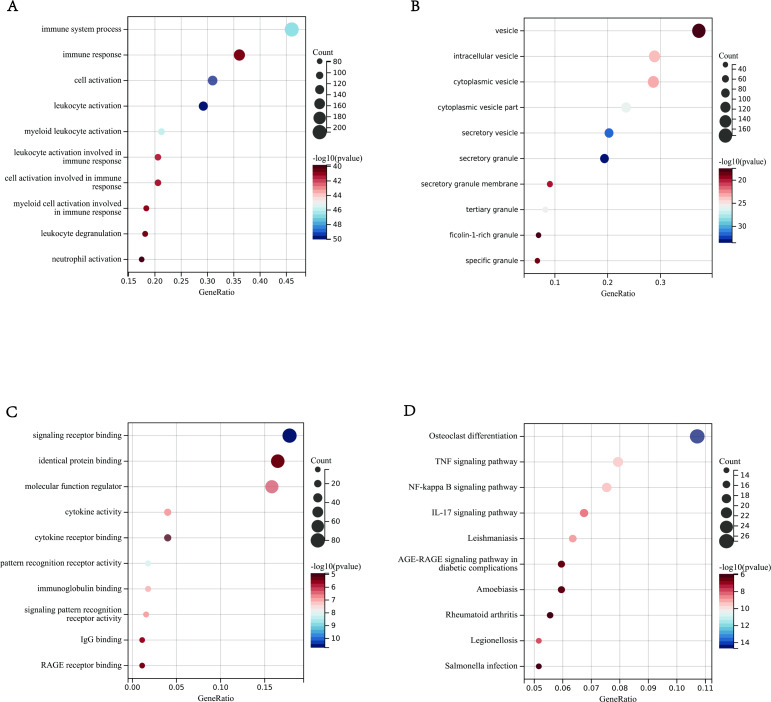
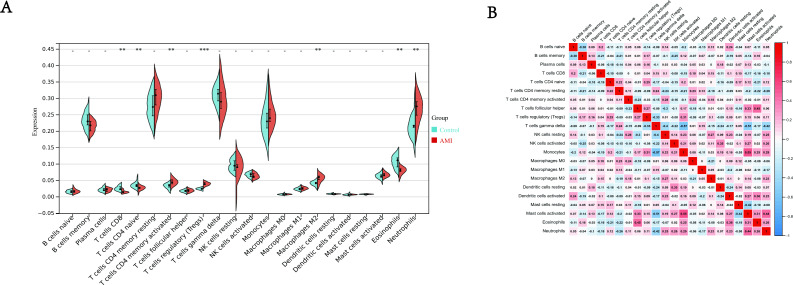
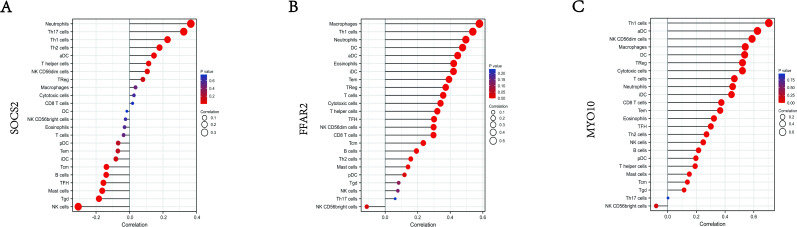
Results: A total of 5,425 significant up-regulated and 2,126 down-regulated genes were found in GSE66360 and GSE24519. A total of 116 immune-related genes in close association with AMI were screened by WGCNA analysis. These genes were mostly clustered in the immune response on the basis of GO and KEGG enrichment. With construction of PPI network and LASSO regression analysis, this research found three hub genes (SOCS2, FFAR2, MYO10) among these differentially expressed genes. The immune cell infiltration results revealed that significant differences could be found on T cells CD4 memory activated, Tregs (regulatory T cells), macrophages M2, neutrophils, T cells CD8, T cells CD4 naive, eosinophils between controls and AMI patients.

Keywords: Immune response; LASSO; Microarray expression profiling dataset; WGCNA; Acute myocardial infarction.


Conflict of interest statement

The authors declare there are no competing interests.

Figures

Figure 1
Figure 1. Flow chart to illustrate the analysis process of the present study.
Figure 2
Figure 2. Common mRNA expression patterns in the AMI patients and healthy individuals.
(A–B) mRNA expression volcano map, different colors represented different expressions. Each spot represented a gene, the red dots meant up-regulated genes, the green dots meant down-regulated genes. (A) GSE24519. There were 5,831 differentially expressed mRNA matching the criteria, including 4,207 up-regulated and 1,624 down-regulated. (B) GSE66360. There were 1,720 differentially expressed mRNA matching the criteria, including 1,218 up-regulated and 502 down-regulated. (C) Venn Diagram of total DEGs in the two datasets, there were 5,831 genes in GSE24519, 1,720 genes in GSE66360, including 445 mutual genes. (D) Venn Diagram of up-regulated DEGs in the two datasets, 4,207 genes in GSE24519, 1,218 genes in GSE66360, including 397 mutual genes. (E) Venn Diagram of down-regulated DEGs in the two datasets, 1,624 genes in GSE24519, 502 genes in GSE66360, including 48 mutual genes. (F–G) Heatmap showed the top 10 up and down regulated genes in total samples. (F) GSE24519 (G) GSE66360.
Figure 3
Figure 3. Weighted gene co-expression analysis (WGCNA) based on the immune-related DEGs.
(A) Analysis of network topology for various soft-thresholding powers. The left panel showed the scale-free fit index (y-axis) as a function of the soft-thresholding power (x-axis). The right panel showed the mean connectivity (y-axis) as a function of the soft-thresholding power (x-axis). (B) Module-trait relationship: each row corresponded to a module eigengene and each column to a trait. Each cell contained the corresponding correlation and p-value. The table was color-coded by correlation according to the color legend. Distribution of average gene significance and errors in the modules were associated with AMI patients and controls. (C) Gene dendrogram and module colors, the row underneath the dendrogram showed the module assignment determined by the Dynamic Tree Cut.
Figure 4
Figure 4. Enrichment Analyses outcomes.
(A–D) The bar graphs of Gene Ontology annotation and Kyoto Encyclopedia of Genes and Genomes pathway enrichment of DEGs included BP (biological process), CC (cellular component), MF (molecular function), KEGG (signaling pathway); (A) BP (B) CC (C) MF (D) KEGG.
Figure 5
Figure 5. The PPI networks of top DEGs.
(A) All the circles were proteins encoded by top DEGs. Purple color represented the genes that met the criteria, yellow color represented the top 10 most significant genes. The black lines represented the relationship between two genes. (B) Chord diagram of 10 hub genes. The solid lines meant the relationship of every two genes, and the depth of color represented the closeness of their connection.
Figure 6
Figure 6. Immune infiltration analysis.
(A) Split violin plot of the estimated proportion of 22 types of immune cells between control and AMI using the dataset of GSE24519. (B) Correlation heat map of 22 types of immune cells. Positive and negative correlations were respectively shown in blue and red color, whereas the number represented the correlation parameters. ∗∗P < 0.01, ∗∗∗P < 0.001 compared with control for two groups.
Figure 7
Figure 7. Establishment of LASSO model.
(A) The gene signature selection of optimal parameter (lambda) in LASSO mode. (B) LASSO coefficient profiles of four differentially expressed genes were selected by the optimal lambda.
Figure 8
Figure 8. Expression of SOCS2, FFAR2, MYO10 in another dataset and the expression levels of SOCS2, FFAR2, MYO10 in mouse myocardial tissue analyzed by qRT-PCR.
(A) The relative expression of SOCS2, FFAR2, MYO10 in GSE48060, the result showed that these genes were higher in AMI group than in control group, n = 31 in AMI group, n = 21 in control group. (B) qRT-PCR results showed that the expression of SOCS2, FFAR2, MYO10 were higher in AMI group than in the normal one, n = 6 per group, the data are expressed as the mean ± SEM. P < 0.05, ∗∗P < 0.01 compared with control group. (C) The representative TTC staining images of myocardial infarction area. The black arrow indicates the infarction area.
Figure 9
Figure 9. Correlation map of 22 types of immune cells and SOCS2, FFAR2, MYO10.
A positive and negative correlation was respectively shown in right and left direction, whereas the high and low p-value was respectively shown in light and deep red color. The size of the circle represented the strength of correlation, the larger of the size, the stronger of the correlation. (A) SOCS2. (B) FFAR2. (C) MYO10.

References

    1. Abbate A, Toldo S, Marchetti C, Kron J, Van Tassell BW, Dinarello CA. Interleukin-1 and the inflammasome as therapeutic targets in cardiovascular disease. Circulation Research. 2020;126:1260–1280. doi: 10.1161/circresaha.120.315937. - DOI - PMC - PubMed
    1. Afanasieva OI, Tyurina AV, Klesareva EA, Arefieva TI, Ezhov MV, Pokrovsky SN. Lipoprotein(a), immune cells and cardiovascular outcomes in patients with premature coronary heart disease. Journal of Personalized Medicine. 2022;12:269. doi: 10.3390/jpm12020269. - DOI - PMC - PubMed
    1. Arjonen A, Kaukonen R, Mattila E, Rouhi P, Högnäs G, Sihto H, Miller BW, Morton JP, Bucher E, Taimen P, Virtakoivu R, Cao Y, Sansom OJ, Joensuu H, Ivaska J. Mutant p53-associated myosin-X upregulation promotes breast cancer invasion and metastasis. Journal of Clinical Investigation. 2014;124:1069–1082. doi: 10.1172/jci67280. - DOI - PMC - PubMed
    1. Bhatt DL, Lopes RD, Harrington RA. Diagnosis and treatment of acute coronary syndromes: a review. JAMA. 2022;327:662–675. doi: 10.1001/jama.2022.0358. - DOI - PubMed
    1. Blüml S, Scheinecker C, Smolen JS, Redlich K. Targeting TNF receptors in rheumatoid arthritis. International Immunology. 2012;24:275–281. doi: 10.1093/intimm/dxs047. - DOI - PubMed

Publication types