. 2023 Apr 3:29:366-380.
doi: 10.1016/j.omtm.2023.03.016. eCollection 2023 Jun 8.

Modeling Pkd1 gene-targeted strategies for correction of polycystic kidney disease

Affiliations

Modeling Pkd1 gene-targeted strategies for correction of polycystic kidney disease

Almira Kurbegovic et al. Mol Ther Methods Clin Dev. .

Expression of concern in

Abstract

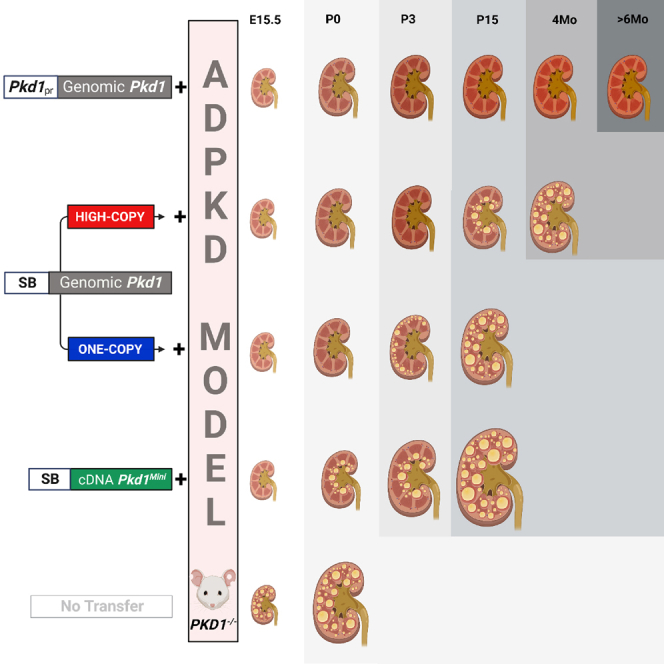
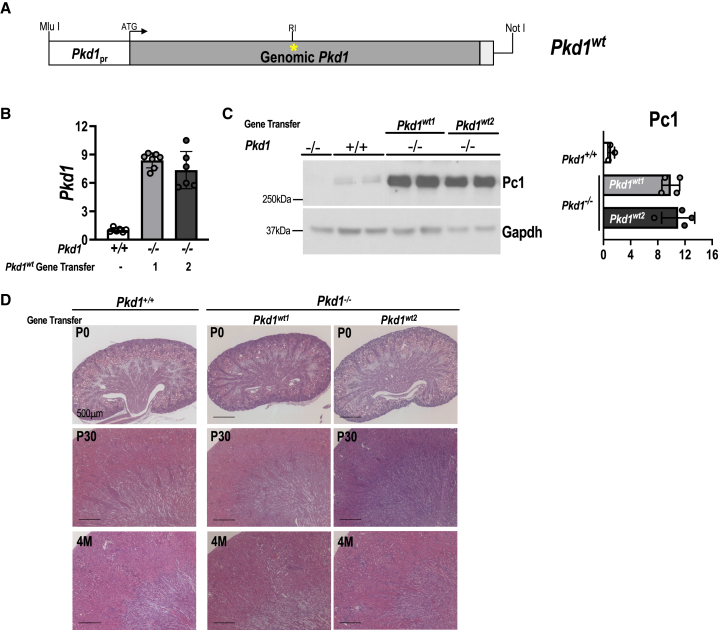
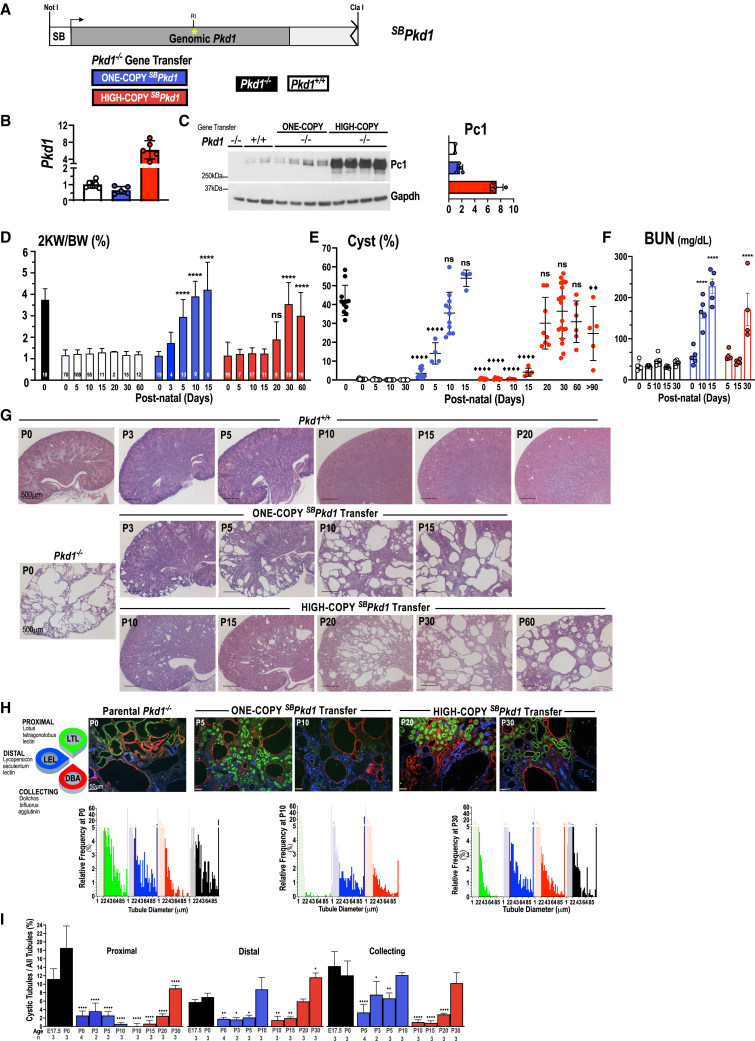
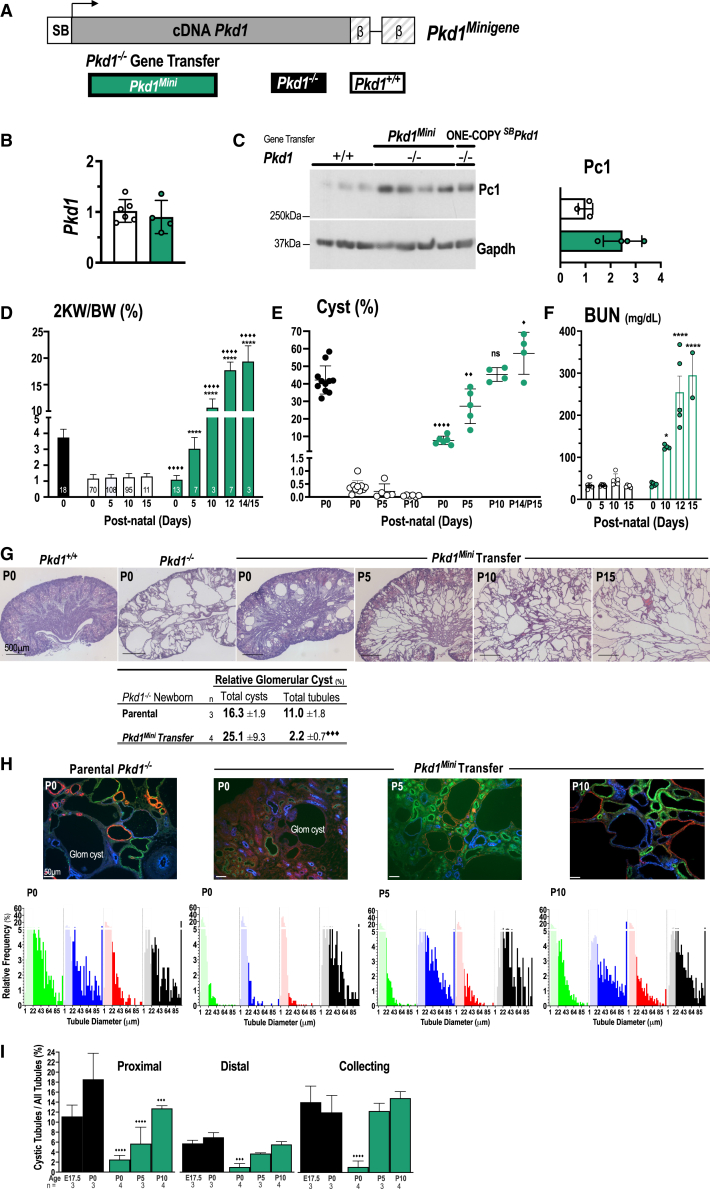
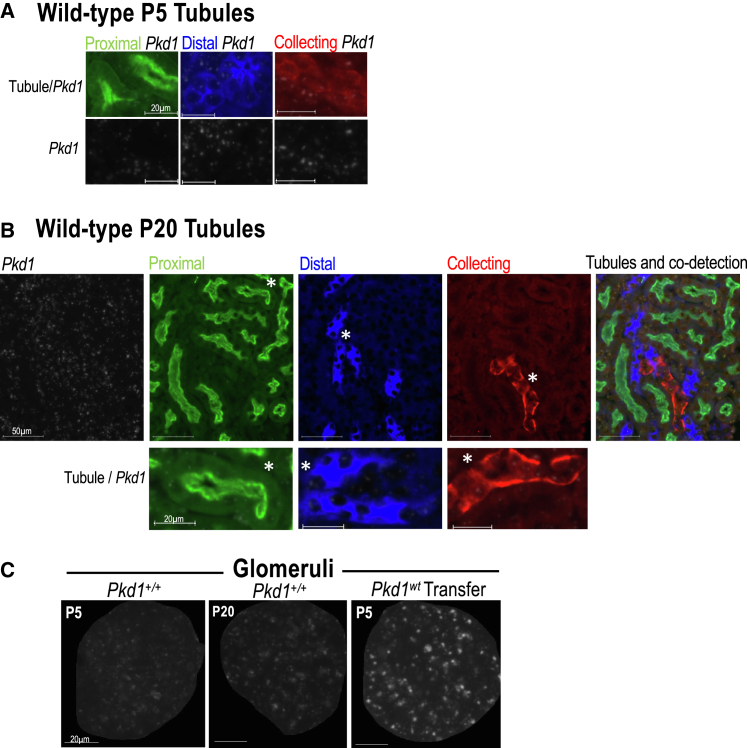
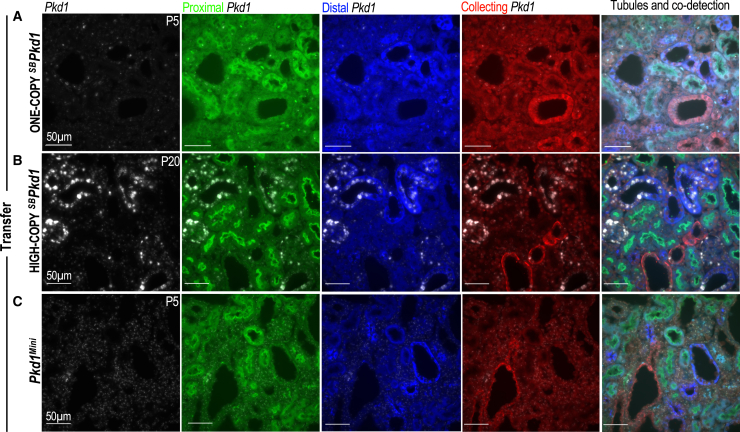
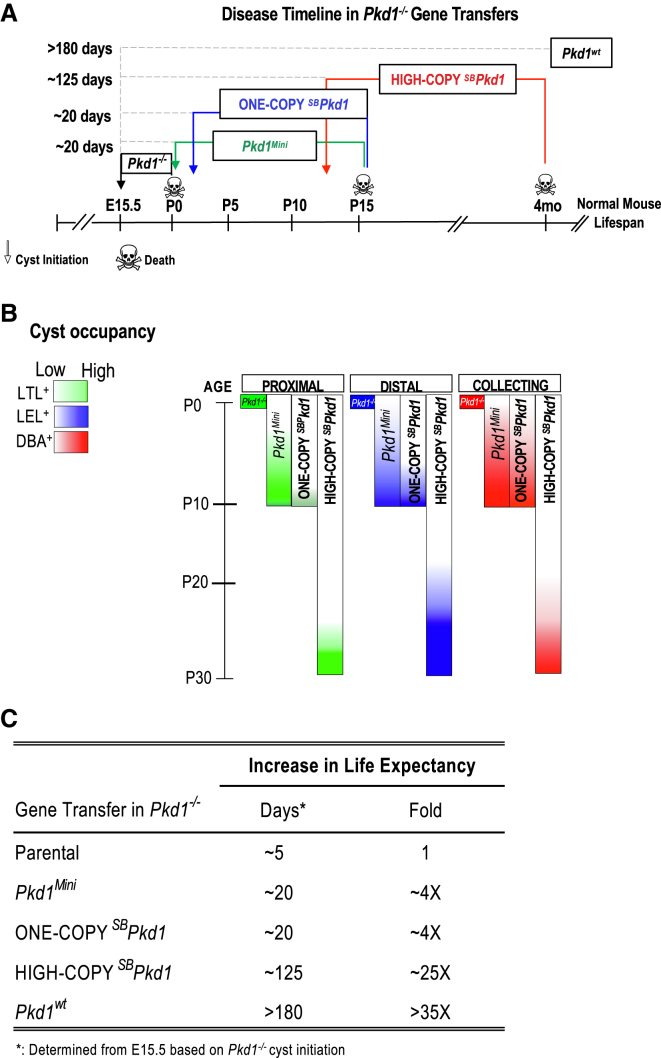
Autosomal dominant polycystic kidney disease (ADPKD) causes renal cysts and leads to end-stage renal disease in midlife due mainly to PKD1 gene mutations. Virtually no studies have explored gene therapeutic strategies for long-term effective treatment of PKD. Toward this aim, the severely cystic Pkd1-null mouse model was targeted with a series of transgene transfers using genomic Pkd1 under its regulatory elements (Pkd1wt), a kidney-targeted Pkd1 gene (SBPkd1), or Pkd1Minigene. The introduced Pkd1wt gene constructs with ∼8-fold overexpression display similar endogenous cellular profiles and full complementation of Pkd1-/- phenotype and establish the referral Pkd1 genomic length for proper regulation. SBPkd1 transgene transfer expressing 0.6- or 7-fold Pkd1 endogenous levels is sufficient to correct glomerular and proximal tubular cysts and to markedly postpone cysts in other tubular segments as well, showing that the small SB elements appreciably overlap with Pkd1 promoter/5' UTR regulation. Renal-targeted Pkd1Minigene at high copy numbers conveys an expression level similar to that of the endogenous Pkd1 gene, with widespread and homogeneous weak Pkd1 cellular signal, partially rescuing all cystic tubular segments. These transgene transfers determine that Pkd1 intragenic sequences regulate not only expression levels but also spatiotemporal patterns. Importantly, our study demonstrates that Pkd1 re-expression from hybrid therapeutic constructs can ameliorate, with considerably extended lifespan, or eliminate PKD.

Keywords: PKD mouse models; PKD transcriptional regulation; Pc1; Pkd1 RNAscope; Pkd1 gene therapy; Pkd1 locus/minigene; polycystic kidney disease; polycystin; small SB renal cassette.


Conflict of interest statement

The authors declare no competing interests.

Figures

None
Graphical abstract
Figure 1
Figure 1
Full-length genomic Pkd1 construct introduced into Pkd1 loss-of-function mouse model completely rescues PKD phenotype (A) Schematic representation of full-length Pkd1 gene construct, Pkd1wt, transferred in the Pkd1 loss-of-function model. Pr, Pkd1 promoter region; ∗RI, marked allele with EcoRI site. (B) Expression of Pkd1 gene in kidneys of Pkd1−/− mouse with two full-length Pkd1wt1 and Pkd1wt2 transgenes by TaqMan qPCR at birth. Pkd1 expression is normalized to Hprt1 and compared with wild-type (Pkd1+/+) kidneys as fold change. (C) Expression of polycystin-1 (Pc1) protein was carried out by immunoblot in newborn Pkd1−/− kidneys with Pkd1wt transfers. Gapdh served as a loading control. Quantitative evaluation of Pc1 expression was normalized to wild-type kidneys (Pkd1+/+) set as 1. (D) Renal histology of Pkd1 loss of function with Pkd1wt transfers (lines 1 and 2) is indistinguishable from that of wild-type normal kidneys: P0, birth; P30, 1 month; and 4M, 4 months. Number of mice is indicated in Table S2. H&E, scale as indicated.
Figure 2
Figure 2
Transgene transfer in Pkd1 loss-of-function mouse with full-length genomic SBPkd1 suppresses PKD phenotype (A) Full-length Pkd1 gene construct, SBPkd1, where “SB” 0.9 kb cassette replaces the Pkd1 promoter. The SBPkd1 allele is marked by ∗RI. Pkd1−/− transgene transfers and control mice are color coded below. (B) Pkd1 expression in Pkd1−/− mouse with one-copy or high-copy SBPkd1 transfer was analyzed by TaqMan qPCR at birth and normalized to Hprt1. Levels are indicated as fold change relative to wild-type kidneys. (C) Relative expression levels of Pc1 protein were assessed by immunoblot in Pkd1−/− kidneys with SBPkd1 transfers and normalized to wild-type kidneys set as 1. Gapdh served as a loading control. Pc1 quantification is on the right. (D) Longitudinal analysis of 2KW/BW percentage in Pkd1−/− with SBPkd1 transfers. Number of mice is indicated in bars. ∗∗∗∗p < 0.0001; ns, non-significant. (E) Cyst measurements (Cyst [%]) over time revealed substantial correction by SBPkd1 transfers in Pkd1−/− kidneys. ♦♦♦♦p < 0.0001; ♦♦p < 0.01; ns, non-significant. (F) BUN measurement analysis of Pkd1−/− with SBPkd1 transfers. ∗∗∗∗p < 0.0001. (G) Longitudinal renal histologic analysis in Pkd1−/− with one-copy or high-copy SBPkd1 transfer shows initiation of cysts in cortical region at P3 or in medulla at P10/P15, respectively, and then progression to all renal regions of the kidneys. Number of mice is indicated in Table S2. H&E, scale as indicated. (H) Representative sections of tubular cyst origin in the parental Pkd1−/−, Pkd1−/− with one-copy SBPkd1, or high-copy SBPkd1 transfer. Tubular segments were stained using immunofluorescent markers for proximal (green), distal (blue), and collecting (red) as depicted on the pictogram. Distribution of specific tubular segment diameter was analyzed at selected time points in the histogram (below) with colors matching to the tubular markers. The black histogram accounts for unstained, multistained, and glomerular cysts. Relative frequency of cysts from a specific tubular origin was quantified per total number of tubules of that same segment (below). Cystic diameter threshold was defined at ≥22 μm and the shaded area represents normal tubular size. (I) Global quantitative analysis of cystic tubular segments relative to all tubular segments in Pkd1−/− with one- or high-copy SBPkd1 transfers. Renal cysts with one-copy SBPkd1 are abrogated in proximal tubules, delayed in distal tubules, and incompletely rescued in collecting ducts during maturation. High-copy SBPkd1 transfer in kidneys of Pkd1−/− mice protected all tubular segments from developing cysts during maturation and, at post-maturation, was sufficient to suppress proximal and collecting tubular cyst development but insufficient for distal tubules. ♦♦♦♦p < 0.0001, ♦♦p < 0.01, p < 0.05.
Figure 3
Figure 3
PKD phenotype of Pkd1 loss-of-function mouse was markedly delayed by Pkd1Mini (A) Representation of Pkd1Mini with SB regulatory cassette adjoined to Pkd1 cDNA followed by β-globin sequences (β). Pkd1−/− with the Pkd1Mini gene and controls are color coded below. (B) Pkd1 expression in Pkd1−/− with the Pkd1Mini was quantified by TaqMan qPCR, normalized to Hprt1, and compared with wild-type kidneys as fold change. (C) Expression levels of Pc1 protein were evaluated by immunoblot, normalized to Gapdh, and compared with wild-type kidneys set as 1. Relative quantification of Pc1 expression is shown on the right. (D) Longitudinal analysis of 2KW/BW (%) in Pkd1−/− with the Pkd1Mini transfer showed drastical increased at P10–P15, in comparison with control Pkd1−/− and Pkd1+/+ groups (shared with Figure 2D). Number of mice is indicated in the bars. ∗∗∗∗p < 0.0001, Pkd1−/−♦♦♦♦p < 0.0001. (E) Cyst measurements (Cyst [%]) over time in Pkd1−/− mice with Pkd1Mini transfer were compared with Pkd1−/− mice (shared with Figure 2E). ♦♦♦♦p < 0.0001; ♦♦p < 0.01; p < 0.05; ns, non-significant. (F) BUN of Pkd1−/− with Pkd1Mini transfer was monitored relative to control groups (shared with Figure 2F). ∗∗∗∗p < 0.0001, ∗p < 0.05. (G) Histological renal phenotype progression in Pkd1−/− with Pkd1Mini transfer exhibits small cysts at birth, with numerous glomerular cysts. Frequency of glomerular cysts was determined as a function of total glomerular and tubular cysts or of total tubules (cystic and non-cystic). Number of mice for histology is indicated in Table S2. H&E, scale as indicated. (H) Representative sections of tubular cyst origin in parental Pkd1−/− and in Pkd1−/− with Pkd1Mini transfer by immunofluorescence. Histograms with color matching to the tubular markers indicate the relative frequency of cysts from a specific tubular origin per total number of tubules from that same segment (below) at P0, P5, and P10 and in Pkd1−/− kidneys at P0 (shared with Figure 2H). Black histogram accounts for unstained, multistained, and glomerular cysts. Cystic diameter threshold was defined at ≥22 μm and shaded area represents normal tubular size. Pkd1−/− with Pkd1Mini transfer exhibits fewer cysts in proximal tubular segment but readily detectable glomerular cysts (Glom cyst) as observed in Pkd1−/− kidneys. (I) Global quantification of cystic tubular segments relative to all tubular segments in Pkd1−/− with Pkd1Mini transfer. Pkd1−/− mice with Pkd1Mini markedly postponed the appearance of proximal cysts until at least P10 and delayed cysts in distal tubules until P5 and was insufficient to improve the percentage of collecting tubular cysts at P5. Newborn Pkd1−/− shared with Figure 2I. ♦♦♦♦p < 0.0001, ♦♦♦p < 0.001.
Figure 4
Figure 4
Endogenous Pkd1 tubular cell expression pattern in wild-type mouse kidney (A) Pkd1 cellular expression in wild-type kidney at P5 in individual tubular segments was carried out by in situ Pkd1 expression pattern detection (white dots; RNAscope) with co-detection by immunofluorescence of specific tubular markers. Wild-type proximal tubules correspond to very weak dot signals, distal and collecting tubules display substantially more abundant Pkd1 dot signals. (B) Wild-type kidney section at P20 with co-detection of Pkd1 by RNAscope and tubular segment markers. The top illustrates specifically Pkd1 signals from RNAscope ISH, tubular markers, and co-detection in kidneys. Proximal, distal, and collecting tubules with magnified region marked by asterisks with co-detection of Pkd1 dot signals are illustrated below. (C) Pkd1 expression in wild-type glomeruli at P5 and P20 by RNAscope. Distinct but weak Pkd1 signals are detected over mesangial cells at P5, which are of higher intensity at P20 and visible in visceral cells. Pkd1 expression in Pkd1−/− glomeruli with Pkd1wt2 transfer at P5 has a similar pattern with considerably more intense dot signals than wild-type glomeruli. Scale as indicated.
Figure 5
Figure 5
Spatial and cellular Pkd1 expression from transgene transfer in Pkd1−/− kidneys alone or merged with individual or all tubular markers (A) Kidneys of Pkd1−/− with one-copy SBPkd1 transfer at P5 by RNAscope exhibit generally weak Pkd1 signals in non-cystic and cystic tubules, with occasional intense dot signals distinctive from wild-type kidneys. Scale: 50 μm. (B) Kidneys of Pkd1−/− with high-copy SBPkd1 transfer at P20 have strong Pkd1 dot signals in comparison with one-copy SBPkd1. Pkd1 signals with high-copy SBPkd1 transfer are more intense in the majority of distal and collecting tubules than in proximal tubules. Signals are detected in non-cystic and small/intermediate cystic tubules and of mostly lower Pkd1 intensity in large cystic tubules. Scale: 50 μm. (C) Kidneys of Pkd1−/− with Pkd1Mini transfer at P5 display more diffuse and widespread Pkd1 signals with numerous dots of low intensity, whether of cystic or non-cystic tubules and regardless of the tubular segments. Large cysts in collecting tubules generally exhibit similar uniform low Pkd1 expression. Scale: 50 μm.
Figure 6
Figure 6
Comparison of Pkd1−/− gene-targeted transfer potential on PKD time-course progression or correction (A) Timeline of renal cyst initiation in Pkd1−/− mice at e15.5 and death by birth within 5 days. Pkd1−/− mice with Pkd1Mini transfer display cysts at birth until P15, whereas those with one-copy SBPkd1 transfer develop cysts later at P3 until P15. Pkd1−/− mice with high-copy SBPkd1 transfer initiate cysts between P10 and P15 and progress to severe cysts by ∼4 months. Pkd1−/− mice with Pkd1wt transfer have a completely rescued phenotype. (B) Schematic representation of cyst appearance and progression in different tubular segments, and severity over time for the three different transgene transfers. (C) Survival expectancy of Pkd1−/− mice, estimated as 5 days, is markedly extended from e15.5 to P15 or equivalent to a 20 day period for both transfers, Pkd1Mini or one-copy SBPkd1 in Pkd1−/− mice, an appraisal of significantly high impact. In Pkd1−/− mice with high-copy SBPkd1 transfer, the very slow kinetics of disease progression extended life expectancy by an impressive ∼25-fold. Pkd1−/− mice with Pkd1wt transfer are predicted to have a normal lifespan.

Similar articles

Cited by

References

    1. Michaud J., Russo P., Grignon A., Dallaire L., Bichet D., Rosenblatt D., Lamothe E., Lambert M. Autosomal dominant polycystic kidney disease in the fetus. Am. J. Med. Genet. 1994;51:240–246. - PubMed
    1. Novelli G., Frontali M., Baldini D., Bosman C., Dallapiccola B., Pachì A., Torcia F. Prenatal diagnosis of adult polycystic kidney disease with DNA markers on chromosome 16 and the genetic heterogeneity problem. Prenat. Diagn. 1989;9:759–767. - PubMed
    1. Gal A., Wirth B., Kääriäinen H., Lucotte G., Landais P., Gillessen-Kaesbach G., Müller-Wiefel D.E., Zerres K. Childhood manifestation of autosomal dominant polycystic kidney disease: no evidence for genetic heterogeneity. Clin. Genet. 1989;35:13–19. - PubMed
    1. MacDermot K.D., Saggar-Malik A.K., Economides D.L., Jeffery S. Prenatal diagnosis of autosomal dominant polycystic kidney disease (PKD1) presenting in utero and prognosis for very early onset disease. J. Med. Genet. 1998;35:13–16. - PMC - PubMed
    1. Boyer O., Gagnadoux M.F., Guest G., Biebuyck N., Charbit M., Salomon R., Niaudet P. Prognosis of autosomal dominant polycystic kidney disease diagnosed in utero or at birth. Pediatr. Nephrol. 2007;22:380–388. doi: 10.1007/s00467-006-0327-8. - DOI - PubMed