. 2023 May 6:31:100505.
doi: 10.1016/j.pacs.2023.100505. eCollection 2023 Jun.

Performance evaluation of mesoscopic photoacoustic imaging

Affiliations

Performance evaluation of mesoscopic photoacoustic imaging

Lina Hacker et al. Photoacoustics. .

Abstract

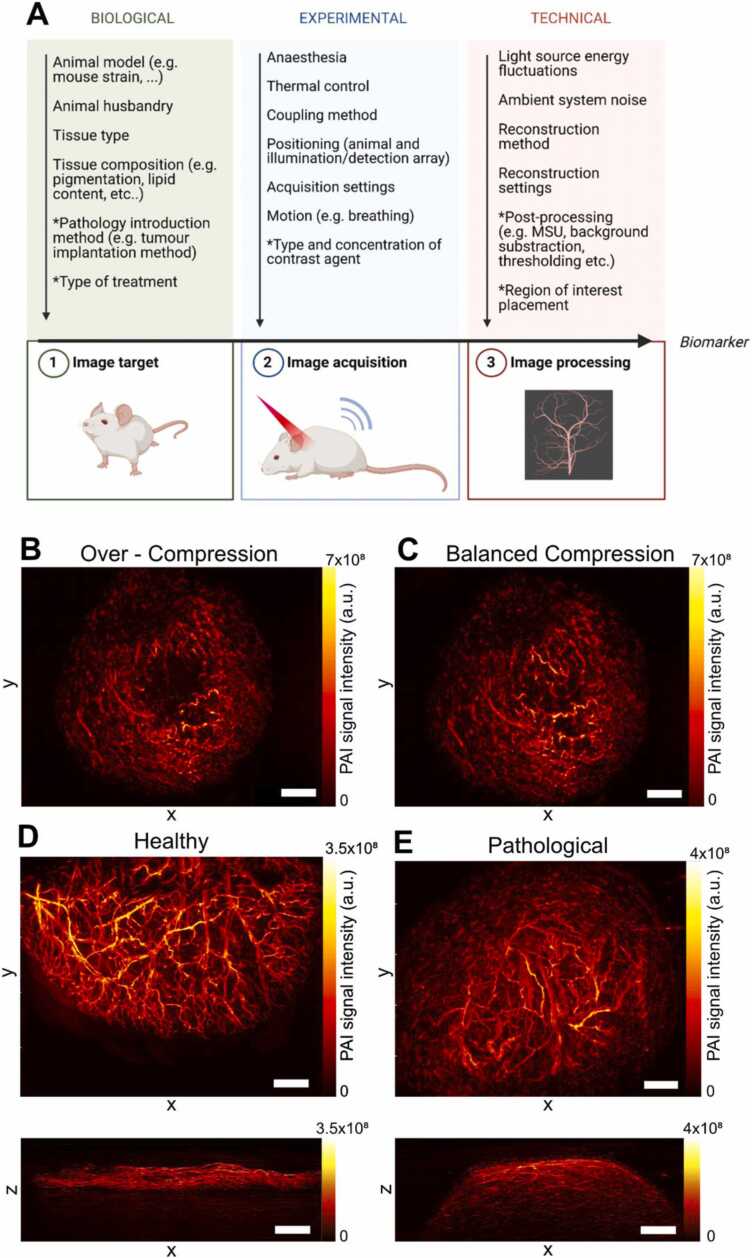
Photoacoustic mesoscopy visualises vascular architecture at high-resolution up to ~3 mm depth. Despite promise in preclinical and clinical imaging studies, with applications in oncology and dermatology, the accuracy and precision of photoacoustic mesoscopy is not well established. Here, we evaluate a commercial photoacoustic mesoscopy system for imaging vascular structures. Typical artefact types are first highlighted and limitations due to non-isotropic illumination and detection are evaluated with respect to rotation, angularity, and depth of the target. Then, using tailored phantoms and mouse models, we investigate system precision, showing coefficients of variation (COV) between repeated scans [short term (1 h): COV= 1.2%; long term (25 days): COV= 9.6%], from target repositioning (without: COV=1.2%, with: COV=4.1%), or from varying in vivo user experience (experienced: COV=15.9%, unexperienced: COV=20.2%). Our findings show robustness of the technique, but also underscore general challenges of limited-view photoacoustic systems in accurately imaging vessel-like structures, thereby guiding users when interpreting biologically-relevant information.

Keywords: Phantom; Photoacoustic mesoscopy; Precision; Raster-Scanning Optoacoustic Mesoscopy (RSOM); Repeatability; Reproducibility.


Conflict of interest statement

The authors declare the following financial interests/personal relationships which may be considered as potential competing interests Sarah Bohndiek reports a relationship with EPFL Center for Biomedical Imaging that includes: speaking and lecture fees. Sarah Bohndiek reports a relationship with PreXion Inc that includes: funding grants. Sarah Bohndiek reports a relationship with iThera Medical GmbH that includes: non-financial support.The authors declare the following financial interests / personal relationships, which may be considered as potential competing interests. Sarah Bohndiek reports a relationship with EPFL Center for Biomedical Imaging that includes: speaking and lecture fees. Sarah Bohndiek reports a relationship with PreXion Inc that includes: funding grants. Sarah Bohndiek reports a relationship with iThera Medical GmbH that includes: non-financial support. The other authors have no conflict of interest related to the present manuscript to disclose.

Figures

Fig. 1
Fig. 1
: Overview of the photoacoustic mesoscopy system. A) Photograph of the system. (i) denotes the scan head and (ii) the heated mouse bed. The scan head is enlarged in the second photograph. Top arrows are pointing on the two illumination fibres, whilst the bottom arrow points on the ultrasound (US) transducer. B) Schematic illustrating the functioning of the system. Created with Biorender.
Fig. 2
Fig. 2
: Phantom design for the technical validation studies. (A) The computer-aided designs of the outer (middle) and inner (right, left) modules used for this study are shown. Close-up side view of the image quality phantom modules: (B) String array allowing penetration depth and angular studies; (C) Tubing array allowing sensitivity studies. (D) Photograph of the 3D-printed string phantom module filled with agar and featuring targets at different depths (black arrows) is shown. Scalebars = 20 mm.
Fig. 3
Fig. 3
: Overview of artefacts arising in the photoacoustic mesoscopy system. Explanatory schematics (first row), XZ MIPs (second row), XY MIPs (third row), and line profiles (fourth row) for the respective white dotted lines in the RSOM images for: (A) illumination artefact; (B) shadow artefact; and (C) reflection artefact. In A, a single string is shown, whilst in B, and C dilutions of red ink in tubing are displayed. In B, a tube of absorber is positioned perpendicular and beneath tubes of varying relative concentrations (up to 100%). The underlying tubing has the same concentration as the overlaying tubing with the highest concentration (100%). In C, the agar phantom/ultrasound gel interface acts as an acoustic reflector. White arrows depict the respective artefact; blue and red arrows indicate the respective line profiles plotted in the last row; the black arrow depicts the reflection artefact in the line profile. The resolution of the system is axial: 10 µm; and lateral: 40 µm.
Fig. 4
Fig. 4
: Geometric sensitivity of the photoacoustic mesoscopy system. Phantom configuration (first column), XY MIPs (second column), quantified signal intensity values (third column) and FWHM (fourth column) for: phantom with strings at different depths (A-D, n = 7), phantom with horizontally angled strings (E-H, n = 8), phantom with vertical angled strings (I-L, n = 3). The field of view in the phantom configurations (corresponding to the MIPs) is marked in blue. The numbers in B depict the depth of the neighbouring string in mm. The direction of the optical fibres in F is marked with white arrows. Data displayed as mean ± SD. For figure G, significance was assigned using ANOVA (*p < 0.05, **p < 0.01, ***p < 0.001). Scale bars = 1.2 mm.
Fig. 5
Fig. 5
: Temporal stability of the photoacoustic mesoscopy system. Signal stability in an agar phantom over time is shown along four strings embedded at four different depths (A) without replacement of the phantoms and (B) with replacement of the phantom between each sequential image acquisition. Legend indicates string depth. (C) Signal stability of a string embedded in a copolymer-in-oil phantom over a time frame of 20 days.
Fig. 6
Fig. 6
: Biological and technical variation factors in photoacoustic imaging. A) Overview of biological and technical variation factors in photoacoustic imaging. MSU = Multispectral unmixing. Parameter marked with an asterisk describe variation factors that are only applicable in certain experiments/system types. Created with Biorender. B/C) Image acquisition in photoacoustic mesoscopy requires a balanced compression of the transducer interface on the tissue of interest. Whilst compression minimizes movement artefacts, it can also impact blood flow if applied too strongly, leading to signal loss (B). Balanced compression enables full visualization of all vessels (C). XY MIP of a PC3 tumour. Scale bar= 1.5 mm. Representative mesoscopic XY MIPs (top) and XZ MIPs (bottom) for healthy (ear, D) and pathological (tumour, E) tissue are shown. Scale bars 1.5 mm.
Fig. 7
Fig. 7
: Impact of time, positioning, tissue and operator-dependent variation sources on the signal stability of the mesoscopic system in vivo. A) Blood volume is shown over time in healthy (black, n = 6 ears, cell line model) and tumour tissue (green, n = 9 tumours, PDX) without replacement of the mouse. Blood volume has been normalised by dividing each value with the first data point in the time series. B) Dorsal (left) and lateral (right) positioning of the mouse are indicated (figure created with Biorender). C) Correlation of calculated blood volume between dorsal and lateral positioning of the mouse is shown (n = 161, PDX model, Spearman r = 0.7615, R2 =0.7687). D) Blood volume is shown in tumour tissue with replacement of the mouse by two different operators (each n = 5, inexperienced operator=black, experienced operator=green, PDX and cell line models). Blood volume has been normalised by dividing each value with the first data point in the time series. All data is shown as mean ± SD.

References

    1. Omar M., Aguirre J., Ntziachristos V. Optoacoustic mesoscopy for biomedicine. Nat. Biomed. Eng. 2019;3:354–370. - PubMed
    1. Aguirre J., et al. Precision assessment of label-free psoriasis biomarkers with ultra-broadband optoacoustic mesoscopy. Nat. Biomed. Eng. 2017;1:0068.
    1. Taruttis A., Ntziachristos V. Advances in real-time multispectral optoacoustic imaging and its applications. Nat. Photonics. 2015;9:219–227.
    1. Tanghetti MD E., Jennings J. A comparative study with a 755 nm picosecond Alexandrite laser with a diffractive lens array and a 532 nm/1064 nm Nd:YAG with a holographic optic. Lasers Surg. Med. 2018;50:37–44. - PubMed
    1. Schwarz M., Buehler A., Aguirre J., Ntziachristos V. Three-dimensional multispectral optoacoustic mesoscopy reveals melanin and blood oxygenation in human skin in vivo. J. Biophoton. 2016;9:55–60. - PubMed

LinkOut - more resources