[Preprint]. 2023 Nov 2:2023.05.09.539329.
doi: 10.1101/2023.05.09.539329.

A deep catalog of protein-coding variation in 985,830 individuals

Affiliations

A deep catalog of protein-coding variation in 985,830 individuals

Kathie Y Sun et al. bioRxiv. .

Abstract

Coding variants that have significant impact on function can provide insights into the biology of a gene but are typically rare in the population. Identifying and ascertaining the frequency of such rare variants requires very large sample sizes. Here, we present the largest catalog of human protein-coding variation to date, derived from exome sequencing of 985,830 individuals of diverse ancestry to serve as a rich resource for studying rare coding variants. Individuals of African, Admixed American, East Asian, Middle Eastern, and South Asian ancestry account for 20% of this Exome dataset. Our catalog of variants includes approximately 10.5 million missense (54% novel) and 1.1 million predicted loss-of-function (pLOF) variants (65% novel, 53% observed only once). We identified individuals with rare homozygous pLOF variants in 4,874 genes, and for 1,838 of these this work is the first to document at least one pLOF homozygote. Additional insights from the RGC-ME dataset include 1) improved estimates of selection against heterozygous loss-of-function and identification of 3,459 genes intolerant to loss-of-function, 83 of which were previously assessed as tolerant to loss-of-function and 1,241 that lack disease annotations; 2) identification of regions depleted of missense variation in 457 genes that are tolerant to loss-of-function; 3) functional interpretation for 10,708 variants of unknown or conflicting significance reported in ClinVar as cryptic splice sites using splicing score thresholds based on empirical variant deleteriousness scores derived from RGC-ME; and 4) an observation that approximately 3% of sequenced individuals carry a clinically actionable genetic variant in the ACMG SF 3.1 list of genes. We make this important resource of coding variation available to the public through a variant allele frequency browser. We anticipate that this report and the RGC-ME dataset will serve as a valuable reference for understanding rare coding variation and help advance precision medicine efforts.


Figures

Figure 1:
Figure 1:
Variant survey and ancestral population counts in RGC-ME A. Summed proportional ancestry (i.e., sum of weighted ancestry probabilities) at continental, sub-continental, and regional levels for 824,159 unrelated samples. All subsequent variant counts and surveys have been performed in this unrelated analysis set B. Count of variants unique to RGC-ME that are absent in gnomAD Exomes and TOPMed, broken down by singletons and variant functional category C. Variant counts in different functional categories, proportion of singletons, and per-individual median values. All counts are based on variants in the canonical transcript. pLOF includes frameshift, essential splice donor/acceptor (non-UTR) and stop gained categories
Figure 2:
Figure 2:
Gene-level constraint estimates representing heterozygous selection coefficients on fitness, shet, from RGC-ME A. Mean shet probability density for 16,704 canonical transcripts with 95% confidence intervals calculated with 10,000 bootstrapped samples from means of individual genes. B. Odds ratio for genes with shet cutoff > 0.075 to be included in each gene category listed on y-axis.
Figure 3:
Figure 3:. Missense regional constraint captured by MTR
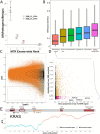
A. Odds ratios of ClinVar pathogenic versus benign variants in MTR ranking regions across the whole exome. The pink points represent MTR calculated with a 31 amino-acid sliding window using 824K unrelated samples from RGC-ME and the yellow points represent a random subset of 225K samples. B. MTR ranking distribution of different protein functional regions. From left, each category’s distribution of MTR exome-wide ranks was centered at a significantly different location compared to the next category to its right with Wilcoxon rank-sum test (largest p-value =5×10⁻¹⁰). C. MTR scores of 6.5 million amino acid sites containing missense variants observed from 824K samples against their GERP++ score average on the amino acid site. Cyan dots are overlaid to show sites that are predicted to be deleterious by five missense effect prediction tools. The dotted box highlights sites that are human missense constrained but not cross-species conserved and includes missense variants that have MTR<=0.52 (MTR 1% exome-wide rank) and GERP++ score < 2. D. Distribution of the gene proportion located in exome-wide top 1% MTR regions against the heterozygous selection coefficient, shet. Genes with significant proportion in most constrained 1% MTR region are colored in orange and red (FDR < 0.1, binomial tests), stratified by LOF constraint (shet=0.075). Red dots label genes with missense-specific constrained regions that are LOF-tolerant E. MTR track of a cancer oncogene, KRAS, a missense-specific constrained gene, along with the domain structure of the protein. Blue MTR constraint region is defined by top 1% exome-wide MTR rank.
Figure 4:
Figure 4:
Rare homozygous pLOF variants and “human knockouts” in RGC-ME A. Distribution of the number of individuals per gene knockout on the log10 scale B. Breakdown of the number of putative gene KOs observed in RGC-ME by ancestry. C. Projected accrual of putative gene KOs at hypothetical cohort sizes for each ancestral group in 1.01M related individuals. Curves reflect accrual of the expected number of genes with at least 1, 5, and 10 carriers, respectively, of a homozygous variant.
Figure 5:
Figure 5:
Fst distributions across allele frequency and functional classes. Proportion of high FST (>0.05) variants by allele frequency in Europeans for (A) synonymous variants and (B) missense variants. Several European rare/low-frequency exonic variants (shaded blue area) are more differentiated in Africans, Admixed Americans, and East Asians compared to South Asians.
Figure 6:
Figure 6:. Identification of variants that are predicted to affect splicing
A. The mutability-adjusted proportion of singletons (MAPS) across different functional categories. Error bars represent standard error of the mean of the proportion of singletons. The blue and green dashed lines represent the SpliceAI and MMSplice score thresholds respectively for variants that have a MAPS score equal to that of missense 5/5 (predicted deleterious by 5 algorithms) variants. Variants with spliceAI score >= 0.37 or MMSplice score >= 0.97 are predicted to be deleterious splicing-affecting variants B. Enrichment of ClinVar pathogenic variants in predicted splice-affecting variants compared with corresponding variant sets filtered by either LOFTEE, 5/5 missense deleteriousness models, or CADD20 C. Empirical validation of MAPS predicted splice-affecting variants Left panel: fraction of predicted splice-affecting variants (intersection set) validated as splice disrupting variants (SDVs) in any of the three splice reporter assays Right panel: enrichment of predicted splice-affecting variants in SDVs compared to non-SDVs

References

    1. Baxter S. M. et al. Centers for Mendelian Genomics: A decade of facilitating gene discovery. Genet Med 24, 784–797, doi:10.1016/j.gim.2021.12.005 (2022). - DOI - PMC - PubMed
    1. Karczewski K. J. et al. The mutational constraint spectrum quantified from variation in 141,456 humans. Nature 581, 434–443, doi:10.1038/s41586-020-2308-7 (2020). - DOI - PMC - PubMed
    1. Van Hout C. V. et al. Exome sequencing and characterization of 49,960 individuals in the UK Biobank. Nature 586, 749–756, doi:10.1038/s41586-020-2853-0 (2020). - DOI - PMC - PubMed
    1. Lek M. et al. Analysis of protein-coding genetic variation in 60,706 humans. Nature 536, 285–291, doi:10.1038/nature19057 (2016). - DOI - PMC - PubMed
    1. Backman J. D. et al. Exome sequencing and analysis of 454,787 UK Biobank participants. Nature 599, 628–634, doi:10.1038/s41586-021-04103-z (2021). - DOI - PMC - PubMed

Publication types