[Preprint]. 2023 May 11:rs.3.rs-2813616.
doi: 10.21203/rs.3.rs-2813616/v1.

IFNα induces CCR5 in CD4+ T-cells, causing its anti- HIV inefficiency and its subsequent pathogenic elevation, partially controlled by anti-HIV therapy

Affiliations

IFNα induces CCR5 in CD4+ T-cells, causing its anti- HIV inefficiency and its subsequent pathogenic elevation, partially controlled by anti-HIV therapy

Hélène Le Buanec et al. Res Sq. .

Update in

Abstract

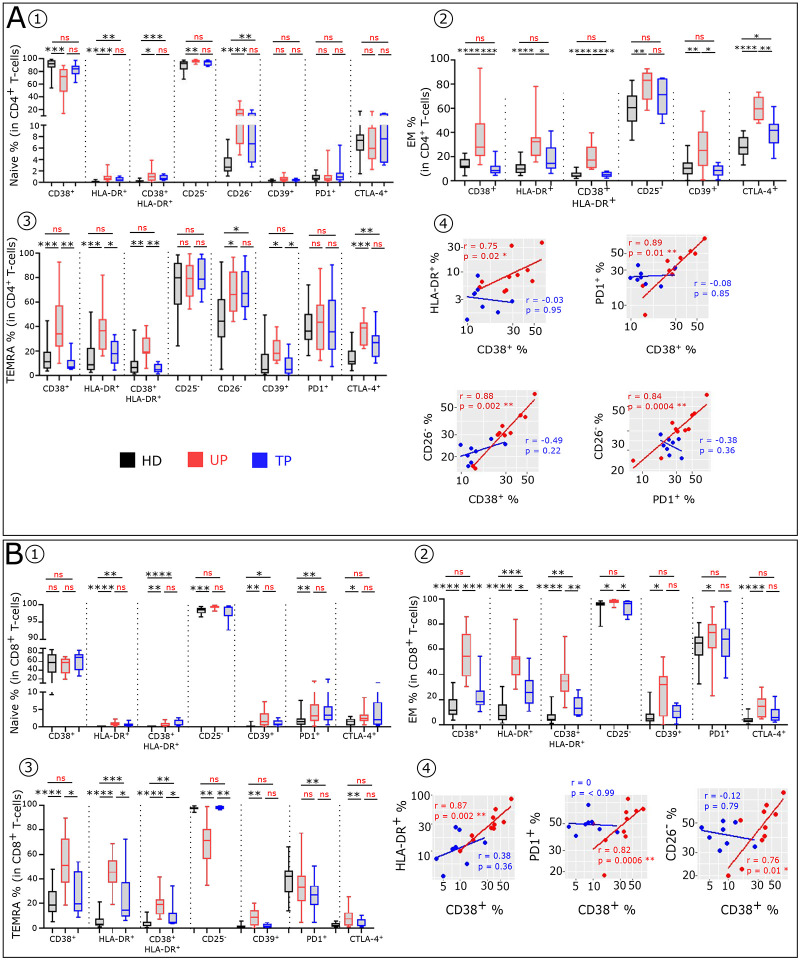
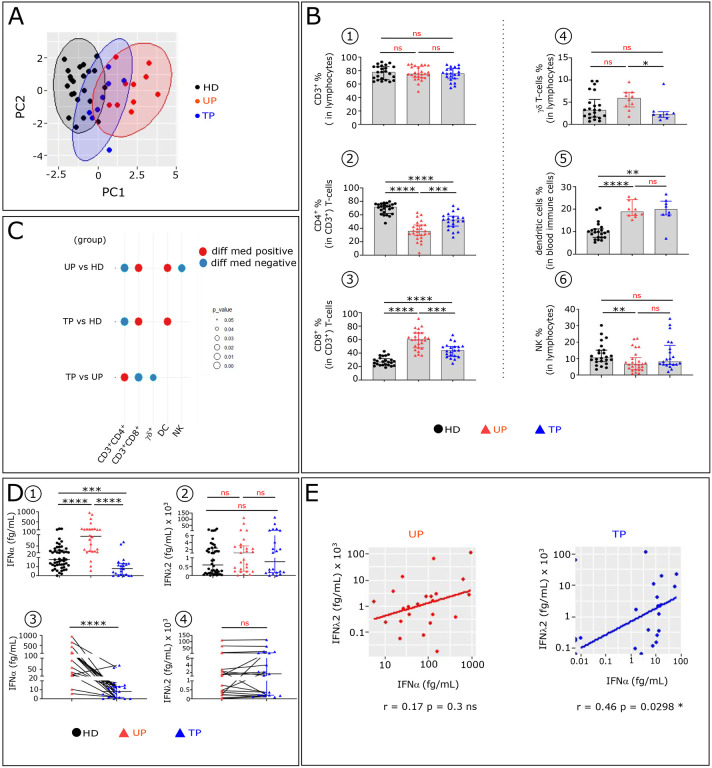
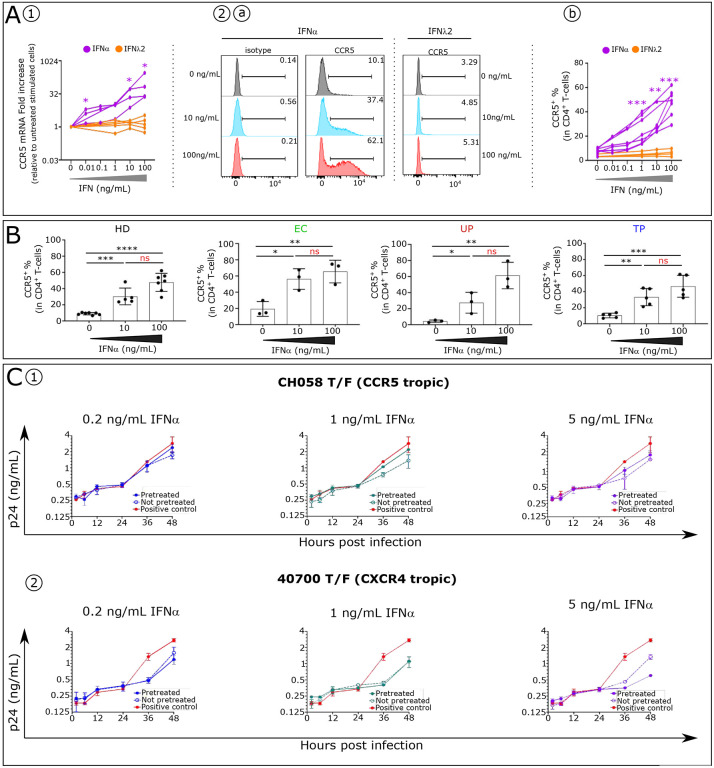
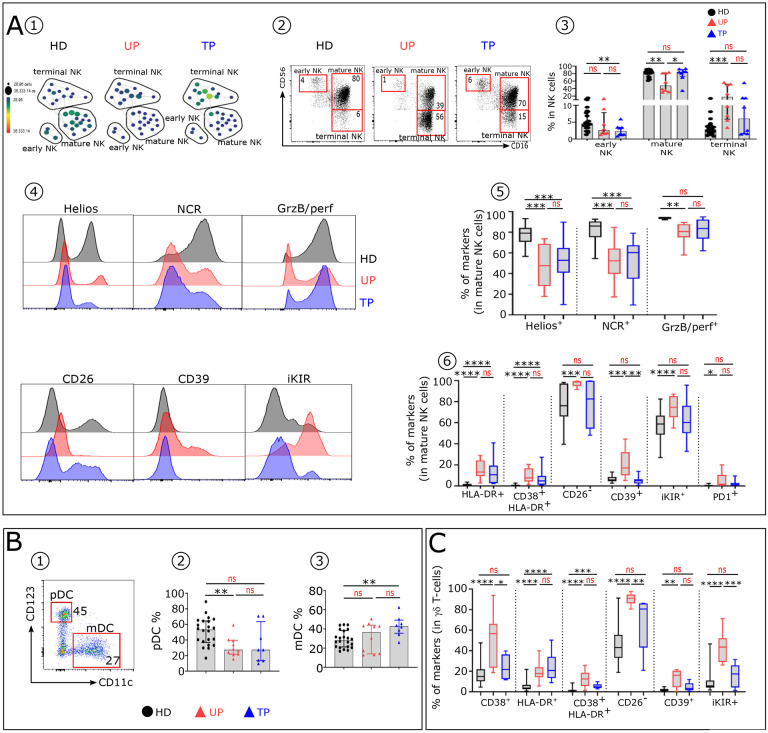
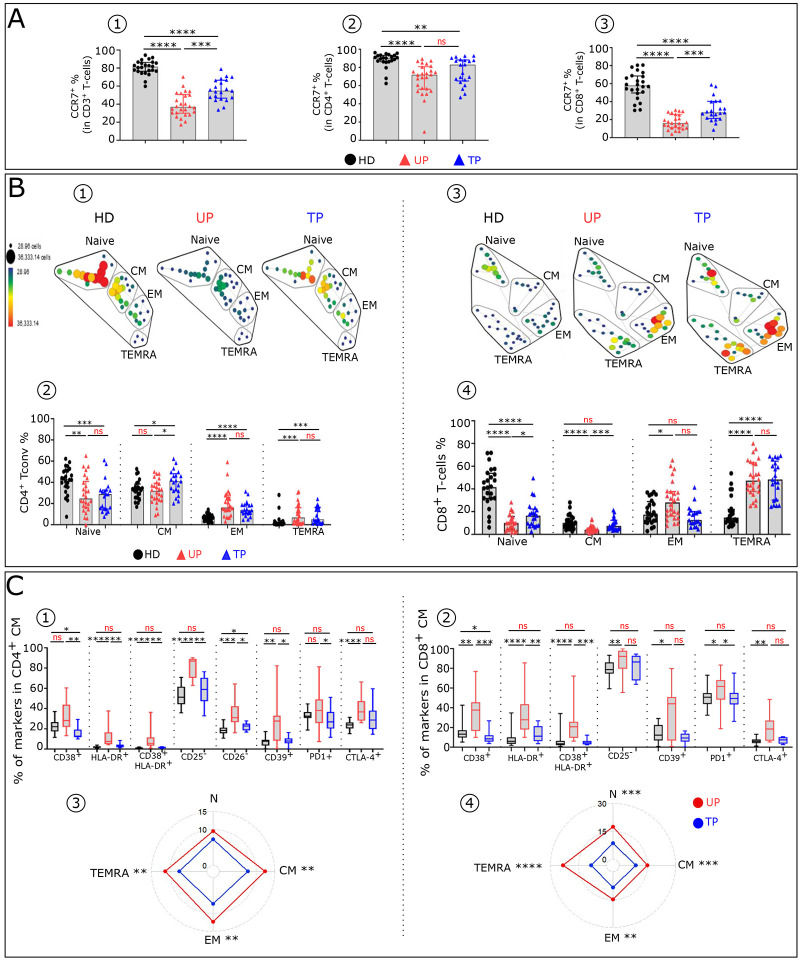
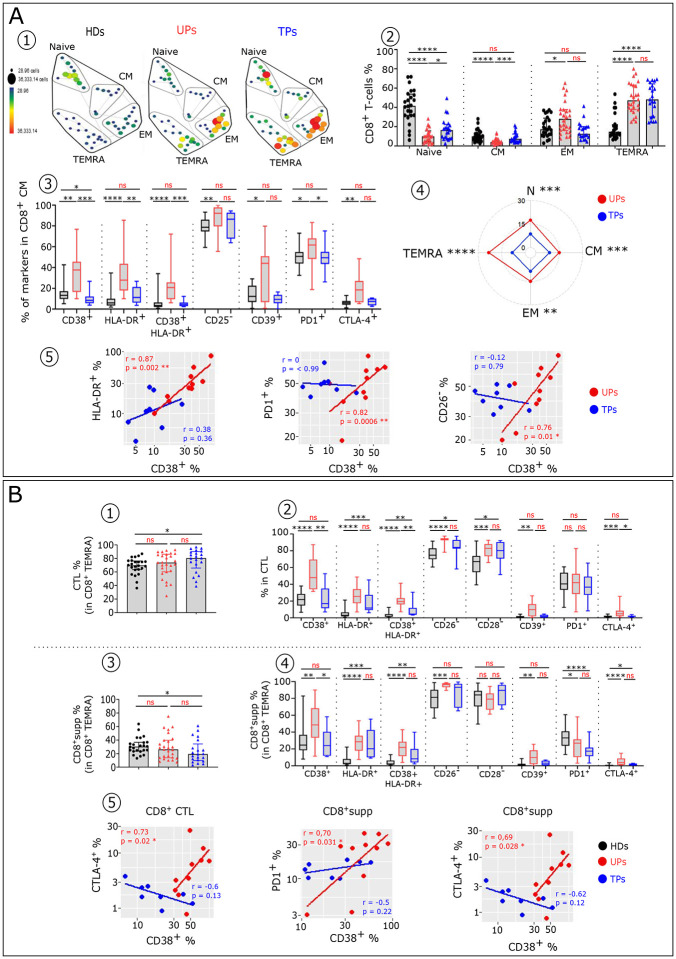
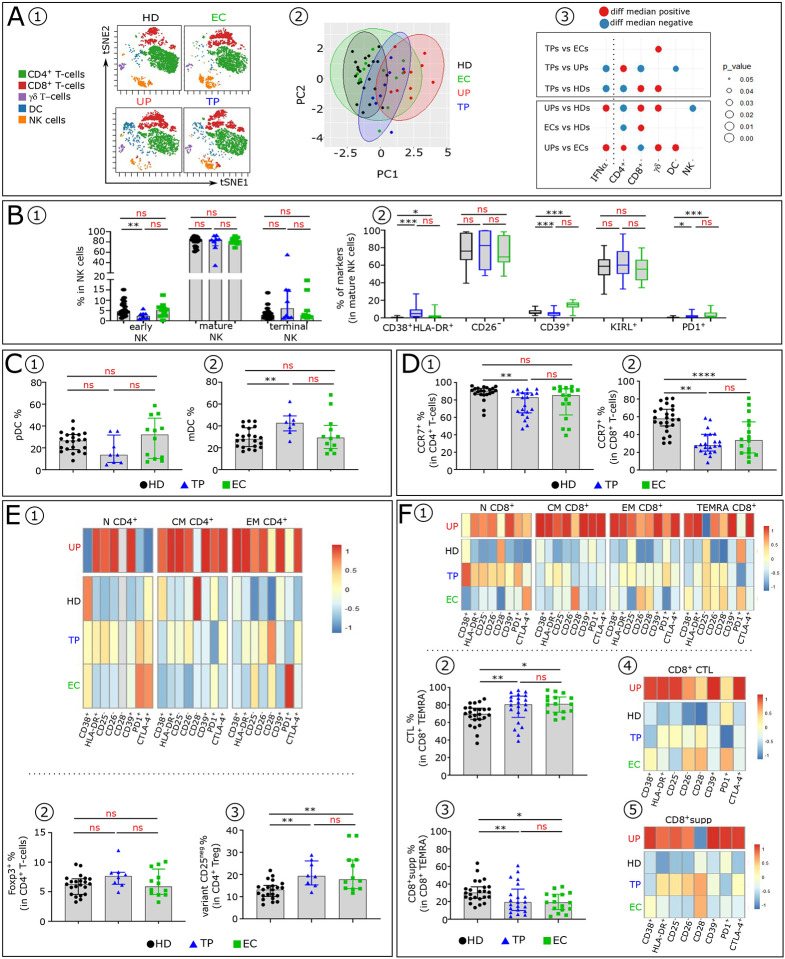
Like EC, we find that ART-treated patients control serum IFNα concentration and show few immune cell alterations enabling a healthy but fragile medical status. However, treatment interruption leads to elevated IFNα reflecting virus production indicating that like EC, ART does not achieve a virological cure. The immune system becomes overwhelmed by multiple immune cell abnormalities as found in untreated patients. These are chiefly mediated by elevated IFNα inducing signaling checkpoints abnormalities, including PD1, in cytotoxic immune cells. Importantly, during acute infection, elevated IFNα correlated with HIV load and we found that IFNα enhances CCR5, the HIV coreceptor in CD4+ T-cells, impairing its anti-viral response and accounting for the pathogenic vicious cycle: HIV → IFNα ↗ → infected CD4+ T-cells ↗ →HIV ↗. This study opens immunotherapeutic perspectives showing the need to control IFNα in order to convert ART patients into EC.


Conflict of interest statement

Additional Declarations: There is NO Competing Interest.

Figures

Extended data Fig. 1:
Extended data Fig. 1:. Gating strategy for immune cell types.
A- Gating strategy for immune cell types. The gating strategy used to identify the main cellular subsets is presented. Arrows are used to visualize the relationships across plots, and numbers are used to call attention to populations described here. After doublets and dead cells were excluded, lymphocytes were gated based on FSCA/SSC A properties. From the CD14CD19 lymphocyte gate, the following populations were identified: CD3+TCRγδ+, TCRγδ were subdivided in CD3 and CD3+ T-cells. NK cells were defined as CD3−TCRγδ−HLADR−and classified as early NK (CD56+CD16−), mature NK (CD56+CD16+), and terminal NK (CD56−CD16+) cells. The CD3+TCRγδ− population was divided in CD4+ and CD8+ Tcells. In CD4+ Tcells subpopulation, CCR7+ and CD45RA+ were used to further classify these cells in four subpopulations: N (CCR7+CD45RA+), CM (CCR7+CD45RA), EM (CCR7CD45RA) and TEMRA (CCR7CD45RA+). Tregs were identified from the CD4+ population using Foxp3 expression. Foxp3+ cells were classified in naïve and memory Treg cells using CD45RA and CD25 markers. CD45RACD25+ represent the memory Treg cells population. As for CD4+ T-cells, CD8+ T-cells were classified using CD45RA and CCR7 markers: four populations were identified: N (CCR7+CD45RA+), CM (CCR7+CD45RA), EM (CCR7CD45RA) and TEMRA (CCR7CD45RA+). Among TEMRA CD8+ Tcells, we distinguished two cytotoxic subpopulations: iKIR+ (CD8+supp) and iKIR (CTL). Dendritic cells (DCs) were identified by gating on CD3CD19CD56CD14HLADR+ and from there CD123+CD11c (pDCs) and CD11c+CD123 mDCs were identified. B- Specific markers analysed in each immune cell subsets.
Extended data Fig. 2:
Extended data Fig. 2:. Comparative immune phenotypic analysis of CD4+ and CD8+ T-cell subsets in UP, TP and in HD.
(A) Boxplots showing the expression of indicated marker in CD4+ naive (A1), EM (A2) and TEMRA (A3) Tconv across the group (HD n=22, UP n=10 and TP n=8). (A4) Scatterplots showing relationships between the expression level of indicated markers in the CD4+CM subsets (UP n=10 and TP n=8). (B) Boxplots showing the expression of indicated marker in CD8+ naive (B1), EM (B2) and TEMRA (B3) populations across the group (HD n=22, UP n=10 and TP n=8). (B4) Scatterplots showing relationships between the expression level of indicated markers in the CD8+CM subsets (UP n=10 and TP n=8).
Extended data Fig. 3:
Extended data Fig. 3:. TP and EC share few blood immune cell anomalies.
(A) Boxplots showing the expression of indicated marker in CD4+ naive (A1), CM (A2), EM (A3) and TEMRA (A4) populations across the group. (B) Boxplots showing the expression of indicated marker in CD8+ naive (B1), CM (B2), EM (B3) and TEMRA (B4) populations, and in TEMRA, CTL (B5) and CD8+supp (B6) across the group (HD n=22, EC n=10 and TP n=8).
Figure 1:
Figure 1:. Comparative analysis of major blood immune cell subsets and serum IFNs concentrations in UP, TP and HD.
(A) Principal component analysis (PCA) of studied participants is based on the proportion of different cell subpopulations (CD4+, CD8+ and TCR γδ T-cells, NK and DC) evaluated by flow cytometry, as depicted in extended data Fig. 1. The first two Principal components (PC1 and PC2), representing the greatest differences among individuals, are represented on a bi-plot. Each point represents one participant, colored by the group they belong to. Each group is outlined by an ellipse representing the 95% confidence interval of the sample groupings. (B) Histograms showing distributions of indicated immune cell populations between HD (Black, n=22), UP (red, n=26), and TP (blue, n=21). (C) Balloon-plot summarizing the statistically significant changes in the indicated immune cell populations between UP and HD, TP and HD and TP and UP. The size of the circle represents the p-value. Red and blue colors show increased or decreased frequencies of the immune cell populations respectively. (D) Scatter plots showing IFNα and IFNλ2 concentration in serum from HD (n=51), UP (n=26) and TP (n=22). Levels of IFNα and IFNλ2 were detected by SIMOA in unpaired (D1, D2) and paired patients (D3, D4). (E) Scatter plot showing relationships between IFNα and IFNλ2 serum levels in the 22 paired UP and TP. Correlations were evaluated with Spearman’s rank correlation test. Differences between unpaired samples and paired samples were performed with Mann-Whitney and Wilcoxon tests respectively. Graph show the median values and p values (*P<0.05, **P<0.01, ***P<0.001, ****P<0.0001)
Figure 2:
Figure 2:. Elevated IFNα effect on HIV coreceptor CCR5 expression in human CD4+ T and on release of circulating HIV by infected CD4+ T-cells.
(A) CCR5 expression analysis (A1) at the mRNA levels by RT-qPCR and (A2) protein levels by flow cytometry in stimulated CD4+ T-cells with different concentration of IFNα and IFNλ2 are shown. Differences between unpaired samples were performed with Mann-Whitney test. Graph show the median values and p values (*P<0.05, **P<0.01, ***P<0.001, ****P<0.0001) (B) Histograms showing CCR5 frequency in CD4+ T-cells stimulated with different IFNα concentrations in each studied group (HD n=7, EC n=3, UP n=3 and post cART n=5). Significance was determined by unpaired Mann-Whitney U test. *P<0.05, **P<0.01, ***P<0.001, ****P<0.0001, ns: not significative. (C) PBMCs from a health donor were stimulated in the presence (pretreated) or absence (not pretreated) of IFNα for 4 days. The stimulated cells were infected by the CH058 T/F virus (CCR5 tropic) (C1) or the 40700 T/F virus (CXCR4-tropic) (C2). Upon infection, the cells were cultured with corresponding concentration of IFNα for 48 hours. For the positive control, the infected cells (not pretreated) were cultured in the absence of IFNα to determine the normal replication kinetics of the virus. The p24 concentration in the culture supernatants was measured at 2 h, 6 h, 12 h, 24 h, and 48 h post infection. The infections were performed in duplicate, and the error bar represents the standard deviation (SD).
Figure 3:
Figure 3:. TP distribution analysis of blood innate immune cells show a fewer percentage and fewer phenotypic alterations compared to UP.
(A1) SPADE tree showing the distribution of NK-cell subsets in HD, UP and TP. Nodes are colored by count. (A2) Representative Flow Cytometry plots of NK-cell subsets gated on CD19CD14TCRγδCD3HLA-DR cells from the 3 studied groups: early NK (CD56brightCD16), mature NK (CD56dimCD16+) and terminal NK (CD56CD16+). (A3) Frequency of early, mature, and terminal NK in each studied group (HD n=22, UP n=10 and TP n=8). (A4) Histograms displaying the expression level of Helios, NCR (NKp30, NKp44, NKp46), GrzB/perf, CD26, CD39 and iKIR on mature NK cells from HD (black), UP (red) and TP (blue). (A5 and A6) Box plots displaying the frequency of the indicated markers in mature NK-cells in each studied group. (B1) Representative dot plot showing how to distinguish pDC (CD123+ CD11C) and mDC (CD123CD11C+) subsets within the HLA-DR+ lin population in HD. Histograms showing the frequencies of pDC (B2) and mDC (B3) across the groups (HD n=22, UP n=10 and TP n=8). (C) Proportion of specific markers on TCR γδ T-cells of each studied group (HD n=22, UP n=10 and TP n=8). Significance was determined by unpaired Mann-Whitney U test. *P<0.05, **P<0.01, ***P<0.001, ****P<0.0001.
Figure 4:
Figure 4:. Residual T-cell phenotypic profile abnormalities in TP
(A) Histograms showing the frequencies of CCR7 in CD3+ (A1), CD4+ (A2) and CD8+ (A3) T-cells across the groups (HD n=2, UP n=26 and TP n=22). (B) SPADE tree showing the distribution of CD4+ T conv (B1) and CD8+ T-cell (B3) subsets in HD, UP and TP. Nodes are colored by count. CD4 + Tconv and CD8+ T-cells can be classified into four major subsets by their expression of CD45RA and the chemokine receptor CCR7: naïve (CCR7+CD45RA+); CM (CCR7+CD45RA), EM (CCR7CD45RA) and TEMRA (CCR7CD45RA+). Frequency of Naïve, CM, EM and TEMRA CD4+ Tconv (B2) and CD8+ T-cells (B4) in each studied group (HD n=22, UP n=26 and TP n=22). Boxplots showing the expression of indicated marker in CD4+CM (C1) and CD8+CM (C2) across the groups (HD n=22, UP n=10 and TP n=8). Radar chart showing a composite score of phenotypic cell alteration calculated for each CD4+ Tconv (C3) and CD8+ T-cell (C4) subpopulations in UP and TP (see Methods). Significance was determined by unpaired Mann-Whitney U test, and correlation with Spearman’s rank correlation test. *P<0.05, **P<0.01, ***P<0.001, ****P<0.0001.
Figure 5:
Figure 5:. Treg and cytotoxic CD8+ T-cells from TP exhibit residual phenotypic abnormalities.
(A1) Representative flow cytometry plots of CD25+ Foxp3+ cells within CD4+ T-cells isolated from HD, UP and TP. (A2) Histograms showing the frequency of Foxp3 in CD4+ T-cells. (A3) Histograms displaying the expression level of CD25 in CD4+ Foxp3+ T-cells and (A4) the frequency of Treg CD25 variant in CD4+Foxp3 T-cells in each studied group. (A5) Proportion of specific functional signaling checkpoints on memory CD4+ Treg (CD4+ Foxp3+CD25+ CD45RA) of each studied group (HD n=22, UP n=10 and TP n=8). (B) Histograms showing the frequency of CD8+ CTL (CD8+TEMRA iKIR (B1) and CD8+supp (CD8+TEMRA iKIR+) (B3) in each studied group (HD n=22, UP n=26 and TP n=22). Box plots showing the proportion of specific markers on CD8+ CTL (B2) and CD8+supp (B4) T-cell subsets of each studied group (HD n=22, UP n=10 and TP n=8). (B5) Scatterplots showing relationships between the expression level of indicated markers in the CD8+ cytotoxic T-cells (CD8+ CTL and CD8+supp) (UP n=10 and TP n=8). Significance was determined by unpaired Mann-Whitney U test, and correlation with Spearman’s rank correlation test. *P<0.05, **P<0.01, ***P<0.001, ****P<0.0001.
Figure 6:
Figure 6:. TP and EC share few blood immune cell anomalies.
(A1) Representative viSNE plot showing major immune cell subpopulations distribution (CD4+, CD8+ and TCR γδ T-cells, NK and DC) in HD, UP, TP and EC, evaluated by flow cytometry. (A2) PCA scatter plots of samples based on proportion of the different major lymphocyte subpopulations indicated above. Each group is outlined by an ellipse representing the 95% confidence interval of the sample groupings. (A3) Balloon-plot summarizing the statistically significant changes in the indicated immune cell populations between each compared group. (B1) Frequency of early, mature and terminal NK in each studied group (HD n=22, TP n=8 and EC n=12). (B2) Box plots displaying indicated markers frequency in mature NK-cells in each studied group. Histograms showing the frequencies of pDC (C1) and mDC (C2) across the groups (HD n=22, TP n=8 and EC n=12). Histograms showing CCR7 frequency in CD4+ (D1) and CD8+ (D2) T-cells across the groups (HD n=22, TP n=8 and EC n=12). (E1) Heatmap showing indicated markers frequency in CD4+N, CM and EM. (E2) Histograms showing Foxp3 frequency in CD4+ T-cells and (E3) Treg CD25 variant frequency in CD4+Foxp3 T-cells in each studied group. (F1) Heatmap showing indicated markers frequency in CD8+N, CM EM and TEMRA. Histograms showing the frequency of CD8+ CTL (F2) and CD8+supp (F3) in each studied group (HD n=22, TP n=8 and EC n=12). Heatmap showing indicated markers frequency in CD8+ CTL (F4) and in CD8+supp (F5) in each studied group (HD n=22, TP n=8 and EC n=12).

References

    1. Leon A. et al. Rate and predictors of progression in elite and viremic HIV-1 controllers. AIDS 30, 1209–1220 (2016). - PubMed
    1. Maggi P. et al. Cardiovascular risk and dyslipidemia among persons living with HIV: a review. BMC Infect Dis 17, 551 (2017). - PMC - PubMed
    1. Zhou Q. et al. Malignancies in people living with HIV. AIDS Rev (2022) doi:10.24875/AIDSRev.21000057. - DOI - PubMed
    1. Rasch M. G. et al. Renal function and incidence of chronic kidney disease in HIV patients: a Danish cohort study. Scand J Infect Dis 44, 689–696 (2012). - PubMed
    1. Kruger M. J. & Nell T. A. Bone mineral density in people living with HIV: a narrative review of the literature. AIDS Res Ther 14, 35 (2017). - PMC - PubMed

Publication types