[Preprint]. 2023 May 9:2023.05.08.539701.
doi: 10.1101/2023.05.08.539701.

Charting the cellular biogeography in colitis reveals fibroblast trajectories and coordinated spatial remodeling

Affiliations

Charting the cellular biogeography in colitis reveals fibroblast trajectories and coordinated spatial remodeling

Paolo Cadinu et al. bioRxiv. .

Update in

Abstract

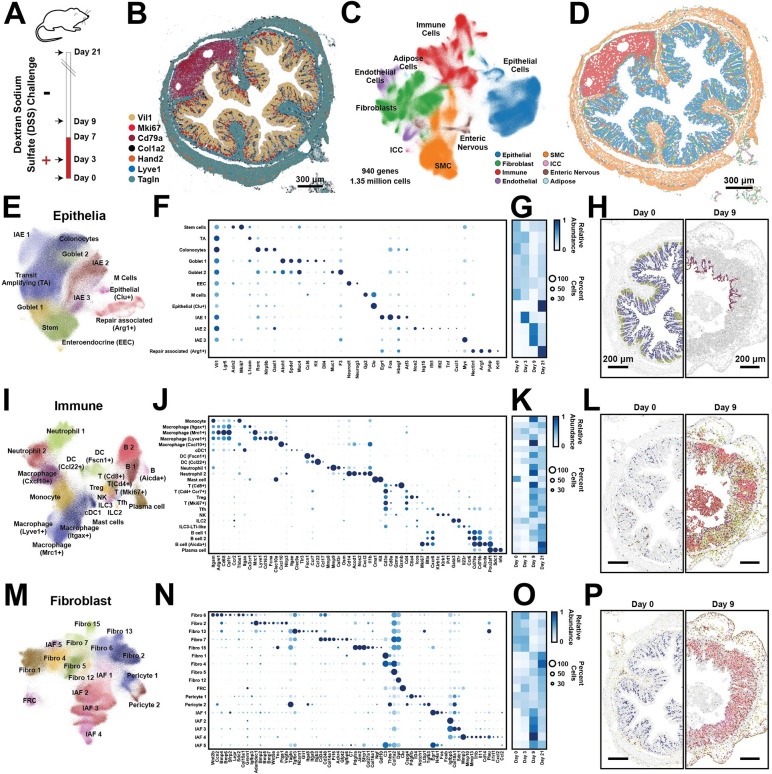
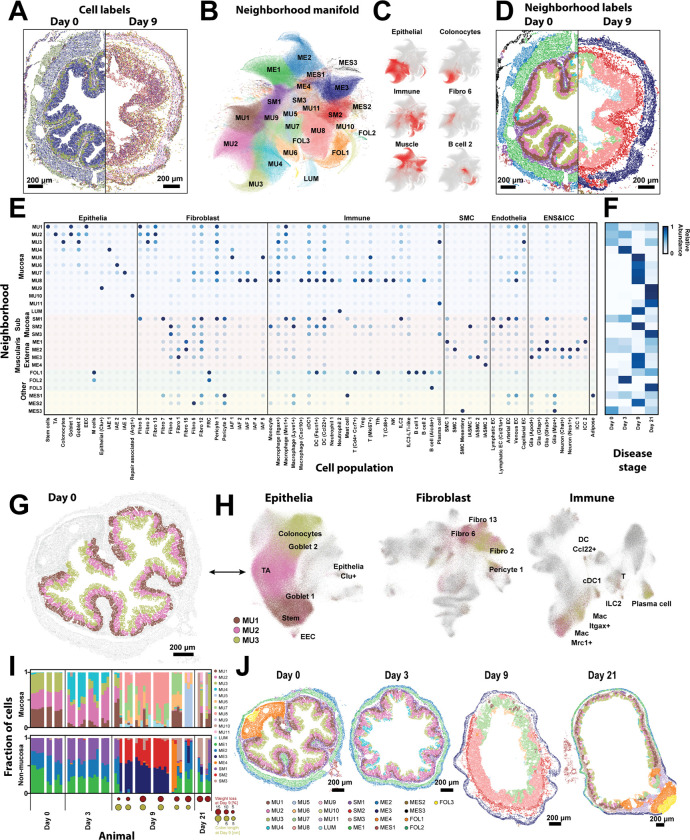
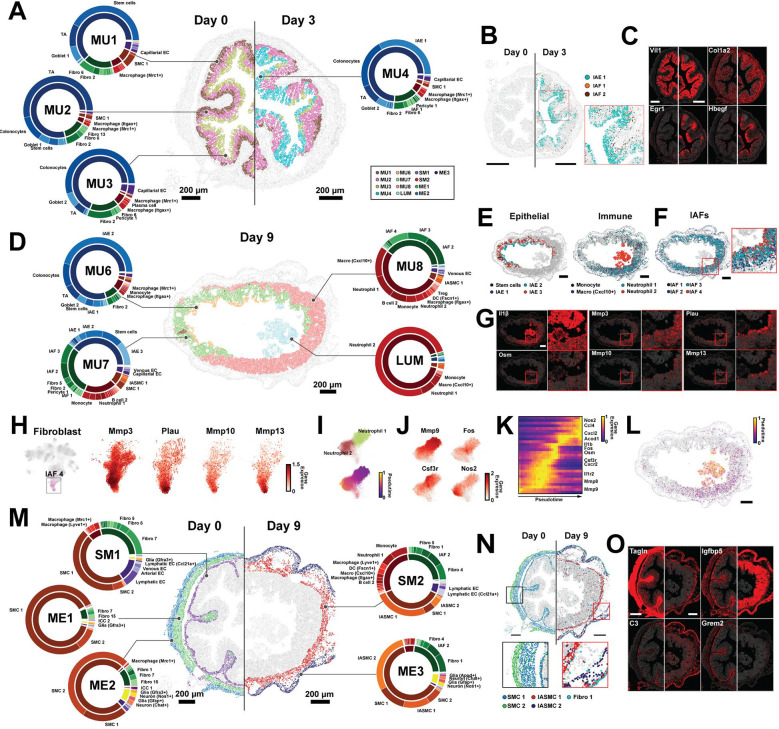
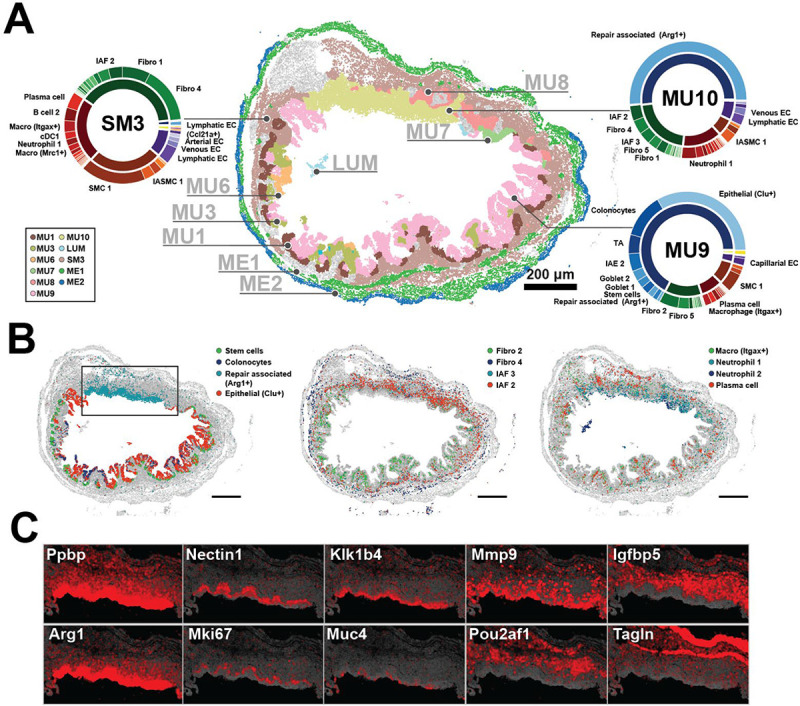
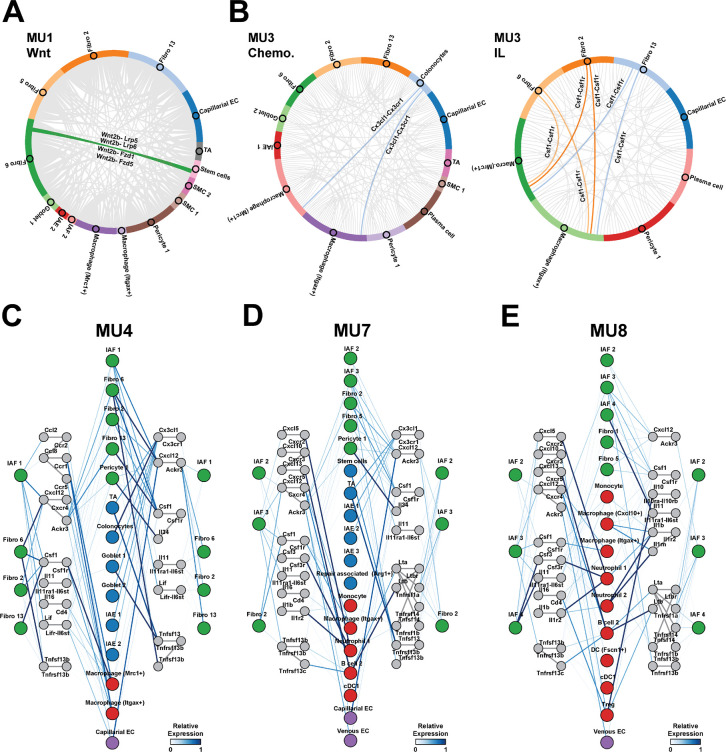
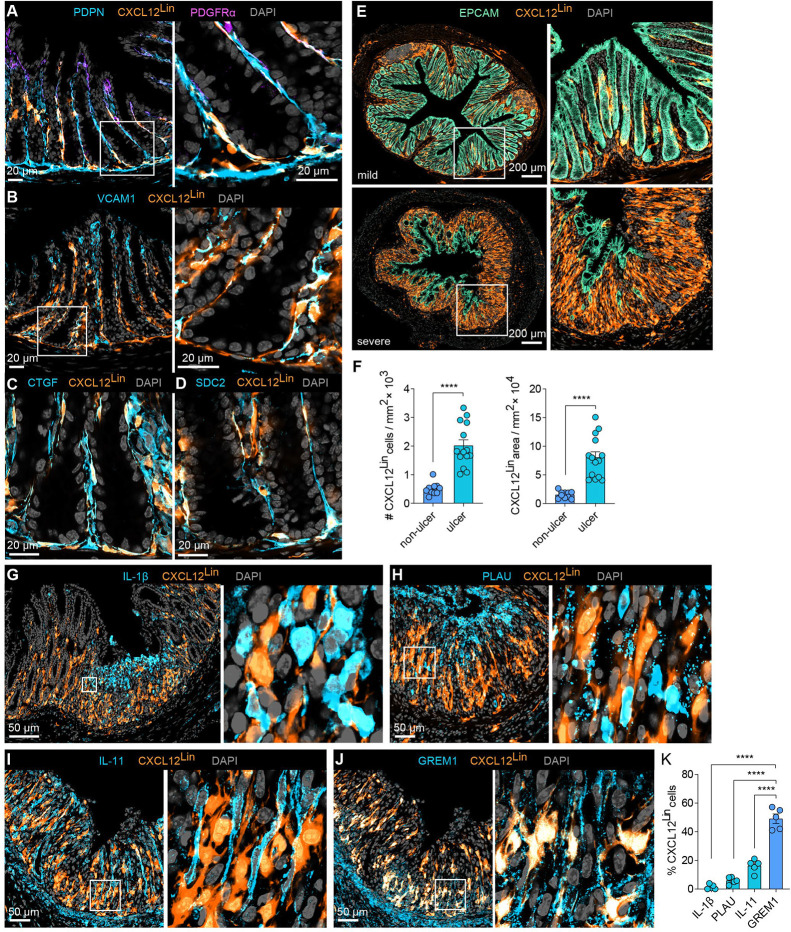
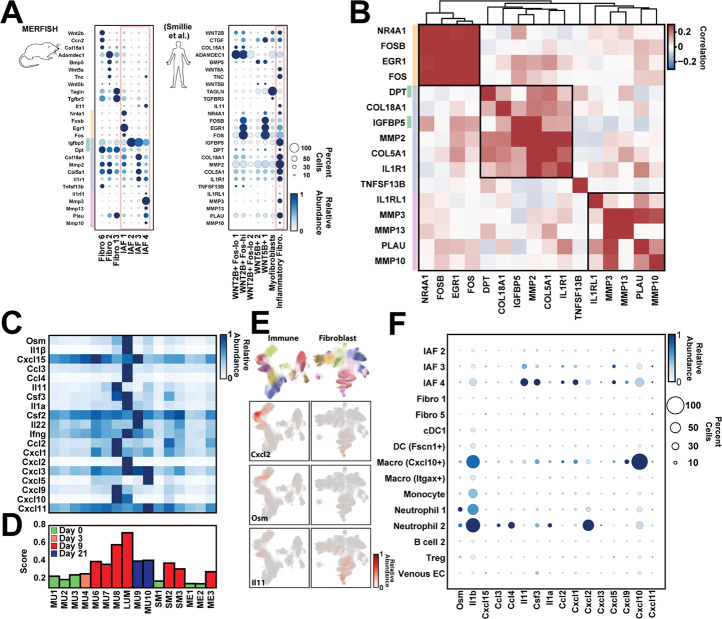
Gut inflammation involves contributions from immune and non-immune cells, whose interactions are shaped by the spatial organization of the healthy gut and its remodeling during inflammation. The crosstalk between fibroblasts and immune cells is an important axis in this process, but our understanding has been challenged by incomplete cell-type definition and biogeography. To address this challenge, we used MERFISH to profile the expression of 940 genes in 1.35 million cells imaged across the onset and recovery from a mouse colitis model. We identified diverse cell populations; charted their spatial organization; and revealed their polarization or recruitment in inflammation. We found a staged progression of inflammation-associated tissue neighborhoods defined, in part, by multiple inflammation-associated fibroblasts, with unique expression profiles, spatial localization, cell-cell interactions, and healthy fibroblast origins. Similar signatures in ulcerative colitis suggest conserved human processes. Broadly, we provide a framework for understanding inflammation-induced remodeling in the gut and other tissues.


Conflict of interest statement

Declaration of interests J.R.M is a co-founder of, stake-holder in, and advisor for Vizgen, Inc. J.R.M. is an inventor on patents associated with MERFISH applied for on his behalf by Harvard University and Boston Children’s Hospital. J.R.M.’s interests were reviewed and are managed by Boston Children’s Hospital in accordance with their conflict-of-interest policies. A.C.A. is a member of the SAB for Tizona Therapeutics, Trishula Therapeutics, Compass Therapeutics, Zumutor Biologics, ImmuneOncia, and Nekonal Sarl. A.C.A. is also a paid consultant for iTeos Therapeutics, Larkspur Biosciences, and Excepgen. A.C.A.’s interests were reviewed and managed by the Brigham and Women’s Hospital and Mass General Brigham in accordance with their conflict-of-interest policies. Additional authors in this manuscript declare no competing financial interests.

Figures

Figure 1:
Figure 1:. Cellular remodeling in a mouse colitis model
(A) Time-course for the administration (red) or withdrawal (white) of dextran-sodium-sulfate (DSS) in the mouse colitis model. Arrows represent the time of tissue harvest. (B) The spatial distribution of 7 of 940 RNAs measured with MERFISH in a single slice of the mouse distal colon harvested at Day 0. Dots represent individual RNA molecules and color indicates their identity. Scale bar: 300 μm. (C) Uniform Manifold Approximation and Projection (UMAP) of 1.35 million cells measured via MERFISH for mice at all harvest days. Major cell classes are indicated via color. Smooth muscle cells (SMC). Interstitial cells of Cajal (ICC). (D) The spatial distribution of major cell classes in the mouse colon slice shown in (B). Patches represent the cellular boundaries, and color indicates cell class as in (C). Scale bar: 300 μm. (E) UMAP representation of all epithelial cells with individual epithelial populations colored and labeled. (F) The expression of key genes in all identified epithelial populations. Color indicates the average expression of the listed gene and circle diameter represents the fraction of cells that express at least one copy of that RNA. Expression is normalized by the maximum value observed for each gene across all listed cell populations. (G) The average abundance of each cell population per slice across the different harvest days, normalized to the maximum abundance. (H) The spatial distribution of cells within representative portions of representative slices from Day 0 (left) and Day 9 (right). The centroid of individual cells is plotted with epithelial cells colored by their identity as in (E) and all other cells in gray. Scale bars: 200 μm (I)-(L) As in (E)-(H) but for all immune populations. (M)-(P) As in (E)-(H) but for all fibroblast populations.
Figure 2:
Figure 2:. Cellular neighborhoods define the spatial remodeling of the colon during DSS-treatment
(A) The spatial distribution of all cell types in representative slices from Day 0 and Day 9. Dots represent cell centroid, and color indicates cell identity. Scale bars: 200 μm. (B) UMAP representation of the cellular neighborhoods that arise in all slices across all disease stages. Markers represent individual cells colored by the statistically distinct neighborhoods to which they were assigned. MU: mucosal; LUM: luminal; SM: submucosal; ME: muscularis externa; FOL: follicle; MES: mesentery. (C) UMAP representation of cellular neighborhoods in which each cell is colored by the fraction of its neighbors that are the listed cell class (left) or cell cluster (right). (D) The spatial distributions of cell types in the same slices in (A) colored by the tissue neighborhood to which they were assigned as in (B). (E) The fraction of each cell population found within each cellular neighborhood, normalized to the maximum value. (F) The average fraction of cells per slice assigned to each neighborhood for each disease stage, normalized by the maximum fraction observed at any day. (G) The spatial distribution of cells within a representative slice taken from Day 0 with all cells colored gray and cells assigned to each of the healthy mucosal neighborhoods, MU1, MU2, and MU3, colored as designated. (H) UMAP representation of all epithelial, immune, and fibroblast cells. Cells are colored by the neighborhood to which they have been assigned using the same colors as in (G) with all other cells not in MU1, MU2, and MU3 colored gray. (I) The fraction of cells in mucosal (top) or non-mucosal (bottom) neighborhoods measured within individual slices, grouped by the mouse of origin and the disease stage. Circles at Day 9 and Day 21 represent Day 9 measurements of the weight loss relative to Day 0 (red) or the colon length (yellow). (J) The spatial organization of all neighborhoods in representative slices taken from mice at each disease stage. Markers represent cell centroids and are colored based on neighborhood assignment. Scale bars: 200 μm.
Figure 3:
Figure 3:. Cellular neighborhoods evolve in a staged progression driven by polarization and recruitment of distinct cell populations
(A) The spatial distribution of mucosal neighborhoods in a representative healthy (Day 0) and early inflammation (Day 3) slice. Markers represent the cell centroids and color indicates neighborhood assignment. Pie charts represent neighborhood composition of cell classes (inner; fibroblast: green, epithelial: blue, immune: red, EC: purple, SMC: brown, ENS: yellow) or cell clusters (outer). Prominent populations are labeled. Scale bars: 200 μm. (B) The spatial distribution of cell populations that define MU4 in representative Day 0 or Day 3 slices. Inset: zoom-in on red boxed region. Scale bars: 200 μm. (C) The spatial distribution of RNAs marking populations that define MU4 in the slices in (B). The centroids of all RNAs are plotted in gray and the listed RNAs in red. Scale bars: 200 μm. (D) As in (A) but for mucosal neighborhoods that emerge at Day 9. Scale bar: 200 μm. (E) The spatial distribution of cell populations that define Day 9 neighborhoods plotted as in (B). Scale bars: 200 μm. (F) The spatial distribution of IAFs highlighting variation with the MU8 ulcer. (G) RNA spatial distributions for key markers of Day 9 neighborhood populations as in (C) for the slice in (D) with zoom in on the red boxed regions. Scale bar: 200 μm. (H) UMAP representation of fibroblasts (left) with IAF4 cells colored and a zoom in on the IAF4 region of this UMAP with individual cells colored by genes that define IAF4 and IAF4 subdivisions (right). (I) Zoom-in on the portion of the immune UMAP that shows Neutrophil 1 and Neutrophil 2 with cells colored by cell population (top) or pseudo time (bottom). (J) Zoom-in on immune UMAP highlighting gene expression within Neutrophil 1 and Neutrophil 2. (K) The normalized expression of highlighted genes sorted by neutrophil pseudo time as in (I). (L) The spatial distribution of Neutrophil 1 and Neutrophil 2 colored by pseudo time for the slice in (D). Scale bar: 200 μm. (M) As in (A) but for non-mucosal neighborhoods in Day 0 and Day 9. Scale bars: 200 μm. (N) As in (B) but for cell populations that define Day 0 and Day 9 non-mucosal neighborhoods with black and red boxed zoom-in (bottom). Scale bars: 200 μm. (O) As in (C) but for RNAs that mark cell populations in highlighted in (N).
Figure 4:
Figure 4:. Cellular neighborhoods define the organization of repairing tissue
(A) The spatial distribution of mucosal neighborhoods in a representative repairing slice (Day 21). Markers represent the cell centroids and color indicates neighborhood assignment. Pie charts represent neighborhood composition of cell classes (inner) or cell clusters (outer). Prominent populations are labeled. Scale bar: 200 μm. (B) The spatial distribution of cell populations that define neighborhoods observed at Day 21. Scale bars: 200 μm. (C) The spatial distribution of RNAs that highlight the structure of the MU10 repairing ulcer plotted for the black boxed region in (B). The centroids of all RNAs are plotted in gray and the listed RNAs in red.
Figure 5:
Figure 5:. Spatially prioritized receptor-ligand interactions suggest unique roles for IAFs in different cellular neighborhoods
(A) Circos plots showing the interaction frequency between cell populations in MU1 for all Wnt-family ligand-receptor interactions. Highlighted connections represent key known fibroblast-epithelial interactions. (B) As in (A) but for chemokines (left) and interleukins (right) for all cell populations in MU3. Highlighted connections represent key known fibroblast-immune interactions. (C-E) Putative interaction map describing signals to and from fibroblasts in inflammation-associated neighborhoods, MU4 (C), MU7 (D), and MU8 (E). Colored circles represent major cell populations in these neighborhoods with color indicating cell class (fibroblast: green, epithelial: blue, immune: red, EC: purple). Gray colored circles represent ligands or receptor complexes and lines connecting these circles represent documented interacting pairs. Lines connecting cell populations to ligands or receptors represent expression in those populations and colored by the average expression within that population normalized to the maximum observed in any population in any neighborhood.
Figure 6.
Figure 6.. Lineage tracing reveals distinct origins of IAF populations
(A) Representative immunofluorescence images of colon cross sections from Day 0 mice (n=5) highlighting the overlap of CXCL12Lin cells with the pan-fibroblast marker PDPN and low overlap with top-crypt PDGFRαhi cells. A zoom-in on boxed region is highlighted (right). Scale bar: 20 μm. (B-D) As in (A) but for markers of Fibro 6: VCAM1 (B), CTGF (C), and SDC2 (D). Scale bars: 20 μm. (E) Representative immunofluorescence images of colon cross sections from Day 9 mice sorted by mild or severe weight loss. Right panels show magnification of boxed areas (n=5–6). Scale bar: 200 μm. (F) CXCL12Lin cell number and area in tissue sections collected at Day 9 in ulcerated or non-ulcerated tissue regions (n=6–7). The bar represents the mean, the error bars represent standard error of the mean (SEM), and markers are individual mice. ****p<0.0001. (G-J) Representative immunofluorescence images of ulcerated regions, harvested on Day 9 showing overlap of CXCL12Lin with IL-1β, PLAU, IL-11, or GREM1. (K) The fraction of cells positive for CXCL12Lin that overlap with IL-11, GREM1, IL-1β and PLAU in ulcerated tissue regions as shown in (G-J). The bar represents mean, the error bars represent SEM, and markers are individual mice. ****p<0.0001.
Figure 7:
Figure 7:. Signatures of murine IAF populations and late-stage inflammatory neighborhoods in human ulcerative colitis
(A) Average gene expression of key fibroblast markers in mouse fibroblast populations (left) or of their human homologs in published populations observed in UC biopsies (right). The color of the circle represents the average expression normalized to the maximum observed across all populations while the size of the circle represents the fraction of cells with at least one RNA copy. The red box highlights the IAF seen in mouse or human. The yellow, green, blue, and red lines represent the top mouse markers for IAF1 (yellow), IAF2 (green), IAF3 (blue), and IAF4 (red). (B) Pairwise Pearson correlation coefficients for the expression of the listed genes within the published human IAF population sorted hierarchically (top tree) with boxes indicating the genes grouped by this analysis. Colored bars on the left indicate the IAF population in mouse that these human homologs would mark as in (A). (C) The average expression of the mouse homologs of a human anti-TNF treatment-resistant UC biomarker panel in each of the listed mouse neighborhoods. Expression is normalized to the maximum observed in any neighborhood. (D) The biomarker score for each mouse neighborhood, with neighborhoods colored based on the disease stage at which they are most prominent. The biomarker score is defined as the average of the normalized expression for the markers listed in (C) in each neighborhood. (E) The mouse immune (left) and fibroblast (right) UMAPs colored either by the major cell label (top) or by the expression of the listed genes (bottom rows). (F) The average expression of each of the mouse homologs of human UC treatment resistant biomarkers in each of the major cell populations observed in MU8 and LUM as in (A).

References

    1. Mowat A.M., and Agace W.W. (2014). Regional specialization within the intestinal immune system. Nat. Rev. Immunol. 14, 667–685. - PubMed
    1. Beumer J., and Clevers H. (2021). Cell fate specification and differentiation in the adult mammalian intestine. Nat. Rev. Mol. Cell Biol. 22, 39–53. - PubMed
    1. Nowarski R., Jackson R., and Flavell R.A. (2017). The stromal intervention: Regulation of immunity and inflammation at the epithelial-mesenchymal barrier. Cell 168, 362–375. - PubMed
    1. Abraham C., and Cho J.H. (2009). Inflammatory Bowel Disease. New England Journal of Medicine 361, 2066–2078. 10.1056/nejmra0804647. - DOI - PMC - PubMed
    1. Friedrich M., Pohin M., and Powrie F. (2019). Cytokine networks in the pathophysiology of inflammatory bowel disease. Immunity 50, 992–1006. - PubMed

Publication types