[Preprint]. 2023 Sep 28:2023.04.13.536694.
doi: 10.1101/2023.04.13.536694.

A revamped rat reference genome improves the discovery of genetic diversity in laboratory rats

Affiliations

A revamped rat reference genome improves the discovery of genetic diversity in laboratory rats

Tristan V de Jong et al. bioRxiv. .

Update in

  • A revamped rat reference genome improves the discovery of genetic diversity in laboratory rats.
    de Jong TV, Pan Y, Rastas P, Munro D, Tutaj M, Akil H, Benner C, Chen D, Chitre AS, Chow W, Colonna V, Dalgard CL, Demos WM, Doris PA, Garrison E, Geurts AM, Gunturkun HM, Guryev V, Hourlier T, Howe K, Huang J, Kalbfleisch T, Kim P, Li L, Mahaffey S, Martin FJ, Mohammadi P, Ozel AB, Polesskaya O, Pravenec M, Prins P, Sebat J, Smith JR, Solberg Woods LC, Tabakoff B, Tracey A, Uliano-Silva M, Villani F, Wang H, Sharp BM, Telese F, Jiang Z, Saba L, Wang X, Murphy TD, Palmer AA, Kwitek AE, Dwinell MR, Williams RW, Li JZ, Chen H. de Jong TV, et al. Cell Genom. 2024 Apr 10;4(4):100527. doi: 10.1016/j.xgen.2024.100527. Epub 2024 Mar 26. Cell Genom. 2024. PMID: 38537634 Free PMC article.

Abstract

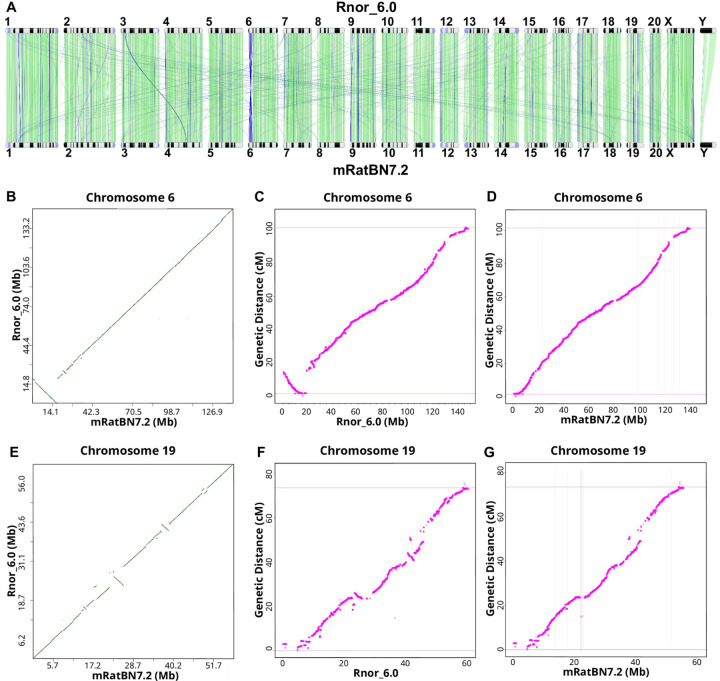
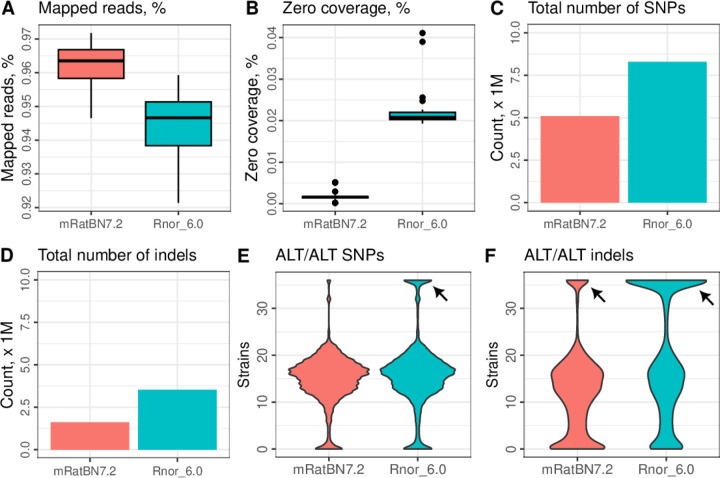
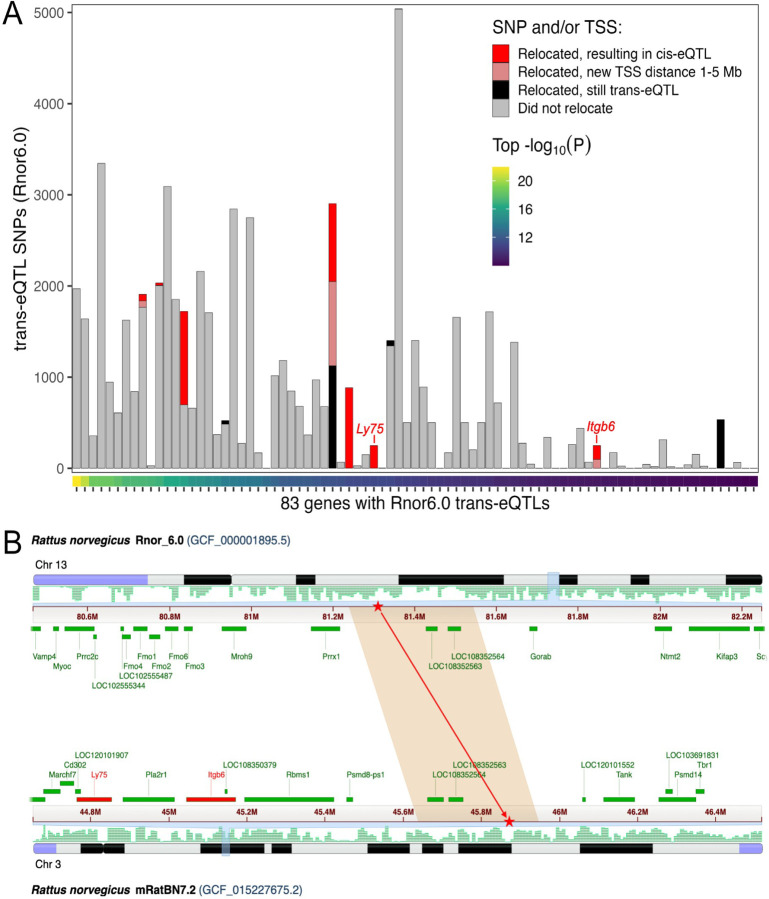
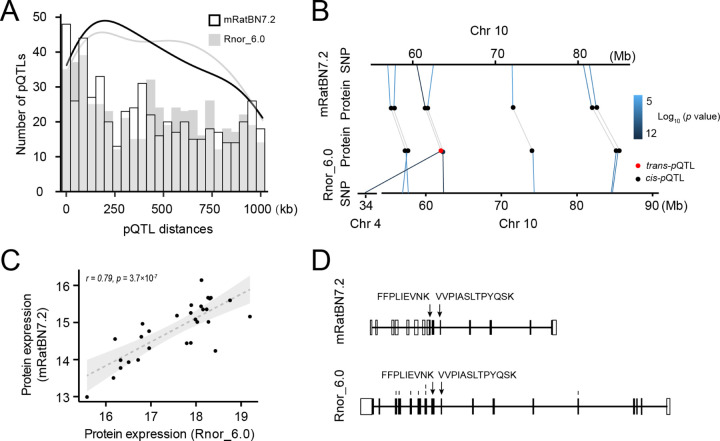
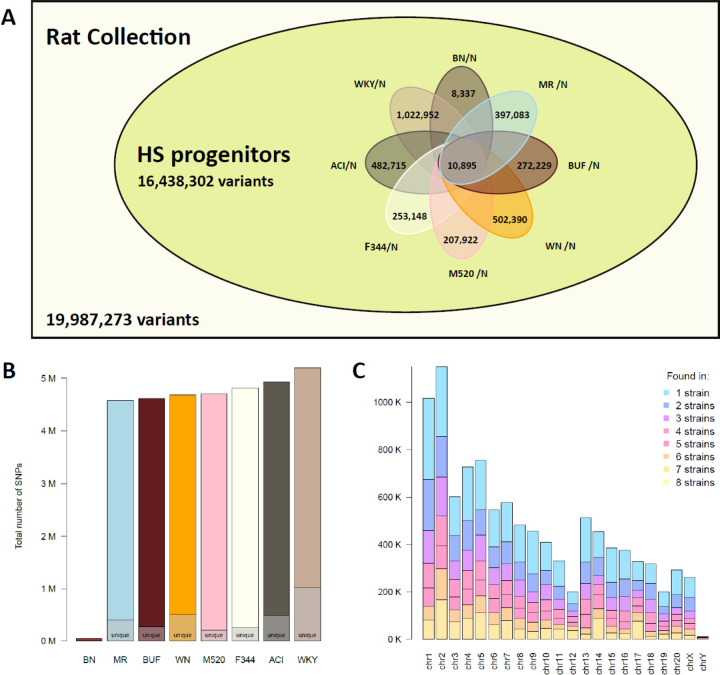
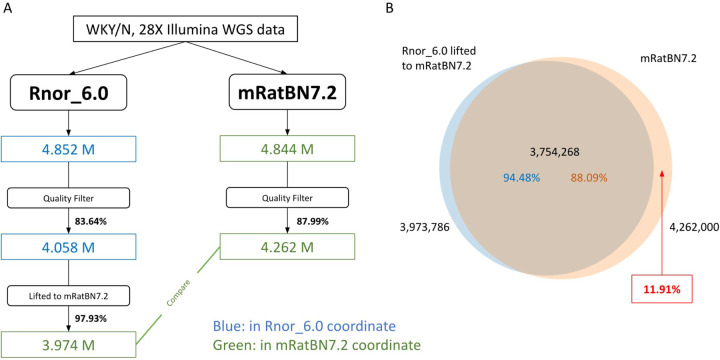
The seventh iteration of the reference genome assembly for Rattus norvegicus-mRatBN7.2-corrects numerous misplaced segments and reduces base-level errors by approximately 9-fold and increases contiguity by 290-fold compared to its predecessor. Gene annotations are now more complete, significantly improving the mapping precision of genomic, transcriptomic, and proteomics data sets. We jointly analyzed 163 short-read whole genome sequencing datasets representing 120 laboratory rat strains and substrains using mRatBN7.2. We defined ~20.0 million sequence variations, of which 18.7 thousand are predicted to potentially impact the function of 6,677 genes. We also generated a new rat genetic map from 1,893 heterogeneous stock rats and annotated transcription start sites and alternative polyadenylation sites. The mRatBN7.2 assembly, along with the extensive analysis of genomic variations among rat strains, enhances our understanding of the rat genome, providing researchers with an expanded resource for studies involving rats.

Keywords: Genetic Map; Heterogeneous Stock; Hybrid Rat Diversity Panel; Inbred Strains; Phylogenetic Tree; Rat; Recombinant Inbred; Reference Genome; Rnor_6.0; mRatBN7.2.


Conflict of interest statement

Declaration of interests The authors declare no competing interests.

Figures

Figure 1.
Figure 1.. mRatBN7.2 corrects structural errors in Rnor_6.0.
(A) Genome-wide comparison between Rnor_6.0 and mRatBN7.2 showed many structural differences between these two references, such as a large inversion at proximal Chr 6 and many translocations between chromosomes. Image generated using the NCBI Comparative Genome Viewer. Numbers indicate chromosomes. Green lines indicate sequences in the forward alignment. Blue lines indicate reverse alignment. (B) The large inversion on proximal Chr 6 is shown in a dot plot between Rnor_6.0 and mRatBN7.2. (C) A rat genetic map generated using 150,835 binned markers from 1,893 heterogeneous stock rats showed an inversion at proximal Chr 6 between genetic distance and and physical distance based on Rnor_6.0, indicating the inversion is caused by assembly errors in Rnor_6.0. (D) Marker order and genetic distance from the genetic map on Chr 6 are in agreement with physical distance based on mRatBN7.2, indicating the misassembly is fixed. (E-G) Genetic map confirms many assembly errors on Chr 19 in Rnor_6.0 are fixed in mRatBN7.2.
Figure 2.
Figure 2.. mRatBN7.2 improved mapping statistics of whole-genome sequencing data.
Summary statistics from mapping 36 HXB/BXH WGS samples against Rnor_6.0 and mRatBN7.2 were compared. Using mRatBN7.2 increased percentage of reads mapped (A), reduced percentage of regions on the reference genome with zero coverage (B), total number of SNPs (C) and indels (D). The presence of a large number of SNPs (E) and indels (F) that are shared by all samples (arrows), including BN/NHsdMcwi, indicating they are base-level errors in the reference genome.
Figure 3.
Figure 3.. mRatBN7.2 improves eQTL analysis.
Genome misassembly is associated with increased rates of calling spurious trans-eQTLs. We compared eQTL mapping using an existing RNA-seq data from nucleus accumbens core. (A) Each column represents a gene for which at least one trans-eQTL was found at P<1e-8 using Rnor_6.0. The color of bars indicate the number of trans-eQTL SNP-gene pairs in which the SNP and/or gene transcription start site (TSS) relocated to a different chromosome in mRatBN7.2, and whether the relocation would result in a reclassification to cis-eQTL (TSS distance <1 Mb) or ambiguous (TSS distance 1–5 Mb). (B) Genomic location of one relocated trans-eQTL SNP from (A). The SNP is in a segment of Chr 13 in Rnor_6.0 that was relocated to Chr 3 in mRatBN7.2 (red stars), reclassifying the e-QTL from trans-eQTL to cis-eQTL for both Ly75 and Itgb6 genes (red bars).
Figure 4.
Figure 4.. mRatBN7.2 improves the analysis of proteomic data.
We compared protein identification and pQTL mapping using a brain proteome data. (A) Histogram showing the distance between cis-pQTLs and transcription starting site (TSS) of the corresponding proteins. The distances of pQTLs in mRatBN7.2 tend to be closer than those in Rnor_6.0. (B) An example of trans-pQTL in Rnor_6.0 was detected as a cis-pQTL in mRatBN7.2. (C) Correlation of expression of the protein (the example in panel B) in Rnor_6.0 and mRatBN7.2. (D) Different annotations of the exemplar gene in Rnor_6.0 and mRatBN7.2.
Figure 5.
Figure 5.. SNPs and indels indicate remaining errors in mRatBN7.2.
Base-level errors are indicated by homozygous variants that are shared by the majority (i.e. more than 153 out of 163) of samples, including all seven BN/NHsdMcwi rats, one of them is part of the data used to assemble mRatBN7.2. Variants that are heterozygous for the majority of the samples are clustered in a few regions and have significantly higher read-depth. This suggests that they originated from collapsed repeats in mRatBN7.2.
Figure 6.
Figure 6.. Phylogenetic relationship of 120 strain/substrains of laboratory rats.
The phylogenetic tree was constructed using 11.6 million biallelic SNPs from 163 samples. Strains/substrains with duplicated samples were condensed. Strains highlighted with bold fonts are parental strains for RI panels. Green: HXB/BXH RI panel. Blue: FXLE/LEXF RI panel. Orange: progenitors of the HS outbred population.
Figure 7.
Figure 7.. Genetic diversity among progenitors of heterogeneous stock (HS) rats.
(A) The HS progenitors contain 16,438,302 variants (i.e., 82.2% of the variants in our collection of 120 strain/substrains) based on analysis using mRatBN7.2. Among these, 10,895 are shared by all eight progenitor strains. The number of variants that are unique to each specific founder is noted. (B) The total number of variants per strain, with the total number unique to each strain marked. (C) The number of variants shared across N strains, shown per chromosome.
Figure 8.
Figure 8.. Using WGS data to assess the quality of the LiftOver.
LiftOver is a tool often used to translate genomic coordinates between versions of reference genomes. We evaluated the effectiveness of LiftOver from Rnor_6.0 to mRatBN7.2. (A) Overview of the workflow using a real WGS sample from a WKY rat. A higher portion of variants passed the quality filter for mRatBN7.2. Among them, 97.93% of the variants were liftable from Rnor_6.0 to mRatBN7.2. (B) The overlap between variants lifted from Rnor_6.0 and variants obtained by direct mapping sequence data to mRatBN7.2. Approximately 11.9% of the variants that were found from direct mapping were missing from the LiftOver.

References

    1. Richter C.P. (1954). The effects of domestication and selection on the behavior of the Norway rat. J. Natl. Cancer Inst. 15, 727–738. - PubMed
    1. Hulme-Beaman A., Orton D., and Cucchi T. (2021). The origins of the domesticate brown rat (Rattus norvegicus) and its pathways to domestication. Anim Front 11, 78–86. - PMC - PubMed
    1. Modlinska K., and Pisula W. (2020). The Norway rat, from an obnoxious pest to a laboratory pet. Elife 9. 10.7554/eLife.50651. - DOI - PMC - PubMed
    1. Parker C.C., Chen H., Flagel S.B., Geurts A.M., Richards J.B., Robinson T.E., Solberg Woods L.C., and Palmer A.A. (2013). Rats are the smart choice: Rationale for a renewed focus on rats in behavioral genetics. Neuropharmacology 76 Pt B, 250–258. - PMC - PubMed
    1. Smith J.R., Hayman G.T., Wang S.-J., Laulederkind S.J.F., Hoffman M.J., Kaldunski M.L., Tutaj M., Thota J., Nalabolu H.S., Ellanki S.L.R., et al. (2020). The Year of the Rat: The Rat Genome Database at 20: a multi-species knowledgebase and analysis platform. Nucleic Acids Res. 48, D731–D742. - PMC - PubMed

Publication types