[Preprint]. 2023 May 8:2023.05.08.539795.
doi: 10.1101/2023.05.08.539795.

Crucial neuroprotective roles of the metabolite BH4 in dopaminergic neurons

Affiliations

Crucial neuroprotective roles of the metabolite BH4 in dopaminergic neurons

Shane J F Cronin et al. bioRxiv. .

Abstract

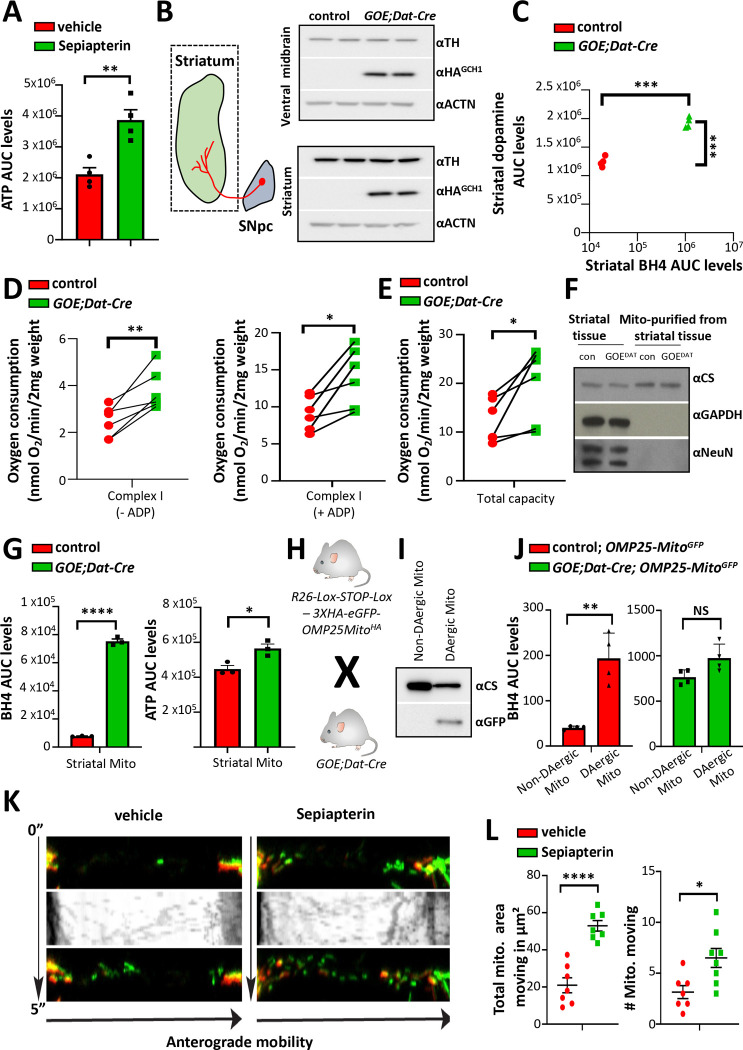
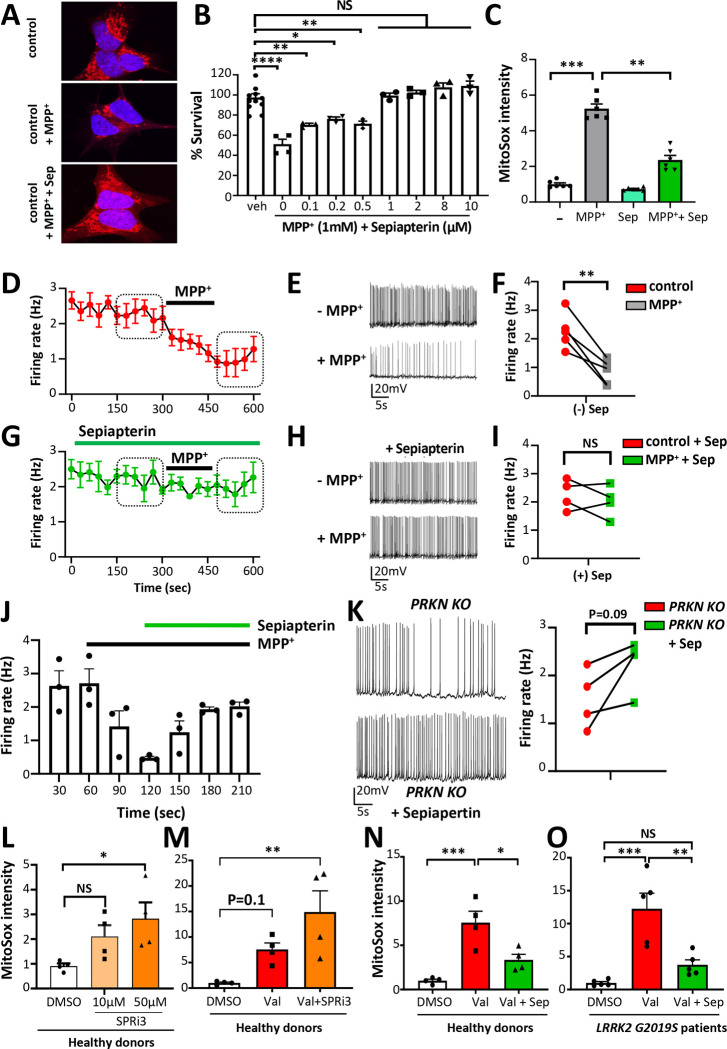
Dopa-responsive dystonia (DRD) and Parkinson's disease (PD) are movement disorders caused by the dysfunction of nigrostriatal dopaminergic neurons. Identifying druggable pathways and biomarkers for guiding therapies is crucial due to the debilitating nature of these disorders. Recent genetic studies have identified variants of GTP cyclohydrolase-1 (GCH1), the rate-limiting enzyme in tetrahydrobiopterin (BH4) synthesis, as causative for these movement disorders. Here, we show that genetic and pharmacological inhibition of BH4 synthesis in mice and human midbrain-like organoids accurately recapitulates motor, behavioral and biochemical characteristics of these human diseases, with severity of the phenotype correlating with extent of BH4 deficiency. We also show that BH4 deficiency increases sensitivities to several PD-related stressors in mice and PD human cells, resulting in worse behavioral and physiological outcomes. Conversely, genetic and pharmacological augmentation of BH4 protects mice from genetically- and chemically induced PD-related stressors. Importantly, increasing BH4 levels also protects primary cells from PD-affected individuals and human midbrain-like organoids (hMLOs) from these stressors. Mechanistically, BH4 not only serves as an essential cofactor for dopamine synthesis, but also independently regulates tyrosine hydroxylase levels, protects against ferroptosis, scavenges mitochondrial ROS, maintains neuronal excitability and promotes mitochondrial ATP production, thereby enhancing mitochondrial fitness and cellular respiration in multiple preclinical PD animal models, human dopaminergic midbrain-like organoids and primary cells from PD-affected individuals. Our findings pinpoint the BH4 pathway as a key metabolic program at the intersection of multiple protective mechanisms for the health and function of midbrain dopaminergic neurons, identifying it as a potential therapeutic target for PD.

Keywords: Dopamine; GCH1; LRRK2; PRKN; ROS; ferroptosis; mitochondria; sepiapterin.


Conflict of interest statement

Declaration of interest The authors declare no conflict of interest.

Figures

Figure 1
Figure 1. Gch1-expressing neurons represent a distinct midbrain DAergic population.
A, BH4, dopamine, and serotonin levels in the plasma of sporadic PD patients. Data are shown as mean ± s.e.m. Individual PD patients and healthy donors are shown. *P < 0.05; **P < 0.01; ***P < 0.001; (Student’s t-test). B, Synonymous and missense GCH1 mutations associated with Parkinson’s disease which have been reported since 2016 (see Table S2 for details). Exons are drawn to scale according to their relative lengths (bottom). Three-dimensional configuration of the GCH1 pentamer (top). Mutations are indicated on the grey GCH1 monomer (colors correspond to exons). C, Representative immunofluorescence of tyrosine hydroxylase (TH)-positive dopaminergic (DAergic) neurons in the substantia nigra pars compacta (SNpc) area in the midbrain of Gch1-GFP reporter mice and percentages of Gch1-GFP+ neurons of total TH+, DAT+ and DDC+ neurons in the SNpc of reporter mice. Data are shown as mean ± s.e.m. Individual mice for each cell type are shown. Scale bar, 100μm. D, Density preserving UMAP (densMAP) embedding plot of ventral midbrain single-cell RNA-seq dataset reflecting expression level of Gch1. The rectangular box indicates DAergic neurons of the periaqueductal gray (PAG) (MBDOP1) and VTA/SN (MBDOP2) regions according to the original annotation (Zeisel et al., 2018). Arrow indicates serotoninergic neuronal population. E, Intersectional UpSet plot depicting number of cells identified as DAergic neurons (co-expressing Th, Slc6a3 (Dat) and Slc18a2 (Vmat2)) from the ventral midbrain, which also do or do not express Gch1 as blue and orange columns respectively. F, Molecular processes enrichment analysis of those DAergic neurons identified in (E) which also express Gch1 compared to those which do not express Gch1 (see Table S4 for differential gene list).
Figure 2.
Figure 2.. Gch1 deficiency in DAergic neurons diminishes midbrain dopamine metabolism with accompanying progressive motor function defects and increased anxiety.
A, Schematic depicting breeding of conditional Gch1flox/flox to Dat-Cre line, carrying deletions in exons 2 and 3 (in grey boxes) of Gch1 in DAergic neurons. B, C, BH4 (B) and dopamine (C) levels in the brains of control and Gch1flox/flox;Dat-Cre mice. Data are shown as mean ± s.e.m. Individual mice for each genotype are shown. **P < 0.01; ***P < 0.001; ****P < 0.0001; NS, not significant (Student’s t-test; multiple t-test comparison). D, Representative video tracking snapshots of 2-week-old control and Gch1flox/flox;Dat-Cre mice in open field testing. E, Quantification of distance travelled by 3-week-old control and Gch1flox/flox;Dat-Cre mice in open field testing. Data are shown as mean ± s.e.m. Individual mice for each genotype are shown. ***P < 0.001 (Student’s t-test). F, Rotarod testing both at fixed speed (4 rotations per minute (rpm)) as well as at accelerated speed (4–40 rpm) on 3-week-old control and Gch1flox/flox;Dat-Cre mice. Data are shown as mean ± s.e.m. Individual mice for each genotype are shown. ****P < 0.0001 (Student’s t-test). G, Four-limb akinesia and turning tests of control and Gch1flox/flox;Dat-Cre mice before and 45 minutes after i.p. administration of L-Dopa (50mg/kg) and benserazide, (12.5mg/kg). Data are shown as mean ± s.e.m. Individual mice for each genotype are shown. ***P < 0.001; ****P < 0.0001; NS, not significant (2-Way ANOVA with Sidak’s multiple comparisons test). H, Schematic showing the breeding of Gch1flox/flox animals with tamoxifen-inducible ERT-Th-Cre line to allow genetic Gch1 ablation in TH+ cells in adult mice. I,J, Striatal BH4 (I) and dopamine (J) levels in control and Gch1flox/flox;ERT-Th-Cre mice at 28 weeks post-tamoxifen administration. Data are shown as mean ± s.e.m. Individual mice for each genotype are shown. *P < 0.05; **P < 0.01; ***P < 0.001; NS, not significant (Student’s t-test and multiple t-test). K, Open-field behavioral testing during 5-minute intervals of a 30-minute observational period in control (n=9) and Gch1flox/flox;ERT-Th-Cre (n=8) female mice at 28 weeks post-tamoxifen administration for quantifying distance travelled. Data are shown as mean ± s.e.m. **P < 0.01 (2-way ANOVA). L, Grip strength of all paws from control and Gch1flox/flox;ERT-Th-Cre male mice at 28 weeks post-tamoxifen administration. Data are shown as mean ± s.e.m. Individual mice for each genotype are shown. *P < 0.05 (Student’s t-test). M, Beam walk behavioral testing of control and Gch1flox/flox;ERT-Th-Cre male mice at 28 weeks post-tamoxifen administration. Distance traversed across beams of various diameters were recorded. Data are shown as mean ± s.e.m. Individual mice for each genotype are shown. *P < 0.05; NS, not significant (Student’s t-test). N, Accelerated (4–40km/hr) rotarod analysis of control and Gch1flox/flox;ERT-Th-Cre male mice at 28 weeks post-tamoxifen administration, before and after administration of L-Dopa (50mg/kg) plus benserazide, (12.5mg/kg). Data are shown as mean ± s.e.m. Individual mice for each genotype are shown. *P < 0.05, ***P<0.001 (2-way ANOVA with Tukey’s multiple comparison test). O,P, Light/Dark box behavioral analysis of control and Gch1flox/flox;ERT-Th-Cre male mice at 28 weeks post-tamoxifen administration for measuring interval distances (O), and proportion of time spent in the light compartment (P) Data are shown as mean ± s.e.m. *P < 0.05, ***P<0.001; NS, not significant (2-way ANOVA with Sidak’s multiple comparison test). Q,R, Y-maze behavioral test in which same arm returns (Q) and latency to initial movement (R) were noted. Data are shown as mean ± s.e.m. Individual mice for each genotype are shown. *P < 0.05 (Student’s t-test).
Figure 3.
Figure 3.. Inducible Gch1 deletion in dopaminergic neurons results in reduced TH levels.
A, Schematic showing the crossing of the Gch1-GFP reporter line with the Gch1 deficient line, Gch1flox/flox;Dat-Cre. B,C, Representative immunofluorescence of TH and GFP in the SNpc region (B) and quantification of staining intensities (C) in 3-week-old control; Gch1GFP and Gch1flox/flox;Dat-Cre; Gch1GFP mice. Scale bar, 10μm. Data are shown as mean ± s.e.m. Individual cell intensities pooled from n=3 mice for each genotype are shown. Dotted circle indicates Gch1-GFP expressing neurons which have low/absent TH expression in Gch1flox/flox;Dat-Cre; Gch1GFP mice. D,E, Representative TH+ immunohistochemistry in the striatum and SNpc regions (D) and quantification of TH-positive cells (E) in the SNpc of control and Gch1flox/flox;ERT-Th-Cre mice at 28 weeks post-tamoxifen administration. Data are shown as mean ± s.e.m. Individual mice for each genotype are shown. NS, not significant (Student’s t-test). F, Western blot analysis of TH and DAT in the striatum and ventral midbrain of control and Gch1flox/flox;ERT-Th-Cre mice at 28 weeks post-tamoxifen administration. N= 2/3 (control); 4/3 (Gch1flox/flox;ERT-Th-Cre) per genotype. Actin is used as a loading control (left) and normalized TH and DAT protein levels in each tissue is quantified (right). Data are shown as mean ± s.e.m. Individual mice for each genotype are shown. *P < 0.05; **P<0.01; NS, not significant (Multiple t-test). G, Schematic depicting the bilateral stereotactic injection of AAV5-Th-Cre into the SN of wild type and Gch1flox/flox mice. H, Striatal BH4 and dopamine levels from AAV5-Th-Cre injected control and Gch1flox/flox mice after 4 months. Data are shown as mean ± s.e.m. Individual mice for each genotype are shown. **P < 0.01; (Multiple t-test comparison). I, Rotarod (left) and four-limb akinesia (right) testing of control and Gch1flox/flox mice at 4 months after AAV5-Th-Cre injection. Data are shown as mean ± s.e.m. Individual mice for each genotype are shown. *P < 0.05, ***P<0.001 (Student’s t-test). J, Body weights of control and Gch1flox/flox mice at 4–5 months after AAV5-Th-Cre injection. Data are shown as mean ± s.e.m. Individual mice for each genotype are shown. ***P<0.001 (Student’s t-test). K, Representative TH+ immunohistochemistry in the SNpc region (top) and quantification of TH-positive cells (bottom) throughout the SNpc of control and Gch1flox/flox mice at 4 months after AAV5-Th-Cre injection. Data are shown as mean ± s.e.m. ****P<0.0001 (Two-way ANOVA). L, Western blot of TH, DAT, VMAT2 and DDC in striatal tissue from control and Gch1flox/flox mice at 4 months after AAV5-Th-Cre injection. N=2 per genotype/condition. Actin is used as a loading control. M, Comparison between various genetic BH4 deficiency models (Gch1flox/flox;Dat-Cre, Gch1flox/flox;ERT-Th-Cre, and Gch1flox/flox; AAV5-Th-Cre) and their respective controls in terms of DAergic neuronal identity markers at the mRNA, protein and metabolite levels. N, Representative 4-HNE/DAPI immunohistochemistry in the SNpc of control and two Gch1flox/flox mice 3 months after AAV5-Th-Cre injection. 4-HNE, 4-Hydroxynonenal. Scale bar, 25μm.
Figure 4.
Figure 4.. BH4 deficiency sensitizes mice to MPTP and alpha-synuclein PD stressors.
A, Schematic of BH4 synthesis in the de novo and salvage pathways. Metabolic enzymes are denoted in red. QM385 (in blue) is a specific inhibitor of sepiapterin reductase (SPR). SPR converts the intermediate metabolite sepiapterin (bold) to BH4 in the salvage pathway. PTPS, 6-Pyruvoyltetrahydropterin synthase; DHFR, Dihydrofolate reductase. B, BH4 levels in SH-SY5Y cells treated with vehicle (DMSO) or SPR inhibitor (QM385, 5μM) for 16 hours. Data are shown as mean ± s.e.m. Individual samples for each genotype are shown. **P < 0.01 (Student’s t-test). C, Percent change (to 0 mM MPP) in lactate dehydrogenase (LDH) release in SH-SY5Y cells obtained by varying doses of MPP+ after 24 hours pretreated with vehicle (DMSO) or QM385 (5μM, 5 days) (left) and area under the curve (AUC) analysis. Data are shown as mean ± s.e.m *P < 0.05; **P<0.01; (Student’s t-test). D, Schematic of a coronal section of the midbrain containing the SNpc from wild type mouse and an image of a patched recorded neuron. Scale bars, 10 μm. E, left, Representative traces of spontaneous pace-making action potentials (APs) from DAergic neurons in mouse SNpc under each condition (before drug treatment (shown as control), 5 μM QM385, 5 μM QM385 with 1 μM MPP+); right, Quantification of the frequency of spontaneous pace-making action potentials (APs) under each condition (before treatment (shown as control), 5 μM QM385, 5 μM QM385 with 1 μM MPP+,). Data are shown as mean ± s.e.m. Individual brain slice recordings are shown. *P < 0.05; NS, not significant (Paired-sample Wilcoxon signed-rank test). F, Schematic depicting sensitization regimen with systemic SPR inhibition (QM385, 5mg/kg i.p.) in vivo against low dose MPTP (1mg/kg, 4 times on a single day). G, Sepiapterin, dopamine and serotonin levels in the striatum of wild type mice administered with the indicated treatments. Data are shown as mean ± s.e.m. Individual mice for each genotype are shown. AUC, area under the curve (see methods for quantification of metabolites). *P < 0.05; **P<0.01; ***P<0.001; ****P<0.0001; NS, not significant (One-way ANOVA with Tukey’s multiple comparison test). H, Western blot (upper) and quantification (lower) of TH and DAT levels in the striatum of wild type mice administered with the indicated treatments. Data are shown as mean ± s.e.m. Individual mice for each genotype are shown. *P < 0.05; NS, not significant (One-way ANOVA with Dunnett’s multiple comparison test). V, vehicle; Q, QM385; M, MPTP. I, Schematic depicting the breeding strategy for incorporating the human alpha-synuclein (aSyn) overexpressing transgene into Gch1flox/flox;Dat-Cre and Gch1flox/flox;ERT-Th-Cre mice. J, Open field behavioral testing of 4-month-old control; aSyn and Gch1flox/flox;ERT-Th-Cre; aSyn mice assessing total distance travelled (left), and number of rearings (right) over a 30-minute observational period. Data are shown as mean ± s.e.m. Individual mice for each genotype are shown. *P < 0.05 (One-way ANOVA analysis with Tukey’s multiple comparison test). K,L, Accelerated rotarod (K) and beam walk behavioral testing (L) of 4-month old control; aSyn and Gch1flox/flox;ERT-Th-Cre;aSyn mice. Length travelled along beams of different diameters was measured. Tamoxifen was administered one month before testing to all experimental mice. Dotted horizontal line represents success of control and Gch1flox/flox;ERT-Th-Cre mice at each beam diameter at this age. Data are shown as mean ± s.e.m. Individual mice for each genotype are shown. *P < 0.05; **P < 0.01; NS, not significant (Student’s t-test and multiple t-test).
Figure 5.
Figure 5.. Increased BH4 ameliorates the effects of MPTP treatment as well as human alpha-synuclein overexpression in mice.
A, BH4 levels in SH-SY5Y cells treated with vehicle (DMSO) or sepiapterin (5μM) for 16 hours. Data are shown as mean ± s.e.m. Individual samples are shown. ****P < 0.0001 (Student’s t-test). AUC, area under the curve (see methods for quantification of metabolites). B,C, Representative traces of spontaneous pace-making action potentials (APs) from DAergic neurons in mouse SNpc under each condition (10 μM sepiapterin, 20 μM MPP+, 5 μM QM385) (B) and quantification of the frequency of spontaneous pace-making action potentials (APs) under each condition (C). Data are shown as mean ± s.e.m. Individual brain slice recordings are shown. ****P < 0.0001; NS, not significant (One-way ANOVA with Dunnett’s multiple comparison test). D,E, Schematic of breeding to induce Gch1 transgenic overexpression in DAT+ cells (D) and midbrain BH4 levels (E) in control and GOE;Dat-Cre mice. Data are shown as mean ± s.e.m. Individual mice for each genotype are shown. ****P < 0.0001 (Student’s t-test). F, Dopamine measurements in the striatum of control and GOE;Dat-Cre mice treated with vehicle or MPTP (10mg/kg). Data are shown as mean ± s.e.m. Individual mice for each genotype are shown. *P < 0.05; **P < 0.01; ****P < 0.0001; NS, not significant (One-way ANOVA with Tukey’s multiple comparisons. G, Grip strength of all paws from control and GOE;Dat-Cre mice, at 7 and 14 days after MPTP treatment. Data are shown as mean ± s.e.m. Individual mice for each genotype are shown. *P<0.05 (Multiple t test comparison). H, Beam walk behavioral testing of control and GOE;Dat-Cre mice at 14 days after MPTP treatment in which time taken to traverse was measured. I,J, Western blot (I) and quantification (J) of striatal tissue from control and GOE;Dat-Cre mice (untreated and at 14 days after MPTP treatment) and blotted with anti-TH. Actin was used as a loading control and for normalization. Data are shown as mean ± s.e.m. Individual mice for each genotype are shown. **P<0.01; ***P<0.001 (Two-way ANOVA with Tukey’s multiple comparison test). K, Representative staining of TH and quantification of TH+ cells in the SNpc of control and GOE;Dat-Cre mice at 14 days after MPTP treatment (10mg/kg). Data are shown as mean ± s.e.m. Individual mice for each genotype are shown. **P<0.01 (Student’s t test). Dashed lines indicate the average number of TH+ cells from naïve control and GOE;Dat-Cre mice (see Figure S11G).
Figure 6.
Figure 6.. Mitochondrial BH4 regulates mitochondrial respiration, energy output and movement.
A, ATP levels in SH-SY5Y cells treated with vehicle (DMSO) or sepiapterin (5μM) for 16 hours. Data are shown as means ± s.e.m. Individual samples for each genotype are shown. **P < 0.01 (Student’s t-test). AUC, area under the curve (see methods for quantification of metabolites). B, Schematic depicting the projections of DAergic neurons from the SNpc to the striatum (left). Dotted line indicates the extraction of the striatum, including projections from the SNpc DAergic neurons, but not the cell bodies. Western blot of TH and HAGCH1 in the ventral midbrain and striatal tissue isolated from control and GOE;Dat-Cre mice. Actin is used as a loading control. C, Dopamine and BH4 levels in the striatum of control and GOE;Dat-Cre mice. Data are shown as mean ± s.e.m. Individual samples for each genotype are shown. ***P < 0.001 (Student’s t-test). AUC, area under the curve (see methods for quantification of metabolites). D,E, Complex I mitochondrial activity (D) with (right panel) and without (left panel) ADP as well as total capacity of mitochondrial respiration (E) in striatal tissue from control and GOE;Dat-Cre mice. Data are shown as mean ± s.e.m. Individual mice for each condition are shown. *P < 0.05 (paired Student’s t-test). F, Western blot of the striatum as well as isolated mitochondria from the striatal tissue of control and GOE;Dat-Cre mice stained with a mitochondrial protein (citrate synthase (CS)), cytoplasmic protein (GAPDH) and a nuclear protein (NeuN). G, BH4 (left) and ATP (right) levels in the isolated mitochondria from striatal tissue of control and GOE;Dat-Cre mice. Data are shown as mean ± s.e.m. Individual mice for each genotype are shown. *P < 0.05; ****P < 0.0001 (Student’s t-test). AUC, area under the curve (see methods for quantification of metabolites). H, Schematic depicting the breeding of GOE;Dat-Cre with transgenic reporter mice (R26-Lox-STOP-Lox – 3XHA-eGFP-OMP25MitoHA; referred to as OMP25-MitoGFP) in which mitochondria are tagged with OMP25-GFP in DAergic neurons. I, Western blot of isolated mitochondria from the striatal tissue of control; OMP25-MitoGFP, which were then separated into those originating form DAergic neurons in the SNpc versus all other mitochondria form the striatum. Citrate synthase (CS) and GFP were blotted. J, BH4 levels in mitochondria isolated from striatal tissue and separated into those originating from SNpc DAergic neurons and all others, from control; OMP25-MitoGFP (left) and GOE;Dat-Cre; OMP25-MitoGFP (right) mice. Data are shown as mean ± s.e.m. Individual mice for each genotype are shown. ***P < 0.001 (Student’s t-test). AUC, under the curve (see methods for quantification of metabolites). K,L, Time lapse images indicating mEOS2-labelled mitochondrial movement from the cell body along the axon in primary DRG sensory neurons. Kymographs depict mitochondrial movement over 5 minutes after photoconversion so that only newly transported (green-positive) mitochondria were analysed both for movement (K). Quantitation of total mitochondrial area (left) and mitochondrial numbers (right) transported anterograde from soma to axons after 4 days of treatment with vehicle, and sepiapterin (5μM) (L). **P < 0.01; ***P < 0.001; NS, not significant (One-way ANOVA with Dunnett’s multiple comparison test).
Figure 7.
Figure 7.. BH4 protects a DAergic human cell line, human midbrain organoids and PD patient-derived fibroblasts from mitochondrial stress.
A, Representative confocal image of differentiated SH-SY5Y neuroblastoma cells treated with vehicle (control), MPP+ (1mM), and MPP+ plus sepiapterin (Sep, 2μM) stained with Mitotracker-Red to image mitochondrial morphology and networks after 24 hours of treatment. B, Survival quantification of differentiated SH-SY5Y neuroblastoma cells treated for 48 hours with DMSO vehicle (control), MPP+ (1mM), and MPP+ plus different doses of sepiapterin (as indicated in the figure). Data are shown as mean ± s.e.m. Individual samples for each condition are shown. *P < 0.05; **P < 0.01; ****P < 0.0001; NS, not significant (One-way ANOVA with Dunnett’s multiple comparison test). C, Normalised MitoSOX intensity measurements of SH-SY5Y cells untreated or treated for 16 hours with 1mM MPP+ with or without sepiapterin (5μM). Data are shown as mean ± s.e.m. Individual samples for each condition are shown. **P < 0.01; ***P < 0.001 (One-way ANOVA with Tukey’s multiple comparison test). D, Time course of the effect of MPP+ (20 μM) treatment on spontaneous AP firing frequencies in TH-GFP+ neurons within hMLOs (horizontal bar indicates the timing of MPP+ bath application). E, Representatives traces of spontaneous APs from TH-GFP+ neurons before (top panel) and after 3 minutes of MPP+ application (20 μM, bottom). F, Quantification of the effect of MPP+ treatment on the frequencies of spontaneous APs recorded from TH-GFP+ neurons. Data are shown as mean ± s.e.m. Individual recordings from hMLOs are shown. **P < 0.01 (paired Student’s t-test). G, Time course of the effect of MPP+ treatment in the presence of 10 μM sepiapterin on spontaneous AP firing frequencies recorded from TH-GFP+ neurons (horizontal bar indicates the timings of sepiapterin or MPP+ application). H, Representative traces of spontaneous APs from TH-GFP+ neurons before (top panel) and 3 minutes after bath application of MPP+ in the presence of sepiapterin (10 μM). I, Quantification of the effect of MPP+ on TH-GFP+ neurons in the presence of sepiapterin. Data are shown as mean ± s.e.m. Individual recordings from hMLOs are shown. NS, not significant (paired Student’s t-test). J, Firing rates of TH+ neurons in hMLOs treated with MPP+ and subsequently treated with sepiapterin as shown. Applications of MPP+ (black line) and sepiapterin (green line) are indicated. K, Representative traces of spontaneous APs recorded from DAergic neurons within hMLOs derived from isogenic Parkin2 knock-out (PARK2 KO) hESCs before (top) and after (bottom) treatment with sepiapterin (10 μM) and quantification of the effect of sepiapterin on DAergic neurons in PARK2 KO organoids. Data are shown as mean ± s.e.m. Individual recordings from hMLOs are shown. P-value is shown (paired Student’s t-test). Sep, sepiapterin. L-O, Regulation of mitochondrial superoxide levels by BH4 in healthy human fibroblasts as well as in PD patient fibroblasts carrying the LRRK2 p.G2019S mutation. MitoSOX fluorescent levels were measured after 24 hours in healthy human fibroblasts treated with the SPR inhibitor SPRi3 (L). MitoSOX levels were monitored in 24-hour valinomycin (10μM)-treated fibroblasts from healthy donors which were pre-treated with vehicle or SPRi3 (50μM) for 24 hours before valinomycin application (M). MitoSOX levels were monitored in 24-hour valinomycin (10μM)-treated healthy donor (N) and LRRK2 p.G2019S PD patient (O) fibroblasts, pre-treated with vehicle or sepiapterin (25μM) for 24 hours before valinomycin application. Data are shown as mean± s.e.m. Data are normalized to DMSO-treated controls. AUC, under the curve (see methods for quantification of metabolites); Sep, sepiapterin. Individual patients for each genotype are shown. *P < 0.05; **P < 0.01; ***P < 0.001; NS, not significant (One-way ANOVA with Tukey’s multiple comparisons). Sep, sepiapterin.

References

    1. Alberico S.L., Cassell M.D., and Narayanan N.S. (2015). The vulnerable ventral tegmental area in Parkinson’s disease. Basal Ganglia. - PMC - PubMed
    1. Amboni M., Cozzolino A., Longo K., Picillo M., and Barone P. (2008). Freezing of gait and executive functions in patients with Parkinson’s disease. Mov. Disord. - PubMed
    1. Badea T.C., Hua Z.L., Smallwood P.M., Williams J., Rotolo T., Ye X., and Nathans J. (2009). New mouse lines for the analysis of neuronal morphology using CreER(T)/loxP-directed sparse labeling. PLoS One 4. - PMC - PubMed
    1. Bailey J., Shaw A., Fischer R., Ryan B.J., Kessler B.M., McCullagh J., Wade-Martins R., Channon K.M., and Crabtree M.J. (2017). A novel role for endothelial tetrahydrobiopterin in mitochondrial redox balance. Free Radic. Biol. Med. 104, 214–225. - PMC - PubMed
    1. Bandres-Ciga S., Saez-Atienzar S., Kim J.J., Makarious M.B., Faghri F., Diez-Fairen M., Iwaki H., Leonard H., Botia J., Ryten M., et al. (2020). Large-scale pathway specific polygenic risk and transcriptomic community network analysis identifies novel functional pathways in Parkinson disease. Acta Neuropathol. 140. - PMC - PubMed

Publication types