[Preprint]. 2023 May 11:2023.05.10.23289788.
doi: 10.1101/2023.05.10.23289788.

Distinct genetic liability profiles define clinically relevant patient strata across common diseases

Affiliations

Distinct genetic liability profiles define clinically relevant patient strata across common diseases

Lucia Trastulla et al. medRxiv. .

Update in

  • Distinct genetic liability profiles define clinically relevant patient strata across common diseases.
    Trastulla L, Dolgalev G, Moser S, Jiménez-Barrón LT, Andlauer TFM, von Scheidt M; Schizophrenia Working Group of the Psychiatric Genomics Consortium; Budde M, Heilbronner U, Papiol S, Teumer A, Homuth G, Völzke H, Dörr M, Falkai P, Schulze TG, Gagneur J, Iorio F, Müller-Myhsok B, Schunkert H, Ziller MJ. Trastulla L, et al. Nat Commun. 2024 Jul 1;15(1):5534. doi: 10.1038/s41467-024-49338-2. Nat Commun. 2024. PMID: 38951512 Free PMC article.

Abstract

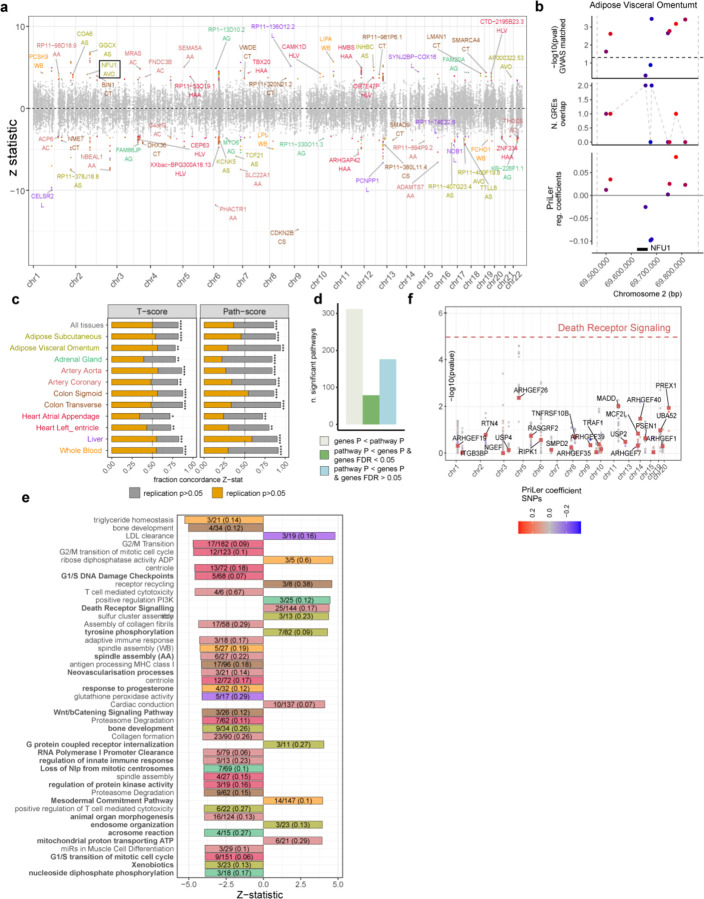
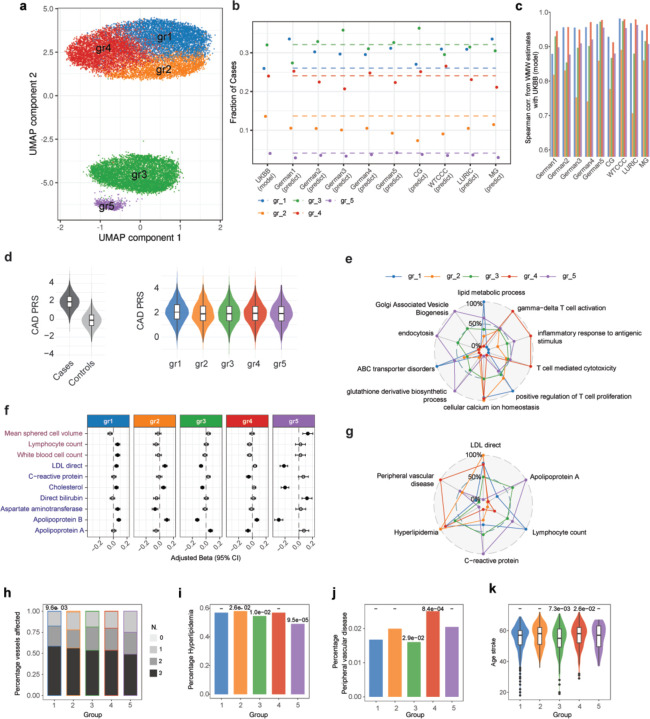
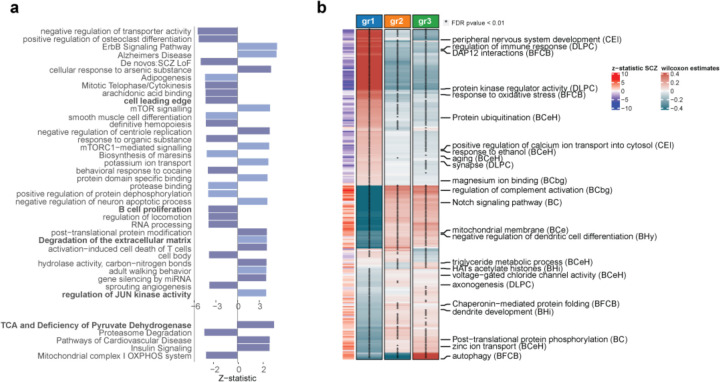
Genome-wide association studies have unearthed a wealth of genetic associations across many complex diseases. However, translating these associations into biological mechanisms contributing to disease etiology and heterogeneity has been challenging. Here, we hypothesize that the effects of disease-associated genetic variants converge onto distinct cell type specific molecular pathways within distinct subgroups of patients. In order to test this hypothesis, we develop the CASTom-iGEx pipeline to operationalize individual level genotype data to interpret personal polygenic risk and identify the genetic basis of clinical heterogeneity. The paradigmatic application of this approach to coronary artery disease and schizophrenia reveals a convergence of disease associated variant effects onto known and novel genes, pathways, and biological processes. The biological process specific genetic liabilities are not equally distributed across patients. Instead, they defined genetically distinct groups of patients, characterized by different profiles across pathways, endophenotypes, and disease severity. These results provide further evidence for a genetic contribution to clinical heterogeneity and point to the existence of partially distinct pathomechanisms across patient subgroups. Thus, the universally applicable approach presented here has the potential to constitute an important component of future personalized medicine concepts.


Conflict of interest statement

Competing interest: F.I. receives funding from Open Targets, a public-private initiative involving academia and industry, and performs consultancy for the joint AstraZeneca-CRUK functional genomics centre and for Mosaic Therapeutics. TFMA is a salaried employee of Boehringer Ingelheim Pharma outside the submitted work.

Figures

Fig. 1:
Fig. 1:. Genes and pathways associated with CAD.
a. Manhattan plot showing Z-statistic across 11 tissues, colored dots refers to genes with tissue specific FDR ≤ 0.05. Acronyms in parenthesis indicate the initials of the tissue considered (AS = Adipose Subcutaneous, AVO = Adipose Visceral Omentum, AG = Adrenal Gland, AA = Artery Aorta, AC = Artery Coronary, CS = Colon Sigmoid, CT = Colon Transverse, HAA = Heart Atrial Appendage, HLV = Heart Left Ventricle, L = Liver, WB = Whole Blood). b. PriLer model for NFU1 in adipose visceral omentum. Each dot represents a variant having PriLer regression coefficient different from zero ordered on the x-axis according to its corresponding genomic position and colored based on PriLer coefficients values. Panels from the bottom to the top indicate: 1) genomic position of NFU1 with dashed lines representing TSS +/− 200kb window, 2) regression coefficient from PriLer model, 3) number of gene regulatory elements in the PriLer model that a variant intersects, 4) −log10 p-value from matched GWAS in UKBB (Methods). c. Reproducibility of gene levels T-scores (left) and pathway scores (right) via meta-analysis of CARDIoGRAM cohorts. X-axis shows the fraction of significant genes in UKBB that have the same effect sign (Z-statistic) in CARDIoGRAM meta-analysis, p-values are computed from one-sided sign test (∗ = P ≤ 0.05, ∗∗ = P ≤ 0.01, ∗ ∗ ∗ = P ≤ 0.001, ∗ ∗ ∗∗ = P ≤ 0.0001). The fraction of genes concordant and nominal at a p-value threshold of 0.05 is shown in the yellow bar. d. Number of significant pathways (PALAS FDR ≤ 0.05) with at least one gene reaching better significance than the pathway (ivory), with all genes in the pathway less significant but with at least one gene having TWAS FDR ≤ 0.05 (green), and all genes less significant and not passing TWAS FDR 0.05 threshold (light blue). e. Reactome Death Receptor Signaling in artery aorta. The pathway significance is indicated by the dashed horizontal line, the coloured squares show genes included in that pathway and the corresponding TWAS p-value (y-axis) and the dots indicate the matched GWAS p-value of SNPs regulating those genes with colour reflecting PriLer regulatory coefficients. f. Among pathways more significant than any included gene, 45 prioritized pathways based on the following criteria: computed from more than 5 and less or equal than 200 t-score genes or more than 2 if pathway coverage is higher than 10%, originally including less than 200 genes and reaching at least 0.0001 as nominal significance. PALAS Z-statistic is shown in the x-axis color coded by tissue origin. Each pathway barplot contains the gene pathway coverage. The pathway name in bold reflects pathways without any significant gene (FDR > 0.05).
Fig. 2:
Fig. 2:. CAD patients genetically driven stratification from imputed gene expression in Liver.
a. First 2 components of uniform manifold approximation and projection (UMAP) from gene T-scores in liver for CAD patients. Genes are clumped at 0.9 correlation, separately standardized and PCs corrected, and multiplied by Z-statistic CAD associations. Each dot represents a patient colored by the cluster membership. b. Prediction of clustering structure on 9 external CARDIoGRAM cohorts. Y-axis shows the fraction of cases assigned to each cluster in UKBB dataset and each external cohort for which the clustering structure was projected. The dashed lines indicate the fraction value for UKBB model clustering. c. For each group, Spearman correlation of WMW estimates in UKBB and each external cohort only from genes that are significantly associated with that group across all tissues. d. Left: Distribution of CAD polygenic risk score (PRS) for all UKBB individuals based on CAD GWAS summary statistics from UKBB CAD GWAS. Right: Distribution of CAD PRS across CAD cases divided by clustering group. e. Mean value of selected group-specific pathways in each group rescaled to 0–100 range. f. Among 212 endophenotypes measured in UKBB with at least one CAD associated and group specific pathway, forest plot shows significantly different ones (FDR ≤ 0.05) in at least one group (gri versus remaining patient) using Generalized Linear Model (GLM), indicating regression coefficient (βGLM) with 95% Confidence Interval (CI). Full dot means that βGLM is significant (0.05 threshold) after BH correction performed separately for each group across all endophenotypes. The panel refers to continuous phenotypes, binary and ordinal categorical phenotypes are in Fig. S18. g. Mean value of selected group-specific endophenotypes in each group rescaled to 0–100 range. h. CAD severeness across projected clusters in GerMIFSV cohort. Y-axis indicates the percentage of patients with a certain number of vessel affected (grey shades). X-axis indicates the projected group. i-j. Percentage of patients in UKBB clustering with comorbidities ((i) hyperlipidemia, (j) peripheral vascular disease). k. Distribution of age of stroke for patients in UKBB. In (h-k) nominal p-values from group-wise GLM is shown at the top of the bar/violin plot. Boxplot elements include median as central line, 1st and 3rd quartiles as box limits, 1.5 interquartile ranges from 1st and 3rd quartiles as corresponding whiskers.
Fig. 3:
Fig. 3:. Impaired biological processes in SCZ.
a. PALAS Z-statistic results for a selection of pathways. Among pathways more significant than any included gene and without any gene in the MHC locus, the top panel shows a subset of the 45 prioritized pathways based on the following criteria: computed from more than 5 and less or equal than 200 t-score genes or more than 2 if pathway coverage is higher than 10%, originally including less than 200 genes and reaching at least 0.0001 as nominal significance. PALAS Z-statistic is shown in the x-axis color coded by tissue origin (dark blue = DLPC in CMC, light blue = a brain region in GTEx). The bottom panel shows a selection of significant SCZ pathways in WikiPathway collection. The pathway name in bold reflects pathways without any significant gene (FDR > 0.05). b. Wilcoxon-Mann-Whitney (WMW) estimates for 241 group-specific pathways (FDR ≤ 0.05, Reactome and GO) including at least one gene in the MHC locus and considering only the most significant tissue per-pathways when repeated. The clustering is performed on SCZ patients in DLPC imputed gene expression, The row annotation on the left indicates the corresponding SCZ PALAS Z-statistics. The acronym in parenthesis in the pathway names refers to the tissue considered (DLPC = Dorsolateral Prefrontal Cortex in CMC, CEI = Cells EBV-transformed lymphocytes, BFBC = Brain Frontal Cortex BA9, BCeH = Brain Cerebellar Hemisphere, BCbg = Brain Caudate basal ganglia, BC = Brain Cortex, BCe = Brain Cerebellum, BHi = Brain Hippocampus, BHy = Brain Hypothalamus).
Fig. 4:
Fig. 4:. SCZ patients genetically driven stratification from imputed gene expression in DLPC.
a. Mean value of selected group-specific pathways (Reactome and GO, WikiPathways and CMC Gene Set) in each group rescaled to 0–100 range. b. Forest plot of a selection of gene risk-scores (gene-RS) endophenotypes with FDR ≤ 0.05 and cluster reliable measure (CRM) > 500 in at least one group. X-axis shows the regression coefficient with 95% CI for the grouping variable (βGLM). Full dot indicates that βGLM is significant after BH correction, performed separately for each group across all the endophenotype. Black dot indicates that the group-specific association is also reliable based on CRM threshold of 610. The top panel shows results in terms of blood count and blood biochemistry UKBB phenotype classes. c. Group-specific spider plot related to Metabolic Syndrome phenotypes. Mean value of group-specific gene-RS endophenotype related to metabolic syndrome across all cohorts. Grey chart refers to all control combined in PGC cohorts. In each endophenotype, SCZ groups plus controls group are rescaled to 0–100 range. d. Forest plot testing measured clinical differences across projected groups in SCZ PsyCourse cohort. The test based on GLM is performed for each pair of groups (label on top). Dot indicates significance (p ≤ 0.05). tr. out/in – treatment outpatient/inpatient.

References

    1. McCarthy M. I. et al. Genome-wide association studies for complex traits: consensus, uncertainty and challenges. Nat Rev Genet 9, 356–369 (2008). https://doi.org:10.1038/nrg2344 - DOI - PubMed
    1. Gallagher M. D. & Chen-Plotkin A. S. The Post-GWAS Era: From Association to Function. Am J Hum Genet 102, 717–730 (2018). https://doi.org:10.1016/j.ajhg.2018.04.002 - DOI - PMC - PubMed
    1. Visscher P. M. et al. 10 Years of GWAS Discovery: Biology, Function, and Translation. Am J Hum Genet 101, 5–22 (2017). https://doi.org:10.1016/j.ajhg.2017.06.005 - DOI - PMC - PubMed
    1. Finucane H. K. et al. Partitioning heritability by functional annotation using genome-wide association summary statistics. Nat Genet 47, 1228–1235 (2015). https://doi.org:10.1038/ng.3404 - DOI - PMC - PubMed
    1. Bernstein B. E. et al. An integrated encyclopedia of DNA elements in the human genome. Nature 489, 57–74 (2012). https://doi.org:10.1038/nature11247 - DOI - PMC - PubMed

Publication types