

This is a preprint.
Application of Machine Learning to the Prediction of Cancer-Associated Venous Thromboembolism
- PMID: 37214902
- PMCID: PMC10197737
- DOI: 10.21203/rs.3.rs-2870367/v1
Application of Machine Learning to the Prediction of Cancer-Associated Venous Thromboembolism
Abstract
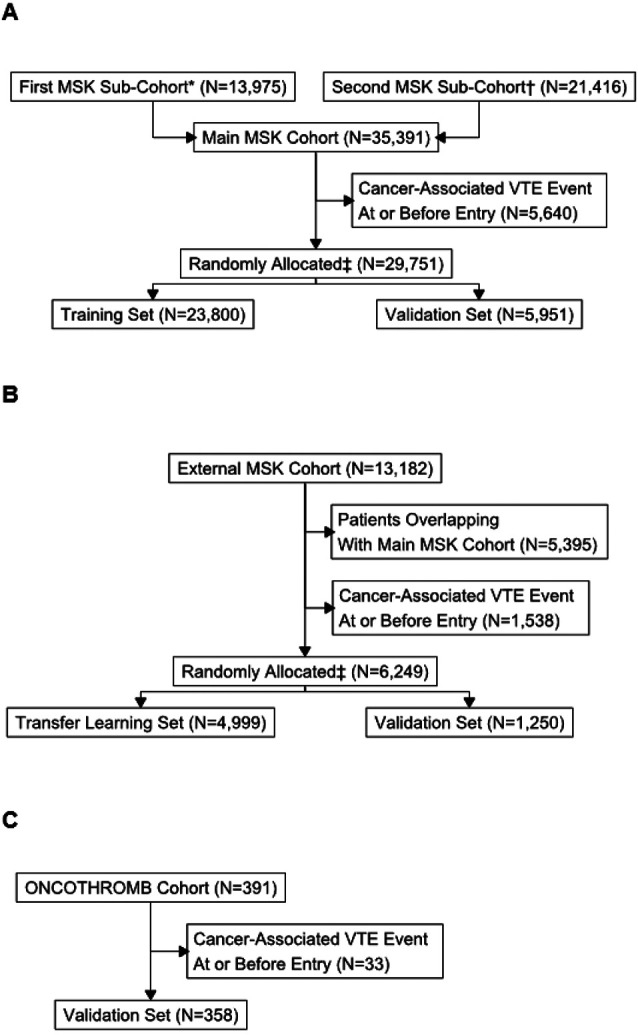
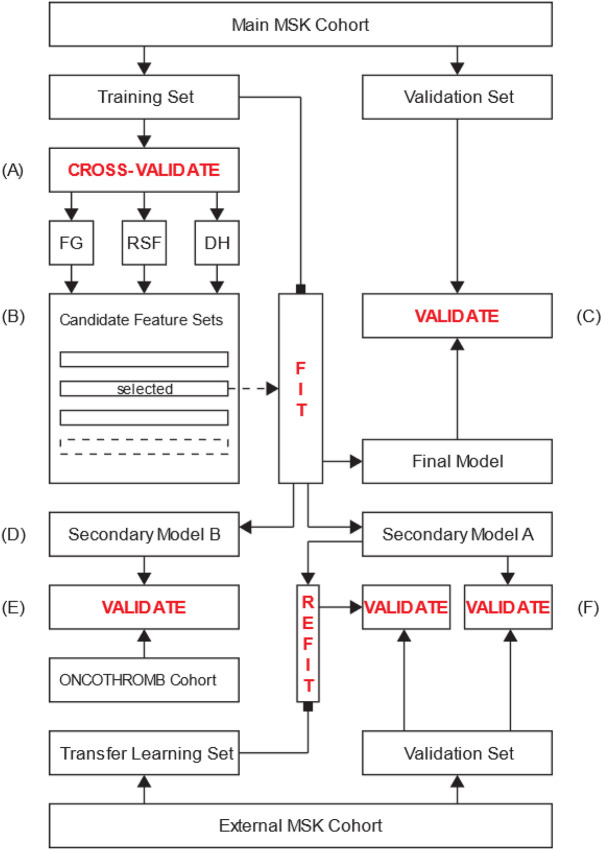
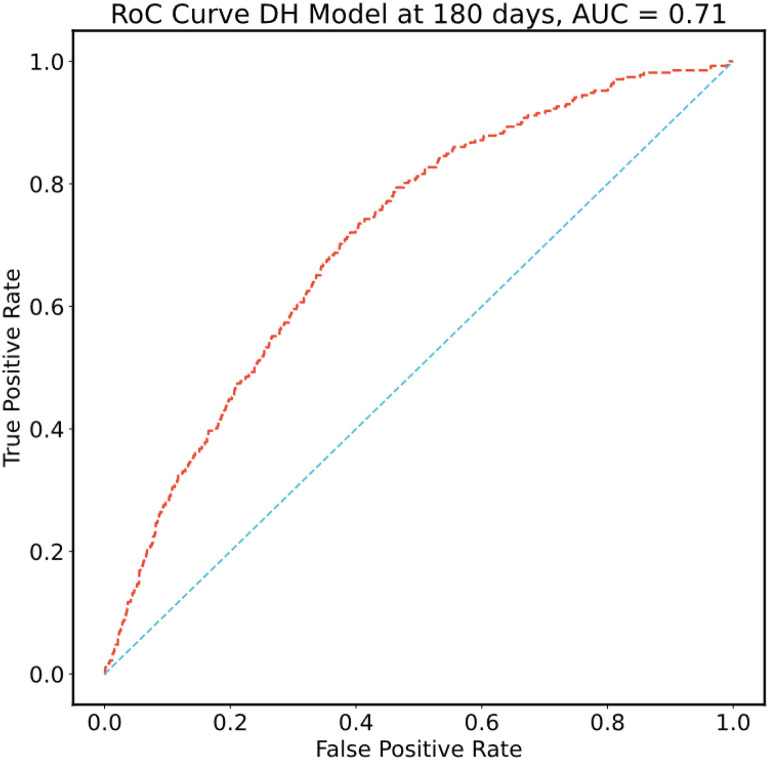
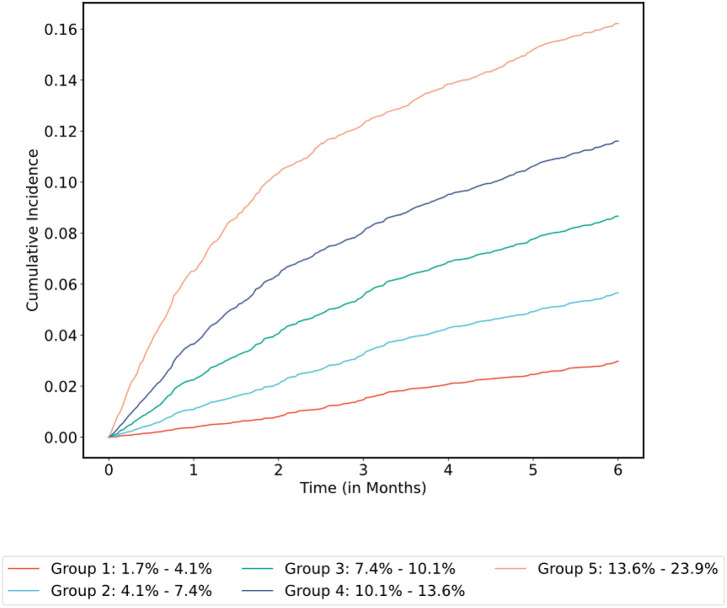
Venous thromboembolism (VTE) is a common and impactful complication of cancer. Several clinical prediction rules have been devised to estimate the risk of a thrombotic event in this patient population, however they are associated with limitations. We aimed to develop a predictive model of cancer-associated VTE using machine learning as a means to better integrate all available data, improve prediction accuracy and allow applicability regardless of timing for systemic therapy administration. A retrospective cohort was used to fit and validate the models, consisting of adult patients who had next generation sequencing performed on their solid tumor for the years 2014 to 2019. A deep learning survival model limited to demographic, cancer-specific, laboratory and pharmacological predictors was selected based on results from training data for 23,800 individuals and was evaluated on an internal validation set including 5,951 individuals, yielding a time-dependent concordance index of 0.72 (95% CI = 0.70-0.74) for the first 6 months of observation. Adapted models also performed well overall compared to the Khorana Score (KS) in two external cohorts of individuals starting systemic therapy; in an external validation set of 1,250 patients, the C-index was 0.71 (95% CI = 0.65-0.77) for the deep learning model vs 0.66 (95% CI = 0.59-0.72) for the KS and in a smaller external cohort of 358 patients the C-index was 0.59 (95% CI = 0.50-0.69) for the deep learning model vs 0.56 (95% CI = 0.48-0.64) for the KS. The proportions of patients accurately reclassified by the deep learning model were 25% and 26% respectively. In this large cohort of patients with a broad range of solid malignancies and at different phases of systemic therapy, the use of deep learning resulted in improved accuracy for VTE incidence predictions. Additional studies are needed to further assess the validity of this model.
Conflict of interest statement
Conflict of Interest Disclosures Simon Mantha, Subrata Chatterjee, Rohan Singh and John Cadley have filed a U.S. patent application related to this work. Simon Mantha is principal owner for Daboia Consulting LLC. Andrés Muñoz Martín has the following disclosures to report: consultant or advisory role for Pfizer-BMS, Sanofi, Celgene, Leo Pharma, Incyte, Astra-Zeneca, MSD, Lilly, Servier, Bayer and Roche; research funding from Leo Pharma, Sanofi and Celgene; paid speaker for Rovi, Bayer, Menarini, Stada and Daichii Sankyo; intellectual property rights for a risk assessment model of venous thromboembolism in cancer patients (work distinct from what is reported herein). Magdalena Ruiz is a medical advisor at IQVIA (CRO company). Gerald A. Soff has received research support or consulted for Johnson and Johnson/Janssen Scientific Affairs, Sobi/Dova Pharmaceuticals, Anthos Therapeutics, Luzsana (HengruiUSA), and Sanofi. The other authors have no potential conflicts of interest to report.
Figures
References
-
- Timp J.F., Braekkan S.K., Versteeg H.H. & Cannegieter S.C. Epidemiology of cancer-associated venous thrombosis. Blood 122, 1712–1723 (2013). - PubMed
-
- Falanga A., Schieppati F. & Russo L. Pathophysiology 1. Mechanisms of Thrombosis in Cancer Patients. Cancer Treat Res 179, 11–36 (2019). - PubMed
-
- Khorana A.A., Francis C.W., Culakova E., Kuderer N.M. & Lyman G.H. Thromboembolism is a leading cause of death in cancer patients receiving outpatient chemotherapy. J Thromb Haemost 5, 632–634 (2007). - PubMed
-
- Khorana A.A., et al. Rivaroxaban for Thromboprophylaxis in High-Risk Ambulatory Patients with Cancer. N Engl J Med 380, 720–728 (2019). - PubMed
Publication types
LinkOut - more resources
Full Text Sources
