[Preprint]. 2023 Oct 17:2023.05.11.540287.
doi: 10.1101/2023.05.11.540287.

Bile acid fitness determinants of a Bacteroides fragilis isolate from a human pouchitis patient

Affiliations

Bile acid fitness determinants of a Bacteroides fragilis isolate from a human pouchitis patient

Aretha Fiebig et al. bioRxiv. .

Update in

Abstract

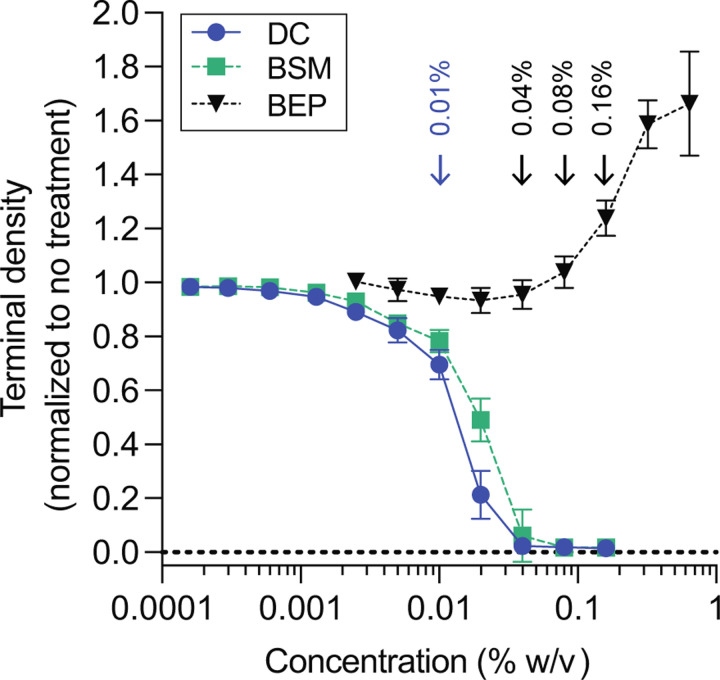
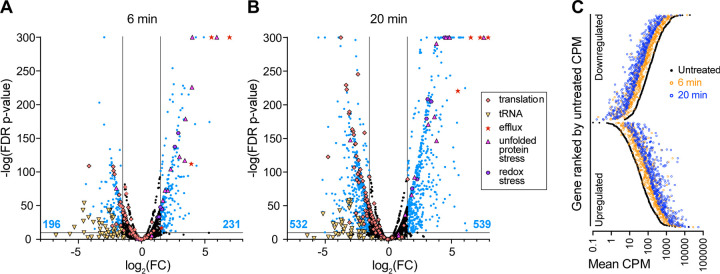
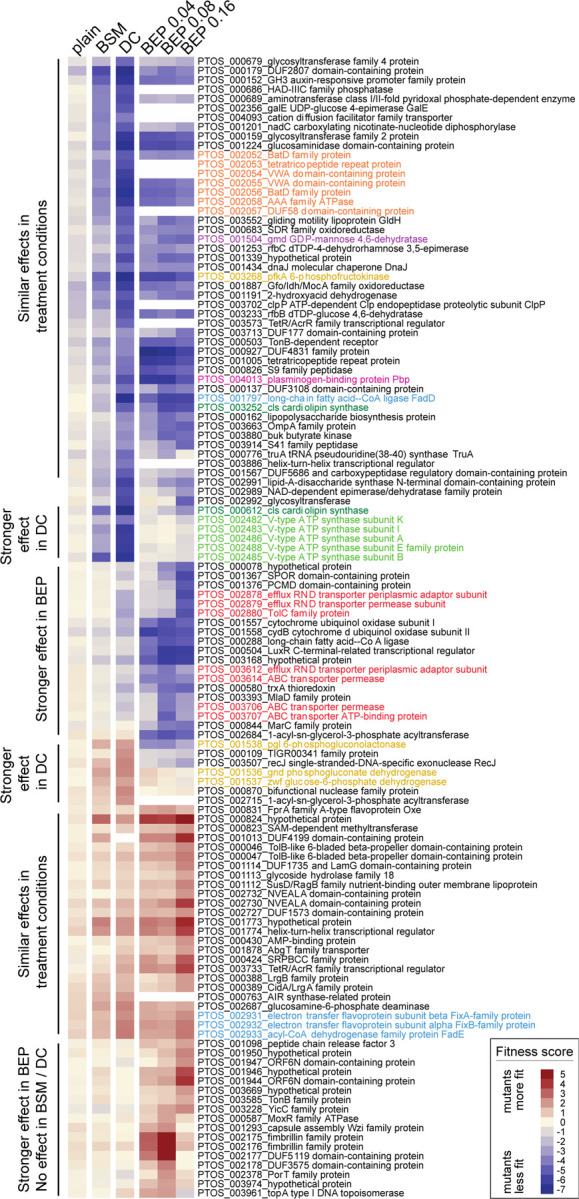
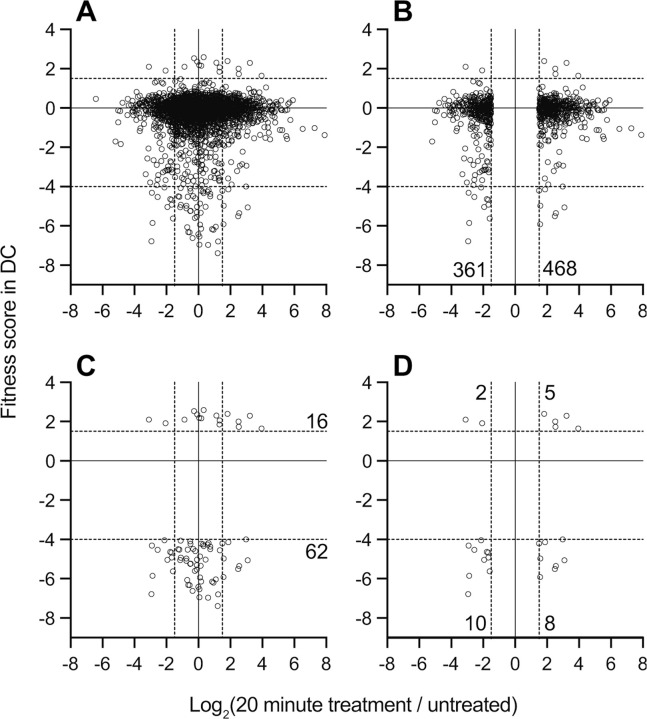
Bacteroides fragilis comprises 1-5% of the gut microbiota in healthy humans but can expand to >50% of the population in ulcerative colitis (UC) patients experiencing inflammation. The mechanisms underlying such microbial blooms are poorly understood, but the gut of UC patients has physicochemical features that differ from healthy patients and likely impact microbial physiology. For example, levels of the secondary bile acid deoxycholate (DC) are highly reduced in the ileoanal J-pouch of UC colectomy patients. We isolated a B. fragilis strain from a UC patient with pouch inflammation (i.e. pouchitis) and developed it as a genetic model system to identify genes and pathways that are regulated by DC and that impact B. fragilis fitness in DC and crude bile. Treatment of B. fragilis with a physiologically relevant concentration of DC reduced cell growth and remodeled transcription of one-quarter of the genome. DC strongly induced expression of chaperones and select transcriptional regulators and efflux systems and downregulated protein synthesis genes. Using a barcoded collection of ≈50,000 unique insertional mutants, we further defined B. fragilis genes that contribute to fitness in media containing DC or crude bile. Genes impacting cell envelope functions including cardiolipin synthesis, cell surface glycosylation, and systems implicated in sodium-dependent bioenergetics were major bile acid fitness factors. As expected, there was limited overlap between transcriptionally regulated genes and genes that impacted fitness in bile when disrupted. Our study provides a genome-scale view of a B. fragilis bile response and genetic determinants of its fitness in DC and crude bile.


Figures

Figure 1:
Figure 1:. B. fragilis P207 growth in the presence of increasing concentrations deoxycholate (DC), bile salt mixture (BSM) or bile extract of porcine (BEP).
Data reflect the terminal density (OD600) of 3 ml cultures after 24 hours growth for DC and BSM or 48 hours for BEP; mean ± SD of 8 independent trials each normalized to an untreated control. Representative growth curves for each condition are presented in Figure S1. Blue arrow highlights the concentration of DC and BSM used for subsequent experiments. Black arrows highlight the concentrations of BEP used for subsequent experiments.
Figure 2:
Figure 2:. Treatment of B. fragilis P207 with a sub-lethal concentration of deoxycholate (DC) induces large-scale activation and repression of transcription.
Volcano plots of differentially transcribed genes at (A) 6 minutes and (B) 20 minutes post DC exposure. Lines indicate cutoff criteria (FDR p < 10−10 and absolute log2(fold change) >1.5, where fold change (FC) reflects the ratio of CPM after DC exposure / CPM before DC exposure). The number of up- or down-regulated transcripts (blue points) at each time point is indicated at the bottom of graph (blue text). Genes that do not meet the cutoff criteria are in black. Functional categories of genes are highlighted with special symbols include: a) translation processes (GO terms: 0003735, 0006414, 0006400, 0043022, 0000049; orange diamonds), b) transmembrane efflux processes (operon PTOS_003611-3614; red stars), c) unfolded protein stress (GO term: 0051082; pink triangles), d) redox stress (catalase, msrB, and dps; purple hexagons), e) tRNA (related to translation processes; yellow inverted triangles). A subset of transcriptional changes were confirmed with RT-qPCR (Figure S2). C. Differentially transcribed genes 6 minutes (orange circles) and 20 minutes (blue circles) after 0.01% (w/v) DC exposure are highly correlated. The 1071 genes that are significantly up- and downregulated by 20 minutes post DC treatment relative to untreated control (black circles) are ranked by transcript counts per million (CPM) of gene expression in the untreated condition.
Figure 3:
Figure 3:. Genes that contribute to B. fragilis fitness in the presence of purified bile acids and crude bile have diverse metabolic, stress response, and cell envelope functions.
Heat map of fitness scores for the 122 genes that are significant determinants of B. fragilis fitness in at least one treatment condition (see Materials and Methods for significance thresholds); treatment conditions are arranged in columns and genes in rows. Composite fitness scores for genetic mutants grown in plain BHIS medium without bile are labeled (plain). Mutant strain growth was measured in BHIS containing 0.01% (w/v) bile salt mixture (BSM), 0.01% (w/v) deoxycholate (DC), and 0.04%, 0.08%, and 0.16% bile extract of porcine (BEP). Gene-level fitness scores were hierarchically clustered; gene arrangement was manually adjusted to group genes presumed to be in operons. White blocks indicate genes with insufficient barcode counts in the reference condition of a particular experiment to calculate a fitness score. Colored gene names highlight select functional categories discussed in the text: red – efflux systems, light green – V-ATPase operon, dark green – cardiolipin synthase genes, light blue – lipid metabolism, mustard – central carbon metabolism, orange – Bat aerotolerance operon, fuchsia – plasminogen-binding protein (Pbp), and purple – gmd protein glycosylase.
Figure 4:
Figure 4:. Genes that are transcriptionally regulated by DC treatment are weakly correlated with genes that determine fitness in medium containing DC.
Log2(fold change) in transcript levels before and after 20 minutes of exposure to 0.01% DC (x-axis) versus gene-level fitness scores after cultivation in 0.01% DC (y-axis) for the 3270 genes with fitness scores. Each point is a gene, for (A) all genes with fitness scores, (B) transcriptionally regulated genes with fitness data, (C) genes that pass fitness criteria, or (D) transcriptionally regulated genes that also pass fitness criteria. The 25 genes in D are listed in Figure S5. Dotted lines indicate cutoff thresholds on each axis. Numbers on graph indicate the number of genes in each region of the graph that meet the selection criteria.
Figure 5:
Figure 5:. Fitness scores highlight metabolic branchpoints in central carbon and lipid metabolism.
A. Schematic of glucose metabolism pathways highlighting the branchpoint between glycolysis and the pentose phosphate pathway. B. Schematic of lipid metabolism highlighting the fate of long-chain fatty acids (LCFA). Blue and red arrows and enzyme circles highlight processes that promote or inhibit fitness in the presence of DC, respectively. Pathway names are bold, key enzymes are named in circles, metabolites are in plain text. C. Heat map of expression values and fitness scores for the genes highlighted in A and B. Transcript abundance is presented as reads per kilobase per million reads (RPKM) and regulation is indicated by the log2(fold change) compared to untreated cells (0 min). Color scales representing absolute expression, fold change in expression, and mutant fitness scores are presented below each type of data.
Figure 6:
Figure 6:. B. fragilis encodes two rotary ATP synthase / ATPase systems; the V-type system bears conserved residues for sodium ion translocation and is a critical fitness factor in deoxycholate.
A. Expression level and fitness scores for genes in the V-type and F-type ATP synthase / ATPase operons, presented as in Figure 5. White blocks indicate genes with insufficient barcode counts in the reference condition to calculate a fitness score. B. Operon structure of F-type and V-type ATPase systems. PTOS gene locus numbers are below gene outlines; annotated subunit names are in white. Genes are colored as follows: cytoplasmic ATP synthesis/hydrolysis subunits – blue; transmembrane, ion-translocating, rotary subunits – red; transmembrane stator subunits – orange; stalk subunits connecting the enzymatic complex to the membrane complex – green; and unknown function - grey. The V-type system has fewer connecting accessory subunits than the F-type system or other characterized bacterial V-type systems (95). C. Protein sequence alignment of the K subunits of B. fragilis (Bf) and the sodium ion translocating Enterococcus hirae (Eh) V-ATPases. Identical residues are bold. Residues experimentally determined to coordinate sodium ions in E. hirae (64) are highlighted in blue with asterisk.

Similar articles

References

    1. Kern L, Abdeen SK, Kolodziejczyk AA, Elinav E. 2021. Commensal inter-bacterial interactions shaping the microbiota. Current Opinion in Microbiology 63:158–171. doi: 10.1016/j.mib.2021.07.011. - DOI - PubMed
    1. Keeley TP, Mann GE. 2019. Defining Physiological Normoxia for Improved Translation of Cell Physiology to Animal Models and Humans. Physiological Reviews 99:161–234. doi: 10.1152/physrev.00041.2017. - DOI - PubMed
    1. Fallingborg J, Christensen LA, Ingeman-Nielsen M, Jacobsen BA, Abildgaard K, Rasmussen HH. 1989. pH-profile and regional transit times of the normal gut measured by a radiotelemetry device. Aliment Pharmacol Ther 3:605–13. doi: 10.1111/j.1365-2036.1989.tb00254.x. - DOI - PubMed
    1. Seekatz AM, Schnizlein MK, Koenigsknecht MJ, Baker JR, Hasler WL, Bleske BE, Young VB, Sun D. 2019. Spatial and Temporal Analysis of the Stomach and Small-Intestinal Microbiota in Fasted Healthy Humans. mSphere 4:e00126–19. doi: 10.1128/mSphere.00126-19. - DOI - PMC - PubMed
    1. Guzior DV, Quinn RA. 2021. Review: microbial transformations of human bile acids. Microbiome 9:140. doi: 10.1186/s40168-021-01101-1. - DOI - PMC - PubMed

Publication types