[Preprint]. 2023 May 16:2023.05.09.540063.
doi: 10.1101/2023.05.09.540063.

CpG island turnover events predict evolutionary changes in enhancer activity

Affiliations

CpG island turnover events predict evolutionary changes in enhancer activity

Acadia A Kocher et al. bioRxiv. .

Update in

Abstract

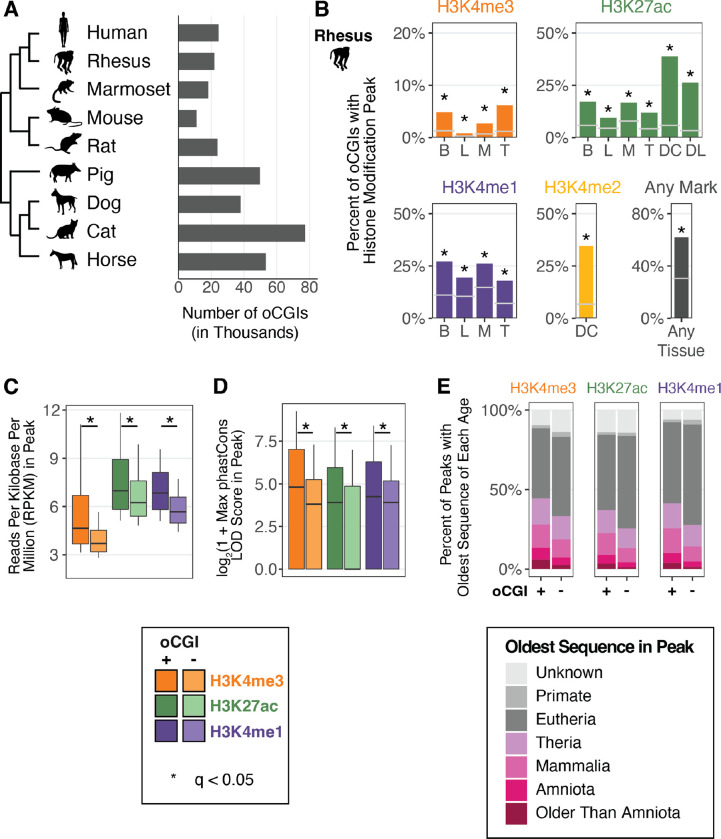
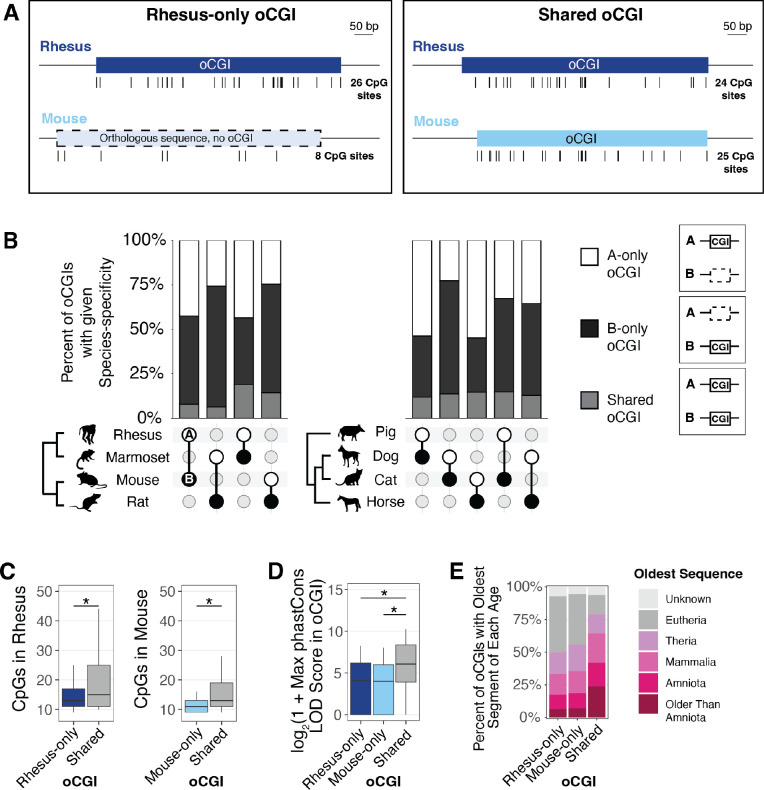
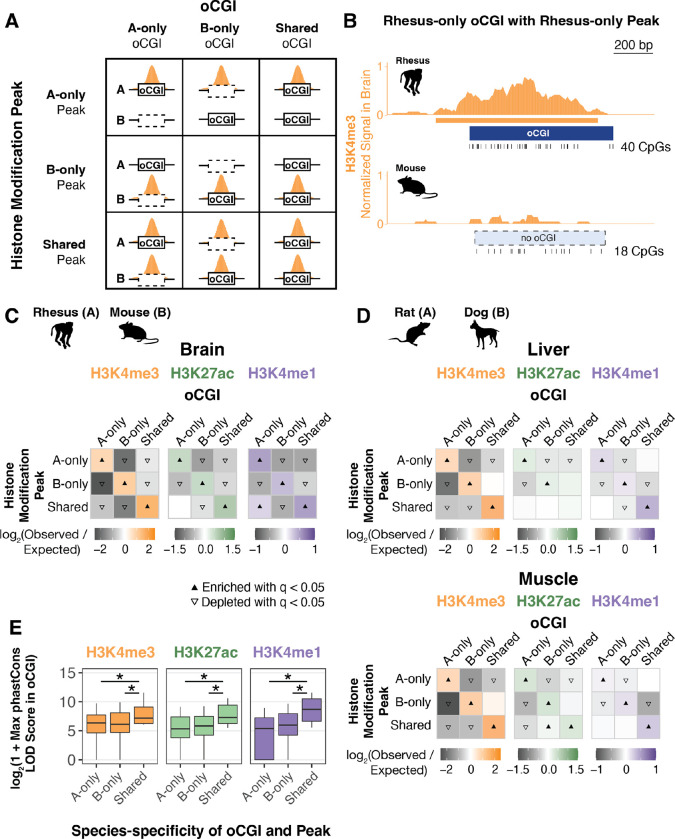
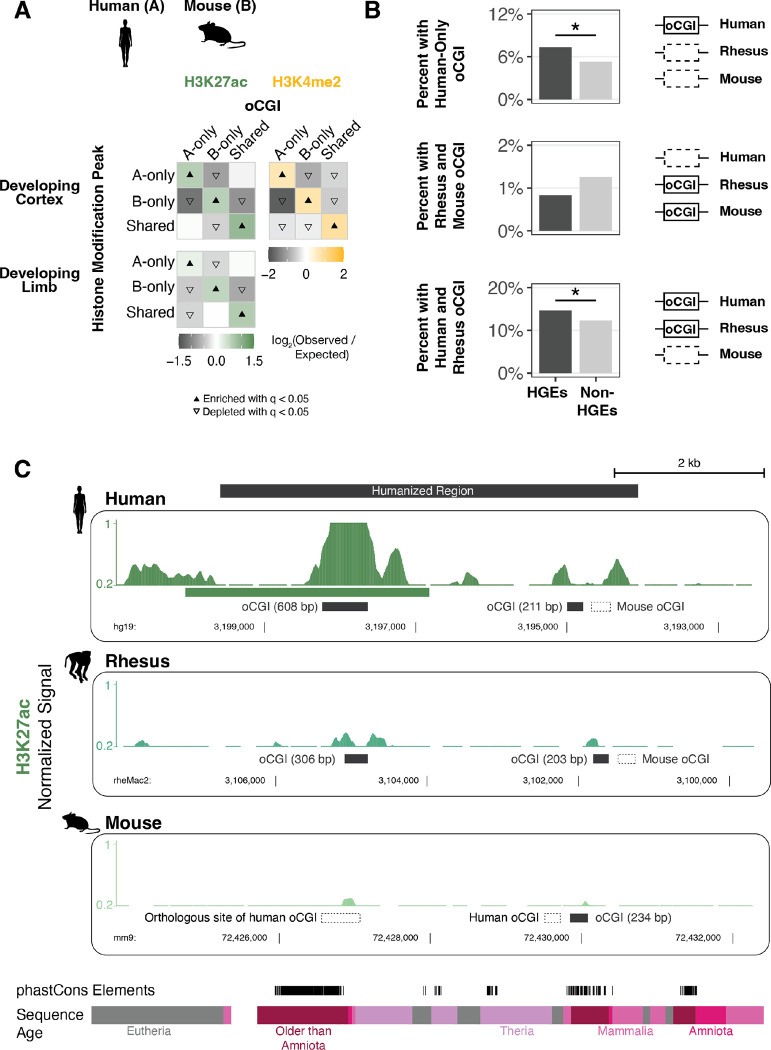
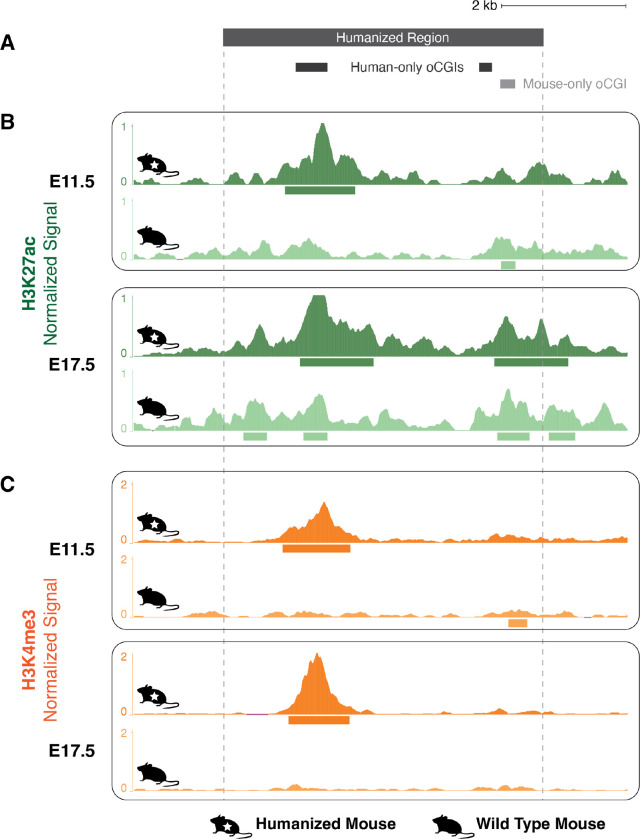
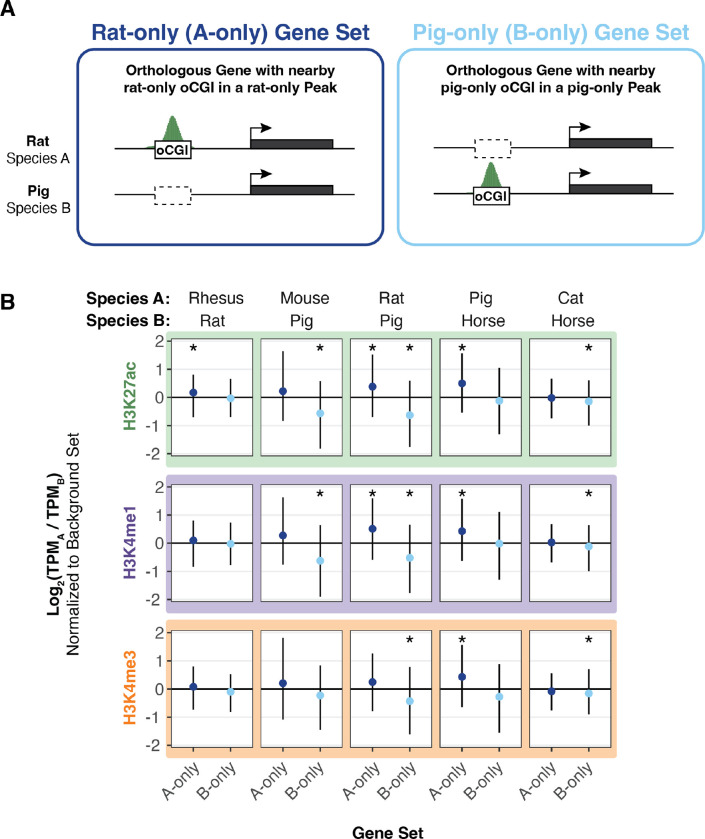
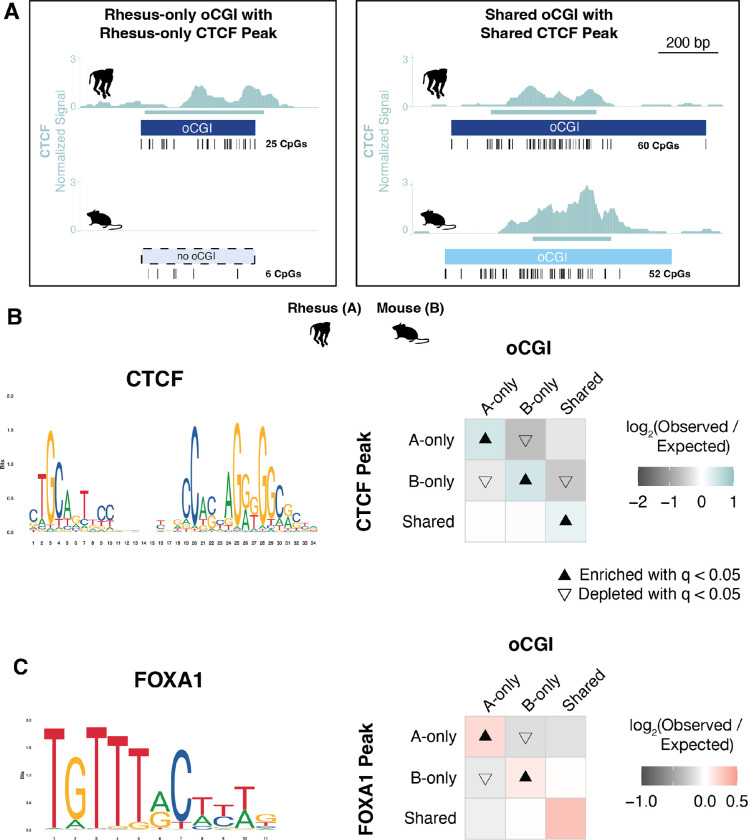
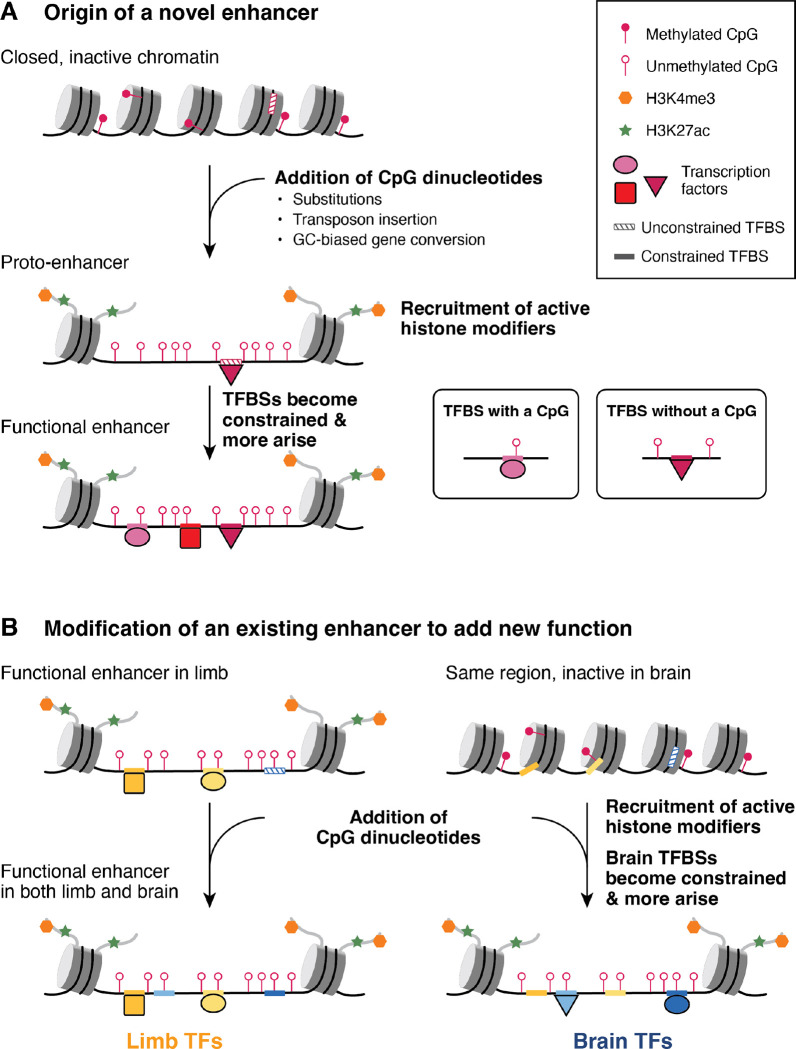
Genetic changes that modify the function of transcriptional enhancers have been linked to the evolution of biological diversity across species. Multiple studies have focused on the role of nucleotide substitutions, transposition, and insertions and deletions in altering enhancer function. Here we show that turnover of CpG islands (CGIs), which contribute to enhancer activation, is broadly associated with changes in enhancer activity across mammals, including humans. We integrated maps of CGIs and enhancer activity-associated histone modifications obtained from multiple tissues in nine mammalian species and found that CGI content in enhancers was strongly associated with increased histone modification levels. CGIs showed widespread turnover across species and species-specific CGIs were strongly enriched for enhancers exhibiting species-specific activity across all tissues and species we examined. Genes associated with enhancers with species-specific CGIs showed concordant biases in their expression, supporting that CGI turnover contributes to gene regulatory innovation. Our results also implicate CGI turnover in the evolution of Human Gain Enhancers (HGEs), which show increased activity in human embryonic development and may have contributed to the evolution of uniquely human traits. Using a humanized mouse model, we show that a highly conserved HGE with a large CGI absent from the mouse ortholog shows increased activity at the human CGI in the humanized mouse diencephalon. Collectively, our results point to CGI turnover as a mechanism driving gene regulatory changes potentially underlying trait evolution in mammals.


Figures

Figure 1.
Figure 1.. oCGIs are enriched for enhancer-associated histone modifications.
(A) The number of oCGIs identified in nine mammalian genomes considered in this study. (B) Percent of oCGIs overlapping a histone modification peak for each indicated histone modification and tissue in rhesus macaque (31, 34, 36). B = adult brain, L = adult liver, M = adult muscle, T = adult testis, DC = developing cortex, DL = developing limb. Gray horizontal lines indicate the expected overlap and stars indicate significant enrichment (q < 0.05, BH-corrected, determined by permutation test; see Methods). (C) The level of each indicated histone modification in peaks with and without oCGIs, measured in Reads per Kilobase per Million (RPKM). Box plots show the interquartile range and median, and whiskers indicate the 90% confidence interval. Stars indicate a significant difference between peaks with and without an oCGI (q < 0.05, Wilcoxon rank-sum test, BH-corrected). (D) Maximum phastCons LOD (log-odds) scores in peaks with and without oCGIs. Box plots show the interquartile range and median, and whiskers indicate the 90% confidence interval. Stars indicate a significant difference between peaks with and without an oCGI (q < 0.05, Wilcoxon rank-sum test, BH-corrected). (E) Evolutionary origin of peaks with and without oCGIs. Bar plots show the percentage of peaks with and without oCGIs whose oldest sequence belongs to each age category. The results shown in panels (C) through (E) were generated using peaks from adult brain in rhesus macaque; see Fig. S5 and Fig. S7 for results from additional species and tissues.
Figure 2.
Figure 2.. oCGIs show extensive turnover across species.
(A) Schematic illustrating how we defined species-specific oCGIs in pairwise comparisons, using rhesus macaque and mouse as an example. Left: a rhesus-only oCGI (the sequence is present in both rhesus and mouse, but the oCGI is only present in rhesus). Right: a shared oCGI (both the sequence and oCGI are present in both rhesus and mouse). Ticks under each oCGI represent the locations of CpG dinucleotides. (B) Percent of oCGIs across the indicated species pairs (species A versus species B) that are “A-only,” “B-only,” or “shared” as described in the main text. The species pair is shown under each bar, with species A denoted by a white circle and species B denoted by a black circle. Percentages of oCGIs that are species A-only (white), species B-only (black), or shared (gray) are shown. (C) Number of CpG dinucleotides in rhesus-only (dark blue) or mouse-only (light blue) oCGIs compared to shared (gray) oCGIs. Box plots show the interquartile range and median, and whiskers indicate the 90% confidence interval. Stars indicate significant differences (q < 0.05 Wilcoxon rank-sum test, BH-corrected). (D) Maximum phastCons LOD scores in rhesus-only, mouse-only, and shared oCGIs. Box plots show the interquartile range and median, and whiskers indicate the 90% confidence interval. Stars indicate significant differences (q < 0.05, Wilcoxon rank-sum test, BH-corrected). (E) Evolutionary origins of rhesus-only, mouse-only, and shared oCGI sequences.
Figure 3.
Figure 3.. Species-specific oCGIs are significantly enriched for species-specific histone modification peaks.
(A) Schematic illustrating how we defined species-specific and shared oCGIs and peaks. In each pairwise species comparison for each histone modification and tissue, we sorted oCGIs throughout the genome based on their species-specificity (designated as A-only, B-only, or shared as in Figure 2) and the species-specificity of their histone modification peaks (also designated as A-only, B-only, or shared, shown in orange in the schematic). (B) An example of a rhesus macaque-specific oCGI overlapping a rhesus-specific H3K4me3 peak in a pairwise comparison of rhesus macaque and mouse. Ticks show the location of CpG dinucleotides. The normalized H3K4me3 signal at this locus is shown in orange, measured as read counts per million in adjacent 10-bp bins. (C) Enrichment and depletion in each indicated comparison of species-specific and shared oCGIs (top: A-only, B-only, Shared) and species-specific and shared peaks (left: A-only, B-only, Shared), compared to a null expectation of no association between oCGI turnover and peak turnover. Each 3 × 3 grid shows the results for a specific test examining oCGIs and their overlap with three histone modifications in adult rhesus macaque brain: H3K4me3 (left), H3K27ac (middle), and H3K4me1 (right). Each box in each grid is colored according to the level of enrichment over expectation (orange for H3K4me3, green for H3K27ac, or purple for H3K4me1) or depletion (gray for all marks) of genome-wide sites that meet the criteria for that box. The color bar below each plot illustrates the level of enrichment or depletion over expectation. The filled upward-pointing triangles denote significant enrichment and open downward-pointing triangles denote significant depletion (q < 0.05, permutation test, BH-corrected, see Fig. S17 and Methods). (D) Enrichment and depletion in an additional species comparison, rat versus dog, and in additional tissues (liver, top, and muscle, bottom), shown as described in (C). (E) Maximum LOD score in species-specific oCGIs in species-specific peaks and shared oCGIs in shared peaks, using data from adult rhesus macaque brain. Box plots show the interquartile range and median, and whiskers indicate the 90% confidence interval. Stars indicate significance (q < 0.05, Wilcoxon rank-sum test, BH-corrected).
Figure 4.
Figure 4.. Association of species-specific oCGIs with species-specific histone modification peaks and HGEs in the developing human cortex and limb.
(A) Enrichment and depletion in each indicated comparison of species-specific and shared oCGIs (top: A-only, B-only, Shared) and species-specific and shared peaks (left: A-only, B-only, Shared), compared to a null expectation of no association between oCGI turnover and peak turnover. As in Figure 3C–D, each 3 × 3 grid shows the results for a specific test examining oCGIs and their overlap with two histone modifications: H3K27ac (left), and H3K4me2 (right). Each box in each grid is colored according to the level of enrichment over expectation (green for H3K27ac or yellow for H3K4me2) or depletion (gray for all marks) of genome-wide sites that meet the criteria for that box. The color bar below each plot illustrates the level of enrichment or depletion over expectation. The filled upward-pointing triangles denote significant enrichment and open downward-pointing triangles denote significant depletion (q < 0.05, permutation test, BH-corrected; see Fig. S17 and Methods). One representative comparison is shown for developing cortex (8.5 post-conception weeks (p.c.w.) in human versus embryonic day 14.5 in mouse) and developing limb (embryonic day 41 in human versus embryonic day 12.5 in mouse). (B) Enrichment of specific oCGI species patterns in HGEs compared to non-HGE enhancers in human cortex at 8.5 p.c.w. Bar plots show the percentage of HGEs (left) or non-HGE enhancers (right) that overlap an oCGI with the specified species pattern: oCGI in human only, oCGI in rhesus & mouse but absent in human, and oCGI in human & rhesus but absent in mouse. Significance was determined using a resampling test comparing HGEs to non-HGE human enhancers matched for overall histone modification levels (resampling test, BH-corrected; see Fig. S28 and Methods). (C) One representative HGE, hs754. H3K27ac levels are shown in developing cortex at human 8.5 p.c.w., rhesus embryonic day 55, and mouse embryonic day 14.5. H3K27ac signal tracks show the number of sequenced fragments per million overlapping each base pair. Black bars denote the locations of oCGIs in each species, and empty bars with dotted lines denote the locations where an orthologous sequence in another species contains an oCGI. Additional tracks show the locations of phastCons elements and sequences of the indicated evolutionary origin. For the purposes of visualization, features in rhesus and mouse have been aligned to the location of an orthologous base pair within the human peak due to overall differences in orthologous sequence lengths.
Figure 5.
Figure 5.. Gain of H3K27ac and H3K4me3 associated with a human oCGI in a humanized mouse model
(A) Locations of oCGIs within hs754 and its mouse ortholog. Dark gray boxes indicate the locations of two human oCGIs not present in the mouse sequence, and the light gray box indicates the location of a mouse oCGI not present in the human sequence. (B) H3K27ac levels in developing diencephalon at the humanized hs754 (top) or wild type (bottom) mouse locus at E11.5 and E17.5. Dark green (humanized) and light green (wild type) tracks show normalized H3K27ac levels as counts per million reads calculated in adjacent 10-bp bins. Peak calls are shown as boxes below the signal tracks. Nominal p-values were obtained by DESeq2 using a Wald test, then BH-corrected for multiple testing across all peaks genome-wide to generate q-values (see values in main text and in Fig. S31). (C) H3K4me3 levels in developing diencephalon at the humanized hs754 (top) or wild type (bottom) mouse locus at E11.5 and E17.5. Data are shown as in (B) but with H3K4me3 signal in dark orange (humanized) or light orange (wild type). The humanized hs754 locus is larger than the wild type locus, so for the purposes of visualization all humanized tracks have been shifted 190 bp to the left, bringing orthologous regions within the oCGI into alignment.
Figure 6.
Figure 6.. Species-specific oCGIs in species-specific peaks are associated with gene expression changes.
(A) Schematic illustrating our method for assigning oCGIs and peaks to genes as described in the text and Figure S35, using a pairwise comparison of rat and pig as an example. Left: A gene associated with a rat-only oCGI in a rat-only H3K27ac peak, which means the gene is assigned to the “rat-only set” (A-only set) of genes. Right: A gene associated with a pig-only oCGI in a pig-only H3K27ac peak, which means the gene is assigned to the “pig-only set” (B-only set) of genes. (B) The log2-transformed TPM ratio for genes in the A-only set and the B-only set for each indicated species pair and histone modification using data from adult brain. Points indicate median values for the A-only set (dark blue) and the B-only set (light blue) and lines indicate the interquartile range. All values in the A-only set and B-only set were normalized to the median TPM ratio across resampling rounds from the background set. Stars indicate a significant difference between the observed median and the expected median (q < 0.05, resampling test to compare to the background set, BH-corrected; see Fig. S35 and Methods).
Figure 7.
Figure 7.. oCGI turnover is associated with changes in transcription factor binding.
(A) Schematic illustrating how we compared species-specific oCGIs with species-specific transcription factor binding events in adult liver, using rhesus macaque and mouse as an example case. Left: a rhesus-only (species A-only) oCGI with a rhesus-only (species A-only) CTCF peak. Right: a shared oCGI with a shared CTCF peak. Ticks show the locations of CpG dinucleotides. (B) Left: the consensus motif for CTCF (MA1929.1 from the JASPAR database). Right: Enrichment and depletion in each indicated comparison of species-specific and shared oCGIs (top: A-only, B-only, Shared) and species-specific and shared CTCF peaks (left: A-only, B-only, Shared), compared to a null expectation of no association between oCGI turnover and peak turnover. Each 3 × 3 grid shows the results for a specific test examining oCGIs and their overlap with CTCF peaks. Each box in each grid is colored according to the level of enrichment over expectation (teal) or depletion (gray) of genome-wide sites that meet the criteria for that box. The color bar below each plot illustrates the level of enrichment or depletion over expectation. The filled upward-pointing triangles denote significant enrichment and open downward-pointing triangles denote significant depletion (q < 0.05, permutation test, BH-corrected; see Fig. S17 and Methods). (C) Left: the consensus motif for FOXA1 (MA0148.1 from the JASPAR database). Right: Enrichment and depletion in each indicated comparison of species-specific and shared oCGIs (top: A-only, B-only, Shared) and species-specific and shared FOXA1 peaks (left: A-only, B-only, Shared). Shown as in (B) but with boxes colored according to the level of enrichment over expectation (red) and depletion (gray) of genome-wide sites that meet the criteria for that box.
Figure 8.
Figure 8.. Model of enhancer evolution via oCGI turnover
(A) Evolution of a new enhancer from a locus in a closed chromatin state. This locus may include unconstrained, inaccessible TFBSs (striped boxes on DNA). DNA is depicted as a black line wrapped around cylindrical nucleosomes. After oCGI gain by several potential mechanisms (indicated in the figure), the site now acts as a proto-enhancer located within open, active chromatin recruited by the oCGI (44), which allows TFs to bind previously inaccessible TFBSs. A subset of histone tails (curved gray lines) with H3K4me3 (orange hexagons) and H3K27ac (green stars) modifications are shown. Filled lollipops indicate methylated CpGs, and unfilled lollipops indicate unmethylated CpGs. Over time, TFBSs become constrained (filled boxes on DNA) and additional TFBSs may arise and become fixed, resulting in the evolution of an enhancer with a constrained biological function. (B) Co-option of an existing enhancer in a novel biological context via oCGI gain. In an ancestral species, the enhancer is active in the developing limb and inactive in the developing brain, where the chromatin at the locus is closed. After oCGI gain, CpG-related mechanisms generate open chromatin in the developing brain, which allows existing unconstrained brain TFBSs to be bound. Over time, these and additional TFBSs may gain biological functions and be maintained by selection. The locus becomes a functional enhancer in the developing brain.

References

    1. Reilly S. K., Noonan J. P., Evolution of Gene Regulation in Humans. Annu Rev Genom Hum G 17, annurev-genom-090314–045935 (2016). - PubMed
    1. Whalen S., Pollard K. S., Enhancer Function and Evolutionary Roles of Human Accelerated Regions. Annu Rev Genet 56, 423–439 (2022). - PMC - PubMed
    1. Dutrow E. V., et al., Modeling uniquely human gene regulatory function via targeted humanization of the mouse genome. Nat Commun 13, 304 (2022). - PMC - PubMed
    1. Aldea D., et al., Repeated mutation of a developmental enhancer contributed to human thermoregulatory evolution. Proc National Acad Sci 118, e2021722118 (2021). - PMC - PubMed
    1. Boyd J. L., et al., Human-Chimpanzee Differences in a FZD8 Enhancer Alter Cell-Cycle Dynamics in the Developing Neocortex. Curr Biol 25, 772–779 (2015). - PMC - PubMed

Publication types