[Preprint]. 2023 May 11:2023.05.10.540233.
doi: 10.1101/2023.05.10.540233.

Mild/Asymptomatic Maternal SARS-CoV-2 Infection Leads to Immune Paralysis in Fetal Circulation and Immune Dysregulation in Fetal-Placental Tissues

Affiliations

Mild/Asymptomatic Maternal SARS-CoV-2 Infection Leads to Immune Paralysis in Fetal Circulation and Immune Dysregulation in Fetal-Placental Tissues

Brianna M Doratt et al. bioRxiv. .

Abstract

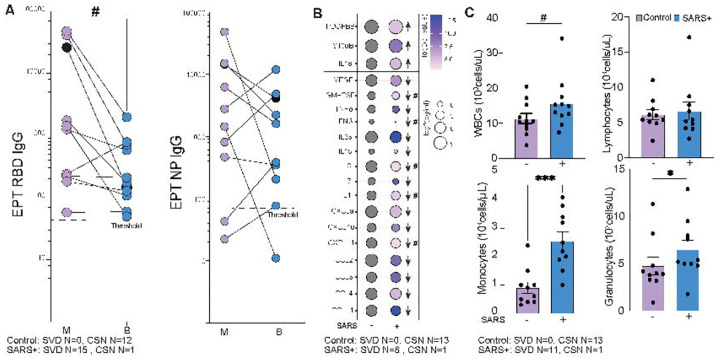
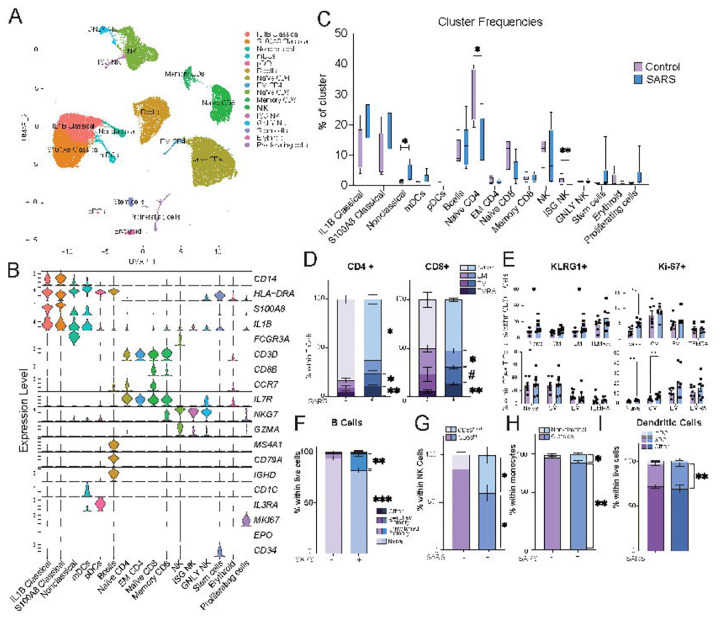
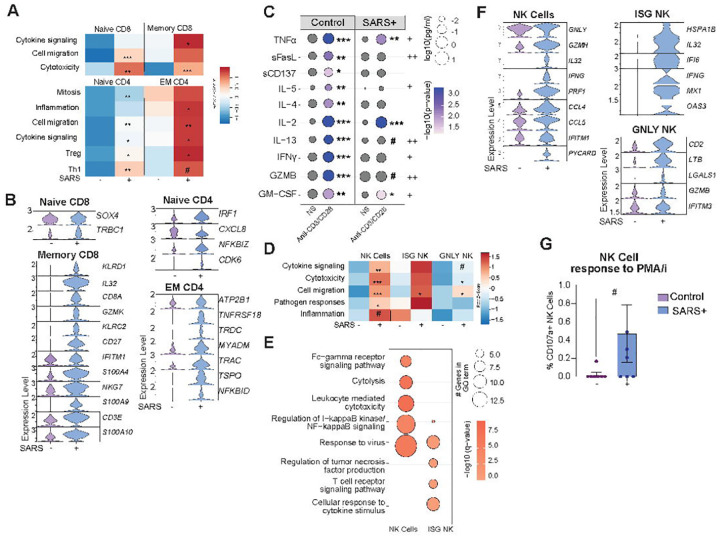
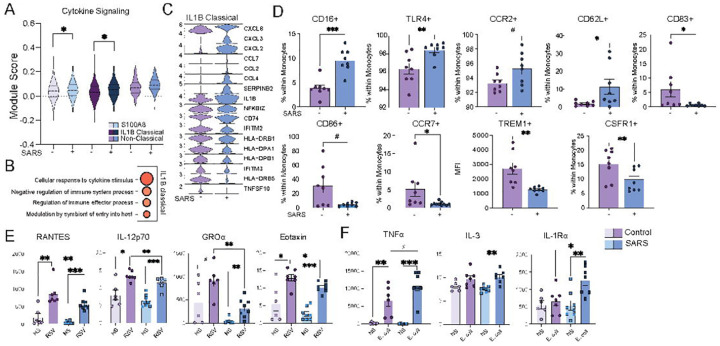
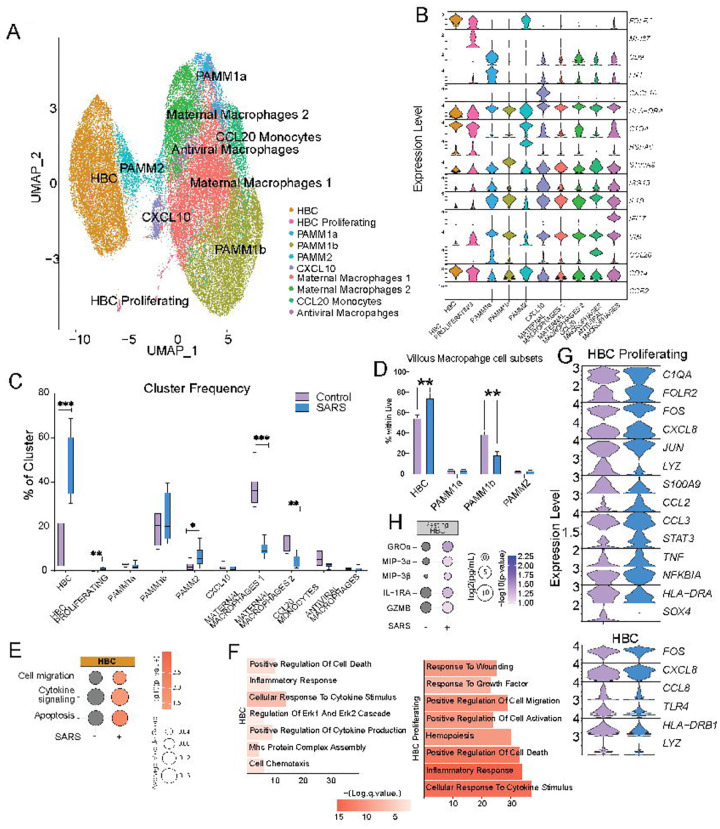
Few studies have addressed the impact of maternal mild/asymptomatic SARS-CoV-2 infection on the developing neonatal immune system. In this study, we analyzed umbilical cord blood and placental chorionic villi from newborns of unvaccinated mothers with mild/asymptomatic SARSCoV-2 infection during pregnancy using flow cytometry, single-cell transcriptomics, and functional assays. Despite the lack of vertical transmission, levels of inflammatory mediators were altered in cord blood. Maternal infection was also associated with increased memory T, B cells, and non-classical monocytes as well as increased activation. However, ex vivo responses to stimulation were attenuated. Finally, within the placental villi, we report an expansion of fetal Hofbauer cells and infiltrating maternal macrophages and rewiring towards a heightened inflammatory state. In contrast to cord blood monocytes, placental myeloid cells were primed for heightened antiviral responses. Taken together, this study highlights dysregulated fetal immune cell responses in response to mild maternal SARS-CoV-2 infection during pregnancy.

Keywords: COVID-19; Hofbauer cells; SARS-CoV-2; chorionic villi; placenta; umbilical cord blood.


Conflict of interest statement

COMPETING INTERESTS The authors declare that there is no conflict of interest regarding the publication of this article.

Figures

Figure 1:
Figure 1:. Maternal SARS Infection alters the frequency of circulating immune cells and immune mediators.
(A) Maternal and umbilical cord blood (UCB) anti-RBD (left) and anti-NP (right) endpoint titers (EPT) from SARS-CoV-2 infected mothers (M) and their offspring (B). All samples are from mothers with a history of mild infection, except for the sample denoted by the black circle, which was asymptomatic and tested positive at delivery. (B) Bubble plot comparing UCB plasma immune mediators from control and maternal SARS+ group. Size represents analyte concentration (pg/mL), whereas color represents statistical significance. (C) UCB complete blood cell counts, including white blood cell (WBC) (top left), lymphocyte (top right), monocyte (bottom left), and granulocyte (bottom right) proportions from control and maternal SARS+ groups. SVD = standard vaginal delivery, CSN = cesarean section. (#=p<0.1, *=p<0.05, ***=p<0.0001).
Figure 2:
Figure 2:. Impact of maternal asymptomatic/mild SARS-CoV-2 infection on phenotype and frequencies of cord blood immune cells.
(A) Uniform manifold approximation and projection (UMAP) representation of 42,486 live immune cells from UCBMC of control and maternal SARS+ groups (N=4/group) showing 16 clusters. (B) Violin plots of marker genes used for cluster identification. (C) Box and whiskers plot comparing cluster frequencies in control and maternal SARS+ groups. (D) Stacked bar graphs of UCB CD4+ and CD8+ T cell subset frequencies in control and maternal SARS+ groups by flow cytometry. (E) Bar graphs comparing KLRG1 and Ki67 expression within CD4+ and CD8+ T cells between control and maternal SARS+ groups. (F-I) Stacked bar graphs comparing (F) B cell, (G) CD56bright/dim NK cell, (H) non-classical and classical monocyte, and (I) Dendritic cell subsets between control and maternal SARS+ group. (#=p<0.1, *=p<0.05, **=p<0.01, ***=p<0.001, ***=p<0.0001).
Figure 3:
Figure 3:. The impact of maternal SARS-CoV-2 infection on fetal lymphocytes and NK cells.
(A) Heatmap of module scores within T cell clusters for the terms indicated. (B) Violin plot comparing normalized transcript counts of select statistically significant DEG within the indicated T cell cluster. (C) Bubble plot comparing secreted levels of immune mediators in cell culture supernatants following stimulation of UCBMC from control and maternal SARS+ groups with antiCD3/CD28. The bubble size represents the analyte concentration (pg/mL), whereas the color represents the level of statistical significance compared to non-stimulated cells. Statistical significance between stimulated control and maternal SARS+ groups are indicated by plus signs (+=p<0.05, ++=p<0.01). (D) Heatmap of module scores within NK cell clusters for the terms indicated. (E) Bubble plot comparing functional enrichment of DEG relative to controls within ISG NK cell and NK cell clusters. The bubble size represents the number of genes mapping to the term, whereas the color represents the level of statistical significance. (F) Violin plot of select statistically significant DEG within the shown NK cell clusters. (G) Bar graph of total NK cell responses to PMA/ionomycin stimulation. (#=p<0.1, *=p<0.05, **=p<0.01, ***=p<0.001).
Figure 4:
Figure 4:. The impact of maternal SARS-CoV-2 infection on fetal myeloid cells.
(A) Violin plot of module scores within clusters of monocyte subsets associated with cytokine and chemokine signaling. (B) Bubble plot of functional enrichment of top genes within the IL-1B classical monocyte cluster. The bubble size represents the number of genes mapping to the term, whereas the color represents the level of statistical significance. (C) Violin plots of select statistically significant DEG within non-classical and IL-1B classical monocytes. (D) Bar graphs of significant differences in UCB monocyte activation phenotypes by maternal infection status. (E-F) Scatterplot comparing select immune mediators secreted in culture supernatants of UCBMC stimulated overnight with (E) RSV or (F) E. coli in control and maternal SARS+ groups. (#=p<0.1, *=p<0.05, **=p<0.01, ***=p<0.001).
Figure 5:
Figure 5:. Impact of maternal SARS-CoV-2 infection on immune cells in the villous compartment.
(A) Uniform Manifold Approximation and Projection (UMAP) of 48,553 immune cells within the villous compartment showing 10 clusters. (B) Violin plots of marker genes that were used for cluster annotation. (C) Box and whisker plots comparing relative cluster frequencies by infection status. (D) Bar graph comparing villous monocyte/macrophage subsets identified by flow cytometry within the live gate. (E) Bubble plot comparing module scores within HBC clusters for the terms indicated. The bubble size represents the average module score, whereas the color represents the level of statistical significance. (F) Barplot of GO terms identified in Metascape for DEG between controls and maternal SARS+ groups from the indicated cluster. The length of the bar indicates the number of genes associated with the term and the color intensity represents statistical significance. (G) Violin plots of select statistically significant DEG within the indicated cluster. (H) Bubble plot comparing secreted levels of immune factors by resting HBCs. The bubble size represents analyte concentration, whereas the color represents the level of statistical significance. (*=p<0.05, **=p<0.01, ***=p<0.001).

Similar articles

References

    1. CDC. Data on COVID-19 during Pregnancy 2022. Available from: https://covid.cdc.gov/covid-data-tracker/#pregnant-population.
    1. Boelig RC, Chaudhury S, Aghai ZH, Oliver EA, Mancuso F, Berghella V, Bergmann-Leitner ES. Comprehensive serologic profile and specificity of maternal and neonatal cord blood SARS-CoV-2 antibodies. AJOG Glob Rep. 2022;2(1):100046. Epub 20211223. doi: 10.1016/j.xagr.2021.100046. - DOI - PMC - PubMed
    1. Regan AK, Arah OA, Fell DB, Sullivan SG. SARS-CoV-2 Infection During Pregnancy and Associated Perinatal Health Outcomes: A National US Cohort Study. J Infect Dis. 2022;225(5):759–67. doi: 10.1093/infdis/jiab626. - DOI - PMC - PubMed
    1. Doyle TJ, Kiros GE, Schmitt-Matzen EN, Propper R, Thompson A, Phillips-Bell GS. Maternal and perinatal outcomes associated with SARS-CoV-2 infection during pregnancy, Florida, 2020–2021: A retrospective cohort study. Clin Infect Dis. 2022. Epub 20220608. doi: 10.1093/cid/ciac441. - DOI - PMC - PubMed
    1. Pulinx B, Kieffer D, Michiels I, Petermans S, Strybol D, Delvaux S, Baldewijns M, Raymaekers M, Cartuyvels R, Maurissen W. Vertical transmission of SARS-CoV-2 infection and preterm birth. European Journal of Clinical Microbiology & Infectious Diseases. 2020;39(12):2441–5. doi: 10.1007/s10096-020-03964-y. - DOI - PMC - PubMed

Publication types