[Preprint]. 2023 May 9:rs.3.rs-2815300.
doi: 10.21203/rs.3.rs-2815300/v1.

Longitudinal modeling of human neuronal aging identifies RCAN1-TFEB pathway contributing to neurodegeneration of Huntington's disease

Affiliations

Longitudinal modeling of human neuronal aging identifies RCAN1-TFEB pathway contributing to neurodegeneration of Huntington's disease

Seong Won Lee et al. Res Sq. .

Update in

Abstract

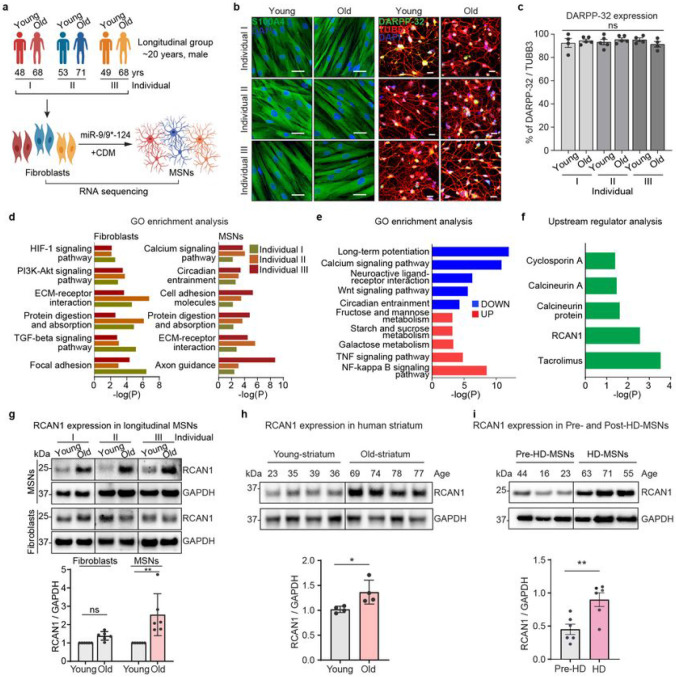
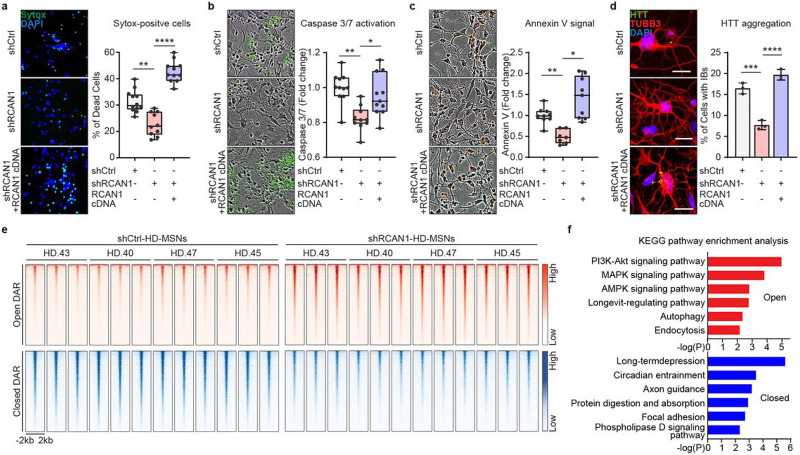
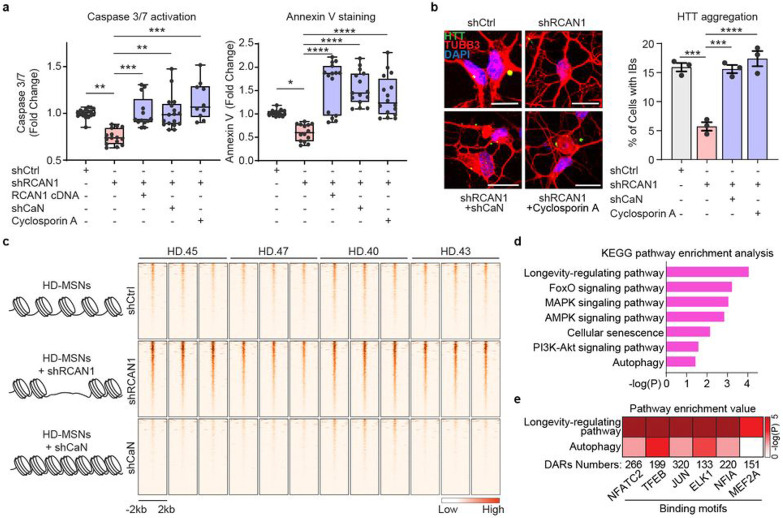
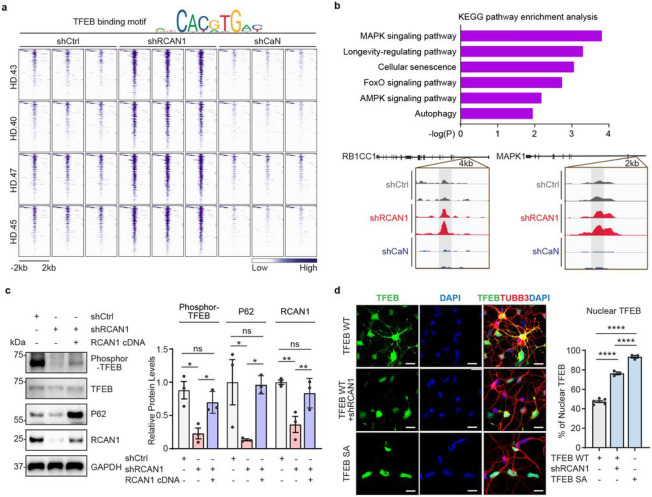
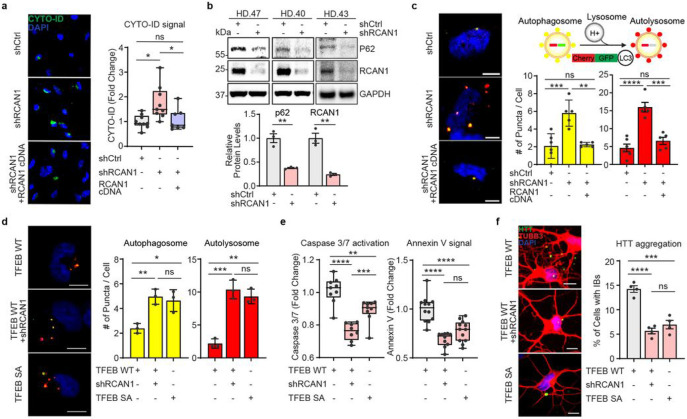
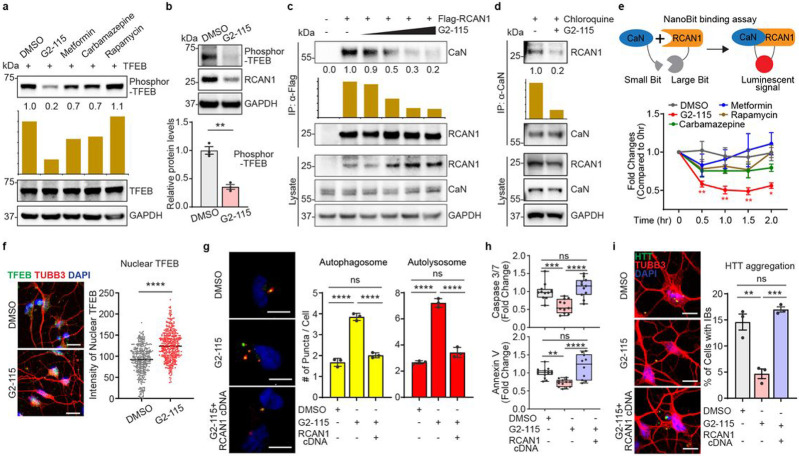
Aging is a common risk factor in neurodegenerative disorders and the ability to investigate aging of neurons in an isogenic background would facilitate discovering the interplay between neuronal aging and onset of neurodegeneration. Here, we perform direct neuronal reprogramming of longitudinally collected human fibroblasts to reveal genetic pathways altered at different ages. Comparative transcriptome analysis of longitudinally aged striatal medium spiny neurons (MSNs), a primary neuronal subtype affected in Huntington's disease (HD), identified pathways associated with RCAN1, a negative regulator of calcineurin. Notably, RCAN1 undergoes age-dependent increase at the protein level detected in reprogrammed MSNs as well as in human postmortem striatum. In patient-derived MSNs of adult-onset HD (HD-MSNs), counteracting RCAN1 by gene knockdown (KD) rescued HD-MSNs from degeneration. The protective effect of RCAN1 KD was associated with enhanced chromatin accessibility of genes involved in longevity and autophagy, mediated through enhanced calcineurin activity, which in turn dephosphorylates and promotes nuclear localization of TFEB transcription factor. Furthermore, we reveal that G2-115 compound, an analog of glibenclamide with autophagy-enhancing activities, reduces the RCAN1-Calcineurin interaction, phenocopying the effect of RCAN1 KD. Our results demonstrate that RCAN1 is a potential genetic or pharmacological target whose reduction-of-function increases neuronal resilience to neurodegeneration in HD through chromatin reconfiguration.


Figures

Fig. 1 ∣
Fig. 1 ∣. Identification of RCAN1 as an age-associated factor in reprogrammed MSNs from longitudinally collected fibroblasts
a, Experimental scheme of RNA-sequencing in fibroblasts and reprogrammed MSNs (young and old) from three independent longitudinal groups (individual I, II, III). MSNs were reprogrammed by overexpressing miR-9/9* and miR-124 (miR-9/9*-124) as well as MSN-defining transcription factors, CTIP2, DLX1, DLX2, and MYT1L (CDM). b, Representative images of fibroblasts of young and old longitudinal groups marked by S100A4 (left) and reprogrammed MSNs marked by DARPP-32 from three individuals. c, Quantification of DARPP-32 positive cells from reprogrammed MSNs from all samples (n=4~5 replicates per sample from 6 individuals). An average of 300 cells were counted from four or more randomly chosen fields. Scale bars represent 20 μm. d, Gene Ontology (GO) enrichment analysis of all DEGs in two replicates of old-fibroblasts (left) and old-MSNs (right) from three independent individuals (FDR<0.05, ∣FC∣≥1.5). e, GO enrichment analysis of up-/down-regulated genes commonly manifested in old-MSNs compared to young-MSNs (FDR<0.05, ∣FC∣≥1.5). f, Upstream regulator analysis of up-/down-regulated genes in old-MSNs in (e). g, Representative Immunoblotting (top) and quantification (bottom) of RCAN1 in six longitudinal MSNs and six fibroblasts (young and old) from three independent individuals (n=6 replicates). The quantification is normalized to values from young samples per line. h. Representative immunoblotting (top) and quantification (bottom) of RCAN1 expression in eight human striatum samples aged 23, 35, 39, 36 (young) and 69, 74, 78, 77 (old) years old (n=8 individuals). i, Representative immunoblotting (top) and quantification (bottom) of RCAN1 expression in three reprogrammed MSNs from presymptomatic patients aged 44, 16, 23 years old (pre-HD-MSN: Pre-HD.42, Pre-HD.45, Pre-HD.40/50) and three reprogrammed MSNs from symptomatic patients aged 63, 71, 55 years old (HD-MSN: HD.47, HD.40, HD.45) (n=6 replicates). Statistical significance was determined using one-way ANOVA (c) and unpaired t-test (g,h,i); **p<0.01, *p<0.05, ns, not significant and mean±s.e.m. The sample size (n) corresponds to the number of biological replicates.
Fig. 2 ∣
Fig. 2 ∣. RCAN1 KD protects HD-MSNs from degeneration and induces chromatin accessibility changes.
a-c, Representative images (left) and quantification (right) of Sytox-positive cells (a), Caspase 3/7 activation (green) (b), and Annexin V signal (red) (c) in three independent HD-MSNs (HD.40, HD.43, HD.47, n=10~12, independent reprogramming experiments) transduced with shControl (shCtrl), shRCAN1, or RCAN1 cDNA. d, Representative images (left) and quantification (right) of cells with HTT inclusion bodies (IBs) in three independent HD-MSNs (HD.40, HD.43, HD.47, n=3) transduced with shCtrl, shRCAN1, or RCAN1. Cells were immunostained with anti-HTT and TUBB3 antibodies. An average of 120 cells per each were counted from three or more randomly chosen fields. Scale bars represent 20 μm. e and f, Analysis of ATAC-sequencing in four independent HD-MSNs (HD.43, HD.40, HD.47, HD.45) transduced with shCtrl or shRCAN1. Heatmaps of signal intensity (e) in chromatin peaks (FDR<0.05, ∣FC∣≥1.5) of open and closed DARs in shRCAN1-HD-MSNs compared to shCtrl-HD-MSNs. KEGG pathway enrichment analysis (f) of genes associated with open (top) and closed (bottom) DARs in shRCAN1-HD-MSNs. Statistical significance was determined using one-way ANOVA (a-d); ****p<0.0001, ***p<0.001, **p<0.01, *p<0.05, and mean±s.e.m. The sample size (n) corresponds to the number of biological replicates (a-d).
Fig. 3 ∣
Fig. 3 ∣. RCAN1 KD and CaN KD-induced chromatin changes
a, Quantification of caspase 3/7 activation (left) and annexin V signal (right) in four independent HD-MSNs (HD43, HD40, HD47, HD45, n=10~18) transduced with shCtrl, shRCAN1, RCAN1, or shCalcineurin (shCaN). Cells were also treated with 10 μM of Cyclosporin A, a CaN inhibitor. b, Representative images (left) and quantification (right) of cells with HTT inclusion bodies (IBs) in three independent HD-MSNs (HD.43, HD.40, HD.47, n=3) transduced with shCtrl, shRCAN1, or shCaN. Cells were treated with 10 μM of Cyclosporin A, a CaN inhibitor. Cells were immunostained with anti-HTT and TUBB3 antibodies. An average of 117 cells of each were counted from three or more randomly chosen fields. Scale bars represent 20 μm. c-e, Analysis of ATAC-sequencing from four independent HD-MSNs (HD43, HD40, HD47, HD45, three replicates each) transduced with shCtrl (control), shRCAN1 (rescuing), or shCaN (detrimental). Heatmaps (c) of signal intensity in overlapping chromatin peaks of open DAR (FDR<0.05, FC≥1.5) in shRCAN1-HD-MSNs and closed DAR (FDR<0.05, FC≤−1.5) in shCaN-HD-MSNs compared to shCtrl-HD-MSNs. KEGG pathway enrichment analysis (d) and pathway enrichment analysis (e) of genes associated with open DARs in shRCAN1-HD-MSNs and closed DARs in shCaN-HD-MSNs in (c). Statistical significance was determined using one-way ANOVA in (a,b); ****p<0.0001, ***p<0.001, **p<0.01, *p<0.05, and mean±s.e.m. Each dot represents one individual’s reprogrammed HD-MSNs (a,b). The sample size (n) corresponds to the number of biological replicates (a,b).
Fig. 4 ∣
Fig. 4 ∣. Enhancing TFEB function by RCAN1 KD via its nuclear localization
a, Heatmap representation of open DARs with shRCAN1 (rescuing) and closed DARs with shCaN (detrimental) harboring TFEB binding motifs, compared to shCtrl Motif analysis from ATAC-sequencing was from four independent HD-MSNs (HD.43, HD.40, HD.47, HD.45, three replicates each) (FDR<0.05, FC≥−1.5). Top legend depicts representative motifs for TFEB binding sites. b, KEGG pathway enrichment analysis (top) of TFEB-binding motif containing genes associated with DARs in (a). Integrative Genomics Viewer (IGV) snapshots (bottom) showing peaks enriched in shRCAN1-HD-MSNs (red) and reduced in shCaN-HD-MSNs (blue) within RB1CC1 and MAPK1 in comparison to shCtrl (grey). c, Representative Immunoblotting (left) and quantification (right) of the expression of phosphor-TFEB (Ser142) from three independent HD-MSNs (HD.43, HD.40, HD.47, n=3) transduced with shCtrl, shRCAN1, or RCAN1. d, Representative image (left) and quantification (right) of nuclear TFEB from three-independent HD-MSNs (HD.43, HD.40, HD.47, n=3~6) transduced with TFEB wildtype (WT), shRCAN1, or TFEB phosphor-mutant (S142/211A, SA). Cells were immunostained with anti-TFEB and TUBB3 antibodies. An average of 130 cells per each were counted from three or more randomly chosen fields. Scale bars represent 20 μm. Statistical significance was determined using one-way ANOVA in (c,d); ****p<0.0001, **p<0.01, *p<0.05, ns: not significant, and mean±s.e.m. Each dot represents one individual’s reprogrammed HD-MSNs (c,d). The sample size (n) corresponds to the number of biological replicates (c,d).
Fig. 5 ∣
Fig. 5 ∣. RCAN1 KD promotes neuronal resilience through enhancing TFEB nuclear localization.
a, Representative images (left) and quantification (right) of CYTO-ID-positive cells from three independent HD-MSNs (HD.43, HD.40, HD.47, n=7~9) transduced with shCtrl, shRCAN1, or RCAN1. b, Immunoblotting (top) and quantification (bottom) of the expression of p62 and RCAN1 from three independent HD-MSNs (HD.43, HD.40, HD.47, n=3) transduced with shCtrl or shRCAN1. c, Autophagic flux measurements using tandem monomeric mCherry-GFP-LC3 (right top). Representative image (left) and quantification (right bottom) of autophagosome and autolysosome from cells having reporter signal puncta from three independent HD-MSNs (HD.43, HD.40, HD.47, n=5~6) transduced with shCtrl, shRCAN1, or RCAN1. d, Representative image (left) and quantification (right) of autophagosome and autolysosome from cells having puncta from three independent HD-MSNs (HD.43, HD.40, HD.47, n=3) transduced with TFEB Wildtype (WT), shRCAN1, or TFEB Phospho-mutant (SA, S142/211A). e, Quantification of Caspase 3/7 activation (left) and Annexin V signal (right) from three independent HD-MSNs (HD.40, HD.43, HD.47, n=8~12) transduced with TFEB WT, shRCAN1 or TFEB SA. f, Representative images (left) and quantification (right) of HTT inclusion bodies (IBs) from four independent HD-MSNs (HD.47, HD.40, HD.43, HD.45, n=4) transduced with TFEB WT, shRCAN1, or TFEB SA. Cells were immunostained with anti-HTT and TUBB3 antibodies. An average of 120 cells per each were counted from three or more randomly chosen fields. Scale bars represent 10 μm (c,d,f). Statistical significance was determined using one-way ANOVA (a,c,d,e,f) and unpaired t-test (b); ****p<0.0001, ***p<0.001, **p<0.01, *p<0.05, ns, not significant, and mean±s.e.m. Each dot represents one individual’s reprogrammed HD-MSNs. The sample size (n) corresponds to the number of biological replicates.
Fig. 6 ∣
Fig. 6 ∣. G2-115 promotes TFEB function by reducing RCAN1-CaN interaction and promoting TFEB nuclear localization.
a, Immunoblotting analysis of autophagy inducer-treated fibroblasts with anti-phosphor-TFEB (Ser142) antibody. Cells were treated with DMSO, 0.5 μM of G2-115, 8 mM of metformin, 100 μM of carbamazepine, or 500 nM of rapamycin. b, Representative Immunoblotting (top) and quantification (bottom) of phosphor-TFEB (Ser142) in three independent HD-MSNs (HD.47, HD.40, HD.45, n=3) treated with DMSO or 0.5μM of G2-115. c, Immunoprecipitation analysis of Flag-RCAN1-transfected HEK293 cells with anti-Flag antibody followed by immunoblotting with anti-CaN antibody. Dose-response of cells was measured with 0.25, 0.5, 2.5, and 5 μM of G2-115. d, Immunoprecipitation analysis of chloroquine (lysosome inhibitor)-treated fibroblasts with anti-CaN followed by immunoblotting with anti-RCAN1 antibody. Cells were treated with DMSO or 0.5 μM of G2-115 and 60 μM of chloroquine (lysosome inhibitor), e, Experimental scheme of NanoBit binding assay (top). Binding assay of HEK293 cells transfected with RCAN1 fused to a large Bit and CaN fused to a small Bit. Cells were treated with autophagy inducers (2.0 μM of G2-115, 8 mM of metformin, 100 μM of carbamazepine, or 500 nM of rapamycin) (bottom), f, Representative image (left) and quantification (right) of nuclear TFEB in three independent HD-MSNs (HD.43, HD.45, HD.40, n=3) treated with DMSO or 0.5 μM of G2-115. Scale bars represent 20 μm. Each dot represents one reprogrammed cell positive for TFEB and DAPI. g, Representative images (left) of HD-MSNs expressing the tandem monomeric mCherry-GFP-LC3 reporter. Quantification (right) of autophagosome and autolysosome from cells having puncta from three independent HD-MSNs (HD.40, HD.47, HD.43, n=3) treated with DMSO or 0.5 μM of G2-115. Cells were transduced with Control or RCAN1 and measurements were performed in cells having puncta (from more than 50 cells per MSN line). Scale bars represent 20 μm. h, Quantification of caspase 3/7 activation (top) from three independent HD-MSNs (HD.40, HD.47, HD.45, n=11) and annexin V signal (bottom) from three independent HD-MSNs (HD.43, HD.47, HD.45, n=10~15) treated with DMSO or 0.5μM of G2-115. Cells were transduced with Control or RCAN1. i. Representative image (left) and quantification (right) of HTT inclusion bodies (IBs) in three independent HD-MSNs (HD.43, HD.40, HD.47, n=3) treated with DMSO or 0.5 μM of G2-115. Cells were transduced with Control or RCAN1. Cells were immunostained with anti-HTT and TUBB3 antibodies. An average of 300 cells per each were counted from three or more randomly chosen fields. Scale bars represent 10 μm. Statistical significance was determined using one-way ANOVA (e,g,h,i) and unpaired t-test (b,f); ****p<0.0001, ***p<0.001, **p<0.01, *p<0.05, ns, not significant, and mean±s.e.m. Each dot represents one individual’s reprogrammed HD-MSNs (b,g,h,i). The sample size (n) corresponds to the number of biological replicates (b,f,g,h,i).

References

    1. Wyss-Coray T. Ageing, neurodegeneration and brain rejuvenation. Nature 539, 180–186, doi:10.1038/nature20411 (2016). - DOI - PMC - PubMed
    1. Rose M. R. Adaptation, aging, and genomic information. Aging (Albany NY) 1, 444–450, doi:10.18632/aging.100053 (2009). - DOI - PMC - PubMed
    1. Machiela E. & Southwell A. L. Biological Aging and the Cellular Pathogenesis of Huntington's Disease. J Huntingtons Dis 9, 115–128, doi:10.3233/JHD-200395 (2020). - DOI - PMC - PubMed
    1. Niccoli T. & Partridge L. Ageing as a risk factor for disease. Curr Biol 22, R741–752, doi:10.1016/j.cub.2012.07.024 (2012). - DOI - PubMed
    1. Hou Y. et al. Ageing as a risk factor for neurodegenerative disease. Nat Rev Neurol 15, 565–581, doi:10.1038/s41582-019-0244-7 (2019). - DOI - PubMed

Publication types