[Preprint]. 2023 May 10:rs.3.rs-2838359.
doi: 10.21203/rs.3.rs-2838359/v1.

Pyruvate dehydrogenase complex integrates the metabolome and epigenome in CD8+ memory T cell differentiation in vitro

Affiliations

Pyruvate dehydrogenase complex integrates the metabolome and epigenome in CD8+ memory T cell differentiation in vitro

Tatiana Tarasenko et al. Res Sq. .

Abstract

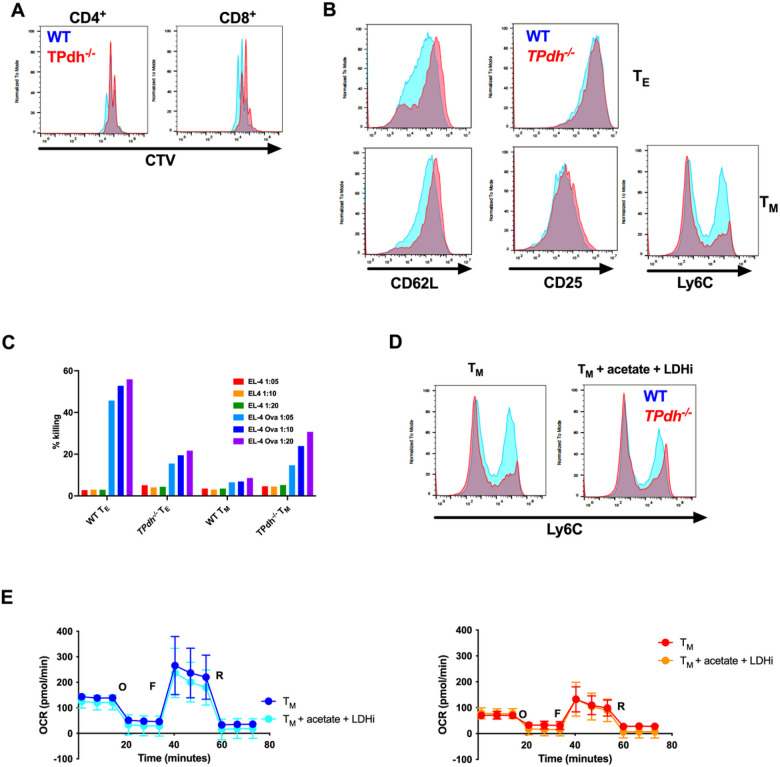
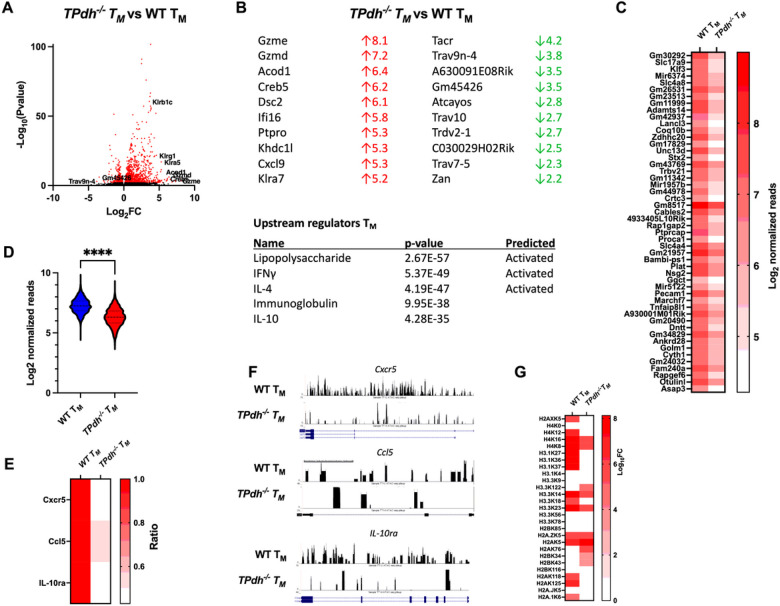
Modulation of metabolic flux through pyruvate dehydrogenase complex (PDC) plays an important role in T cell activation and differentiation. PDC sits at the transition between glycolysis and the tricarboxylic acid cycle and is a major producer of acetyl-CoA, marking it as a potential metabolic and epigenetic node To understand the role of pyruvate dehydrogenase complex in T cell differentiation, we generated mice deficient in T cell pyruvate dehydrogenase E1A (Pdha) subunit using a CD4-cre recombinase-based strategy. Herein, we show that genetic ablation of PDC activity in T cells (TPdh-/-) leads to marked perturbations in glycolysis, the tricarboxylic acid cycle, and OXPHOS. TPdh-/- T cells became dependent upon substrate level phosphorylation via glycolysis, secondary to depressed OXPHOS. Due to the block of PDC activity, histone acetylation was also reduced, including H3K27, a critical site for CD8+ TM differentiation. Transcriptional and functional profiling revealed abnormal CD8+ TM differentiation in vitro. Collectively, our data indicate that PDC integrates the metabolome and epigenome in CD8+ memory T cell differentiation. Targeting this metabolic and epigenetic node can have widespread ramifications on cellular function.


Figures

Figure 1
Figure 1
Mouse model of T cell pyruvate dehydrogenase complex deficiency. A) Pdha DNA in splenic T cells from TPdh−/−. CD4+ cre-recombinase was used to target T cells for deletion of Pdha locus. qPCR for Pdha was performed. N = 4 mice/condition. B) Immunoblot for PDHA from TPdh−/− T cells. Total protein was extracted from splenic T cells. Immunoblots were probed for PDHA and normalized to actin (N = 3 / condition). C) Pyruvate oxidation in activated T cells. T cells were activated for 24 hours with CD3/CD28 and cultured in glucose free media supplemented with pyruvate as a carbon source. Extracellular flux analysis was performed. *** P < 0.001, **** P < 0.0001. Central line = mean, error bars = standard error of the mean.
Figure 2
Figure 2
TPdh−/− T cells display perturbations in glycolysis and disruption of tricarboxylic acid (TCA) cycle entry. A) Extracellular flux analysis of activated T cells. T cells were activated for 24 hours with CD3/CD28 antibodies. Glycolytic stress test was performed. B) Metabolomics for glycolytic intermediates. Splenic WT and TPdh−/− T cells were stimulated for 24 hours as above. Cells were harvested and sent for metabolomic analysis. Metabolites were normalized to cellular protein levels. N = 10 mice/condition. C) Cartoon demonstrating use of uniform 13C-glucose as a carbon source for isotopomer labelling studies. D) Isotopologue labelling for citrate, malate, and fumarate. T cells were stimulated as above for 24 hours in the presence of 13C-glucose (N = 3 /condition). E) Glycolytic dependence in proliferating cells. Splenic T cells from WT and TPdh−/− T cells were stimulated as above and incubated with increasing concentrations of 2-deoxyglucose (2DG). Proliferation was measured by Cell Trace Violet (CTV) dilution via flow cytometry (N = 3 mice/condition). Representative of 3 or more experiments. Error bars = SEM. * P < 0.05, ** P < 0.01, *** P < 0.001, **** P < 0.0001. Central line = mean, error bars = standard error of the mean.
Figure 3
Figure 3
TPdh−/− T cells maintain total cellular ATP despite perturbations in multiple energetic pathways. A) Metabolomics analyses. Splenic WT and TPdh−/− T cells were activated as above for 24 hours. Cell pellets were collected and sent for metabolomic analysis. Metabolites were normalized to protein levels. N = 10 mice/condition. B) Cartoon demonstrating use of uniform 13C-glutamine as a carbon source for isotopomer labelling studies. C) Labelling of TCA cycle intermediates by 13C-glutamine in T cells activated for 24 hours (N = 3 mice / condition). D) Glutamine oxidation by extracellular flux analysis. Extracellular flux analysis was performed following the introduction of glutamine as the carbon source. (N = 14 WT mice, N = 8 TPdh−/− mice. E) Extracellular flux analysis in T cells. T cells were activated for 24 hours using anti-CD3/CD28. Mitostress test was performed. N = 5-6 mice / condition. F) Total cellular ATP determined by metabolomics. WT and TPdh−/− T cells were activated for 24 hours as above. Cell pellets were collected and sent for metabolomic analysis. Metabolites were normalized to protein levels. N = 10 mice / condition. Error bars = SEM. * P < 0.05, *** P < 0.001, **** P < 0.0001. Central line = mean, error bars = standard error of the mean.
Figure 4
Figure 4
Abnormal TM differentiation in TPdh−/− cells. A) CD4+ and CD8+ T cell proliferation. Splenic T cells were isolated and stimulated with anti-CD3/CD28 for 72 hours. Proliferation was measured by Cell Trace Violet (CTV) dilution via flow cytometry. WT (blue), TPdh−/− (red). B) TPdh−/− TE and TM cell surface markers of differentiation. Following IL-2 or II-15 treatment, cells were analyzed by flow cytometry for their appropriate surface markers. C) TPdh−/− T cell killing assay. OT-I TE and TM cells were assessed for their ability kill EL-4 cell targets loaded with OVA peptide. D) Treated TPdh−/− TM cells. In addition to IL-15 treatment, T cells were treated with acetate (10 mM) and a lactate dehydrogenase inhibitor (LDHi, 25 mM). Ly6C was determined by flow cytometry. E) Extracellular flux analysis of TM cells supplemented following treatment as in D). N = 5-6 mice/condition. Error bars = SEM. Flow cytometry and cell killing graphs are representative of multiple experiments. Experiments were repeated 3 or more times.
Figure 5
Figure 5
Genomic studies of TM cells. Splenic T cells were differentiated into TM cells using established protocols. RNA was extracted and submitted for RNAseq (N = 5 mice/condition). A) Volcano plot demonstrating differentially expressed genes. B) Gene ontology (GO) for differentially expressed genes. Gene ratio is the percentage of total differentially expressed genes in the given GO term. C) ChIPseq for TM cells. Splenic T cells were differentiated as indicated above. Acetylated histones were immunopreciptated and DNA was sent for sequencing (N = 4 / condition). Top 50 genes detected by ChIPseq. D) Log2 normalized reads for ChIPseq. E) ChIP PCR of select targets identified by ChIPseq. Acetylated histones were precipitate as above. Genes involved in TM differentiation which were also detected in ChIPseq were amplified using ChIP PCR. F) ATACseq of TM cells. Splenic T cells were differentiated as above. Genes involved in TM differentiation and identified in ChIPseq were examined for open regions of chromatin. Black peaks represent open regions of chromatin (N = 4/ condition). G) Histone proteomics. Histones were isolated from TM cells and subjected to proteomic analysis for post-translational modifications. **** P < 0.0001.

References

    1. Cluntun A. A. et al. The rate of glycolysis quantitatively mediates specific histone acetylation sites. Cancer Metab 3, 10, doi:10.1186/s40170-015-0135-3 (2015). - DOI - PMC - PubMed
    1. Buck M. D., O'Sullivan D. & Pearce E. L. T cell metabolism drives immunity. J Exp Med 212, 1345–1360, doi:10.1084/jem.20151159 (2015). - DOI - PMC - PubMed
    1. Roychoudhuri R. et al. Transcriptional profiles reveal a stepwise developmental program of memory CD8(+) T cell differentiation. Vaccine 33, 914–923, doi:10.1016/j.vaccine.2014.10.007 (2015). - DOI - PMC - PubMed
    1. Weng N. R, Araki Y. & Subedi K. The molecular basis of the memory T cell response: differential gene expression and its epigenetic regulation. Nat Rev Immunol 12, 306–315, doi:10.1038/nri3173 (2012). - DOI - PMC - PubMed
    1. Dai Z., Ramesh V. & Locasale J. W. The evolving metabolic landscape of chromatin biology and epigenetics. Nat Rev Genet 21, 737–753, doi:10.1038/s41576-020-0270-8 (2020). - DOI - PMC - PubMed

Publication types