[Preprint]. 2023 Sep 23:2023.05.05.539614.
doi: 10.1101/2023.05.05.539614.

Signal recovery in single cell batch integration

Affiliations

Signal recovery in single cell batch integration

Zhaojun Zhang et al. bioRxiv. .

Update in

Abstract

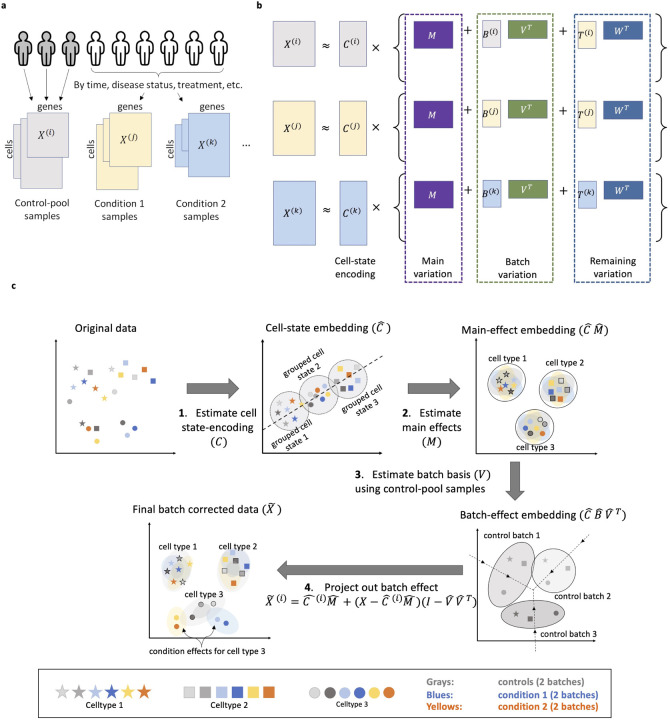
Data integration to align cells across batches has become a cornerstone of single cell data analysis, critically affecting downstream results. Yet, how much biological signal is erased during integration? Currently, there are no guidelines for when the biological differences between samples are separable from batch effects, and thus, data integration usually involve a lot of guesswork: Cells across batches should be aligned to be "appropriately" mixed, while preserving "main cell type clusters". We show evidence that current paradigms for single cell data integration are unnecessarily aggressive, removing biologically meaningful variation. To remedy this, we present a novel statistical model and computationally scalable algorithm, CellANOVA, to recover biological signal that is lost during single cell data integration. CellANOVA utilizes a "pool-of-controls" design concept, applicable across diverse settings, to separate unwanted variation from biological variation of interest. When applied with existing integration methods, CellANOVA allows the recovery of subtle biological signals and corrects, to a large extent, the data distortion introduced by integration. Further, CellANOVA explicitly estimates cell- and gene-specific batch effect terms which can be used to identify the cell types and pathways exhibiting the largest batch variations, providing clarity as to which biological signals can be recovered. These concepts are illustrated on studies of diverse designs, where the biological signals that are recovered by CellANOVA are shown to be validated by orthogonal assays. In particular, we show that CellANOVA is effective in the challenging case of single-cell and single-nuclei data integration, where the recovered biological signals are replicated in an independent study.

Keywords: Batch effect; Data alignment; Data integration; Experimental design; RNA; Removing unwanted variation; Single cell.


Figures

Fig. 1:
Fig. 1:
Examples of control-pool construction and integration results. (a) The case-control design in the type 1 diabetes (T1D) study involved 11 healthy individuals, 5 individuals with T1D, and 8 individuals with AAB+. The 11 healthy individuals are designated as the control pool. (c) The longitudinal design in the immunotherapy trial dataset involved 10 lung cancer patients undergoing 2 types of immunotherapy treatments sequenced at 4 time points. The 10 samples taken before treatment are designated as the control pool. (e) The irregular block design in the mouse radiation experiment performed by 2 technician teams, with a strong technician effect confounded with time. To separate time and treatment effects, we designate the 5 control samples as the control pool. (g) Case-control design of multimodal single-cell and single-nuclei RNA sequencing for kidney atlas-building study, with large batch effects from different technology platforms. We designate the 17 control samples (including samples from both scRNA-seq and snRNA-seq) as the control pool. UMAP visualizations of Harmony integration, with and without CellANOVA signal recovery, for each dataset. (b: type 1 diabetes study; d: immunotherapy trial dataset; f: mouse radiation experiment dataset; h: multimodal kidney dataset).
Fig. 2:
Fig. 2:
(a) "Pool-of-controls” design of multi-sample single-cell data. (b) The CellANOVA Model. (c) The CellANOVA algorithm. Step 1: Estimate cell state-encoding via singular value decomposition of an existing integration across samples. Step 2: Estimate main effects by regressing the original expression vectors on the cell state-encoding. Step 3: Estimate batch basis (V) using control-pool samples by performing singular value decomposition of the effect space after removing main effects. Step 4: Remove batch effects for all samples by projection into null space of V.
Fig. 3:
Fig. 3:
(a) Experiment workflow for benchmarking CellANOVA against existing state-of-the-art methods in removing unwanted batch variation, introducing global distortion (cell level) and gene-specific distortion (gene level). In each experiment run, we designated one control sample as a "fake" treatment sample (hold-out set) and used the remaining control samples to estimate the batch variation basis. On the hold-out sample, we performed DEG analysis using either uncorrected expression, or batch-corrected expression, between pre-defined cell types, obtaining a multiple-testing adjusted p-value for each gene for each comparison. We compute the correlation between pre- and post- expression for each cell. (b) Illustration of global distortion (left) and gene-specific distortion (right). Global distortion refers to the degree to which the integrated data differs from the original data prior to integration. Gene-specific distortion refers to the preservation of gene-level differences (or the lack thereof) between predefined cell groups. (c-e) Benchmark on type 1 diabetes dataset (c), immunotherapy trial dataset (d) and mouse radiation experiment dataset(e). LISI scores of the fake treatment sample after batch correction in each hold-out experiment are shown on the left. Correlations between pre- and post-CellANOVA correction gene expressions per cell are shown in the middle. Comparisons of p-values obtained from DEG analysis with or without CellANOVA correction are on the right.
Fig. 4:
Fig. 4:
(a) Illustration of batch integration with signal preservation. An effective integration removes batch differences while preserving differences between conditions (middle). An overly aggressive integration erases meaningful differences between conditions (left). An ineffective integration fails to remove batch effects (right). (b) Illustration of out-of-batch nearest neighbors. We search for a cell’s nearest neighbors, only cells outside of the cell’s own batch (i.e., sample) are considered. NN: nearest neighbor. (c) Nearest-neighbor composition for cells from Leo’s day 10 SR sample, after integration by CellANOVA. The enrichment of cells from the same biological condition rather than the same technician indicates effective batch removal with signal preservation. (d-f) Benchmarking signal preservation after batch correction on three datasets using out-of-batch nearest neighbor proportion: (d) ductal cells in the T1D dataset, (e) all CD8 T cells from all patient groups in the immunotherapy trial dataset, (f) non-naive CD8 T cells from the JAKi group in the immunotherapy trial dataset. Enrichment of cells from the same treatment condition indicates the recovery of biological differences specific to the condition and cell type.
Fig. 5:
Fig. 5:
Comparison of pathway enrichment analysis based on scRNA-seq versus flow cytometry of corresponding markers in NSCLC immunotherapy trial data. (a) G2-M checkpoint pathway enrichment (scRNA-seq) versus Ki67 frequency (flow cytometry). A positive normalized enrichment score (NES) from GSEA indicates higher pathway enrichment in the later time points. Both Ki67 and G2-M checkpoint pathway activity measure cell proliferation. (b) Interferon alpha/gamma response pathway enrichment (scRNA-seq) versus ISG15 mean fluorescence intensity (flow cytometry). (c) Cell-subtype-specific gene set analysis within each response group between cycle 2 and cycle 4 after Harmony-based CellANOVA integration. Top 5 up-regulated and down-regulated pathways in cycle 4 compared to cycle 2 are shown.
Fig. 6:
Fig. 6:
Evaluation of CellANOVA in motimodal data integration. (a) Assessment of CellANOVA in batch removal and distortion correction. Left panel: distribution of iLISI scores across cells of each hold-out sample based on unintegrated data, Harmony-integrated data, and CellANOVA-integrated data. Top-right panel: comparisons of p-values obtained from DEG analysis with or without CellANOVA. Bottom-right panel: correlations between pre- and post-CellANOVA correction gene expressions per cell. (b) Top ten upregulated pathways identified within the disease condition for each specific cell type in the Abedini et al. data and the KPMP data, using batch-corrected expression data generated by CellANOVA. (c) Density plot for the distribution of out-of-batch nearest neighbor proportion from disease or control conditions around diseased cells. (d) Scatter plots of TNF-alpha signaling via NF-kB pathway activity score versus injured proximal tubule to normal proximal tubule cell ratio for each Visium slice, with p-values calculated from linear regression. (e) Spatial distribution of spot-specific injured proximal tubule to normal proximal tubule cell ratio (left) and spatial distribution of the activity score of TNF-alpha signaling via NF-kB pathway (right) on Visium slice from sample HK_2770 (top) and HK_2844 (bottom), respectively. (f) Left panel: UMAP visualization of CellANOVA-integrated PT and iPT cells, with cells colored by cell type, diffusion pseudotime from PAGA trajectory analysis, and pathway activity score of TNF-alpha signaling via NF-kB. Right panel: scatter plot of diffusion pseudotime along the trajectory versus TNF-alpha signaling via NF-kB pathway activity score.
Fig. 7:
Fig. 7:
(a) UMAP visualization of batch effects estimated by Harmony-based CellANOVA on three datasets, colored by batch and cell type. (b) Top ten batch-affected pathways of each study based on batch-susceptibility score (BSS) with Harmony-based CellANOVA.

References

    1. Hicks Stephanie C, Teng Mingxiang, Irizarry Rafael A, et al. On the widespread and critical impact of systematic bias and batch effects in single-cell rna-seq data. BioRxiv, 10:025528, 2015.
    1. Tung Po-Yuan, Blischak John D, Joyce Hsiao Chiaowen, Knowles David A, Burnett Jonathan E, Pritchard Jonathan K, and Gilad Yoav. Batch effects and the effective design of single-cell gene expression studies. Scientific reports, 7(1):39921, 2017. - PMC - PubMed
    1. Luecken Malte D and Theis Fabian J. Current best practices in single-cell rna-seq analysis: a tutorial. Molecular systems biology, 15(6):e8746, 2019. - PMC - PubMed
    1. Zhang Yulong, Xu Siwen, Wen Zebin, Gao Jinyu, Li Shuang, Weissman Sherman M, and Pan Xinghua. Sample-multiplexing approaches for single-cell sequencing. Cellular and Molecular Life Sciences, 79(8):466, 2022. - PMC - PubMed
    1. Kang Hyun Min, Subramaniam Meena, Targ Sasha, Nguyen Michelle, Maliskova Lenka, McCarthy Elizabeth, Wan Eunice, Wong Simon, Byrnes Lauren, Lanata Cristina M, et al. Multiplexed droplet single-cell rna-sequencing using natural genetic variation. Nature biotechnology, 36(1):89–94, 2018. - PMC - PubMed

Publication types