This is a preprint.
Reliability of resting-state EEG modulation by continuous and intermittent theta burst stimulation of the primary motor cortex: A sham-controlled study
- PMID: 37215043
- PMCID: PMC10197617
- DOI: 10.1101/2023.05.12.540024
Reliability of resting-state EEG modulation by continuous and intermittent theta burst stimulation of the primary motor cortex: A sham-controlled study
Update in
-
Reliability of resting-state EEG modulation by continuous and intermittent theta burst stimulation of the primary motor cortex: a sham-controlled study.Sci Rep. 2023 Nov 2;13(1):18898. doi: 10.1038/s41598-023-45512-6. Sci Rep. 2023. PMID: 37919322 Free PMC article. Clinical Trial.
Abstract
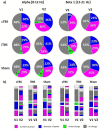
Theta burst stimulation (TBS) is a form of repetitive transcranial magnetic stimulation designed to induce changes of cortical excitability that outlast the period of TBS application. In this study, we explored the effects of continuous TBS (cTBS) and intermittent TBS (iTBS) versus sham TBS stimulation, applied to the primary motor cortex, on modulation of resting state electroencephalography (rsEEG) power. We first conducted hypothesis-driven region-of-interest (ROI) analyses examining changes in alpha (8-12 Hz) and beta (13-21 Hz) bands over the left and right motor cortex. Additionally, we performed data-driven whole-brain analyses across a wide range of frequencies (1-50 Hz) and all electrodes. Finally, we assessed the reliability of TBS effects across two sessions approximately 1 month apart. None of the protocols produced significant group-level effects in the ROI. Whole-brain analysis revealed that cTBS significantly enhanced relative power between 19-43 Hz over multiple sites in both hemispheres. However, these results were not reliable across visits. There were no significant differences between EEG modulation by active and sham TBS protocols. Between-visit reliability of TBS-induced neuromodulatory effects was generally low-to-moderate. We discuss confounding factors and potential approaches for improving the reliability of TBS-induced rsEEG modulation.
Conflict of interest statement
Competing interests Dr. A. Pascual-Leone is a co-founder of Linus Health and TI Solutions AG; serves on the scientific advisory boards for Starlab Neuroscience, Neuroelectrics, Magstim Inc., Nexstim, Cognito, and MedRhythms; and is listed as an inventor on several issued and pending patents on the real-time integration of noninvasive brain stimulation with electroencephalography and magnetic resonance imaging.
Figures


References
-
- Huang Y. Z., Edwards M. J., Rounis E., Bhatia K. P. & Rothwell J. C. Theta burst stimulation of the human motor cortex. Neuron 45, 201–206 (2005). - PubMed
-
- Hess G., Aizenman C. & Donoghue J. P. Conditions for the Induction of Long-Term Potentiation in Layer II / III Horizontal Connections of the Rat Motor Cortex. J Neurophysiol 75, 1765–1778 (1996). - PubMed
-
- Chung S. W., Hill A. T., Rogasch N. C., Hoy K. E. & Fitzgerald P. B. Use of theta-burst stimulation in changing excitability of motor cortex: A systematic review and meta-analysis. Neurosci Biobehav Rev 63, 43–64 (2016). - PubMed
-
- Larson J. & Lynch G. Theta pattern stimulation and the induction of LTP: the sequence in which synapses are stimulated determines the degree to which they potentiate. Brain Res 489, 49–58 (1989). - PubMed
Publication types
Grants and funding
LinkOut - more resources
Full Text Sources
Miscellaneous
