[Preprint]. 2023 May 11:rs.3.rs-2813601.
doi: 10.21203/rs.3.rs-2813601/v1.

Early Elevated IFNα Identified as the Key Mediator of HIV Pathogenesis and its low level a Hallmark of Elite Controllers

Affiliations

Early Elevated IFNα Identified as the Key Mediator of HIV Pathogenesis and its low level a Hallmark of Elite Controllers

Hélène Le Buanec et al. Res Sq. .

Update in

  • Early elevated IFNα is a key mediator of HIV pathogenesis.
    Buanec HL, Schiavon V, Merandet M, How-Kit A, Bergerat D, Fombellida-Lopez C, Bensussan A, Bouaziz JD, Burny A, Darcis G, Song H, Sajadi MM, Kottilil S, Gallo RC, Zagury D. Buanec HL, et al. Commun Med (Lond). 2024 Mar 19;4(1):53. doi: 10.1038/s43856-024-00454-6. Commun Med (Lond). 2024. PMID: 38504106 Free PMC article.

Abstract

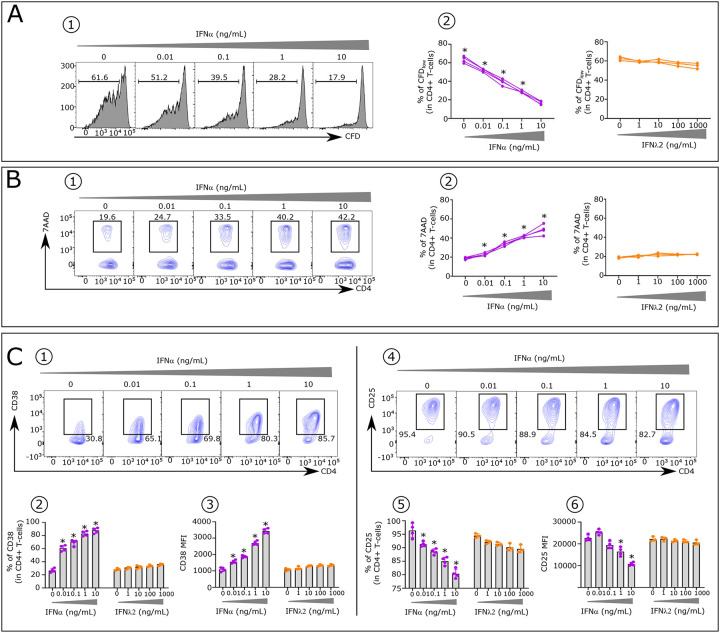
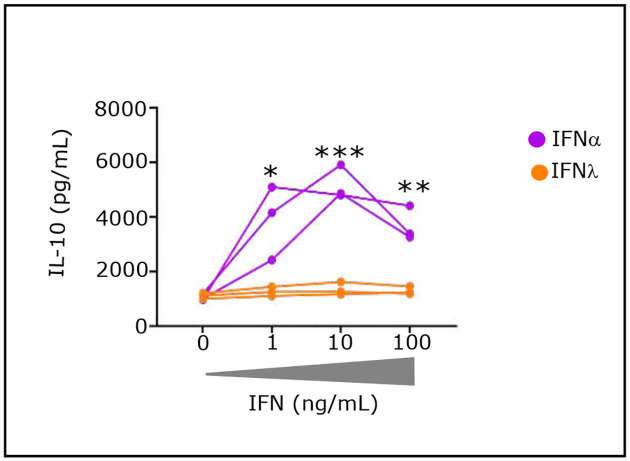
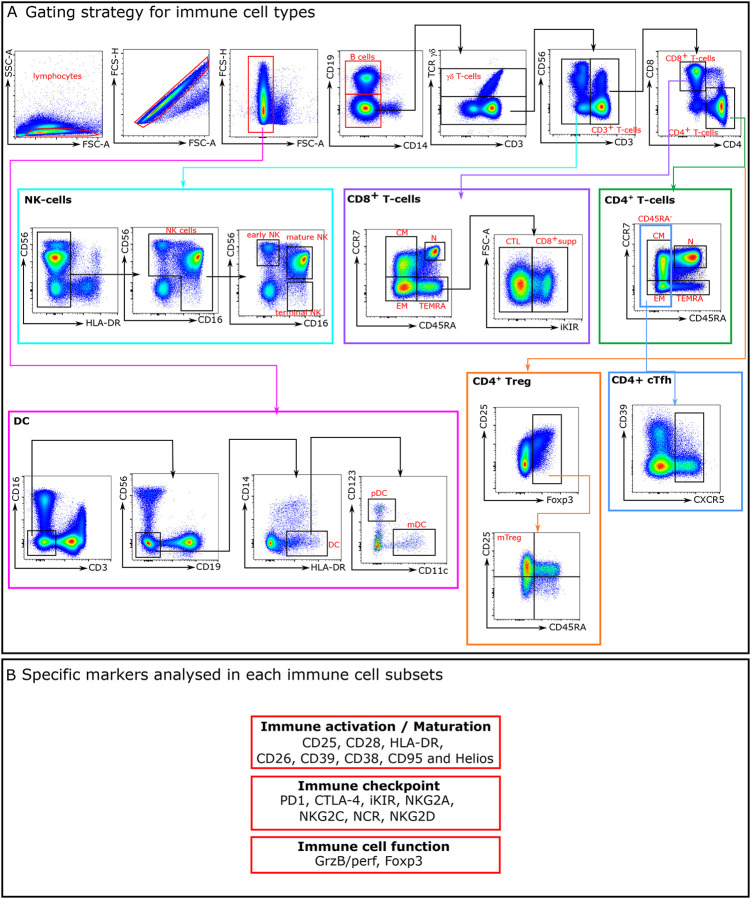
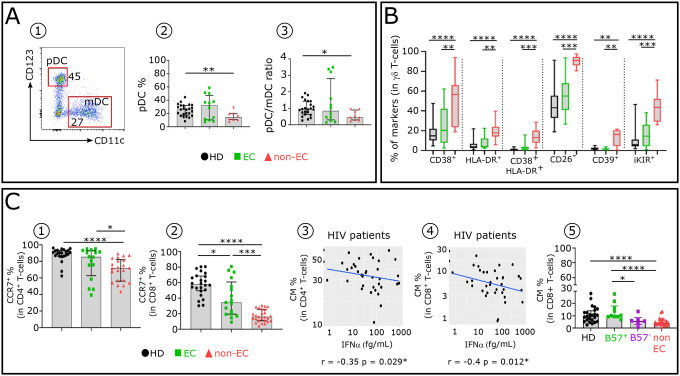
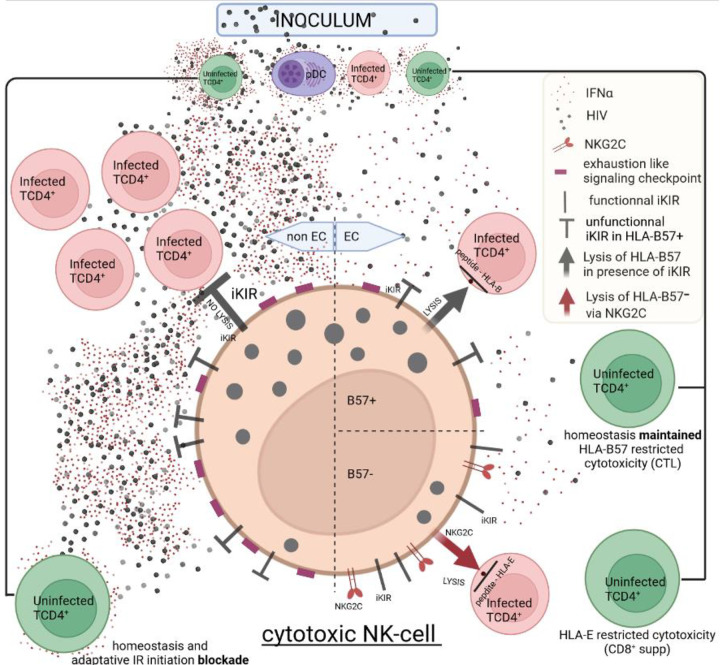
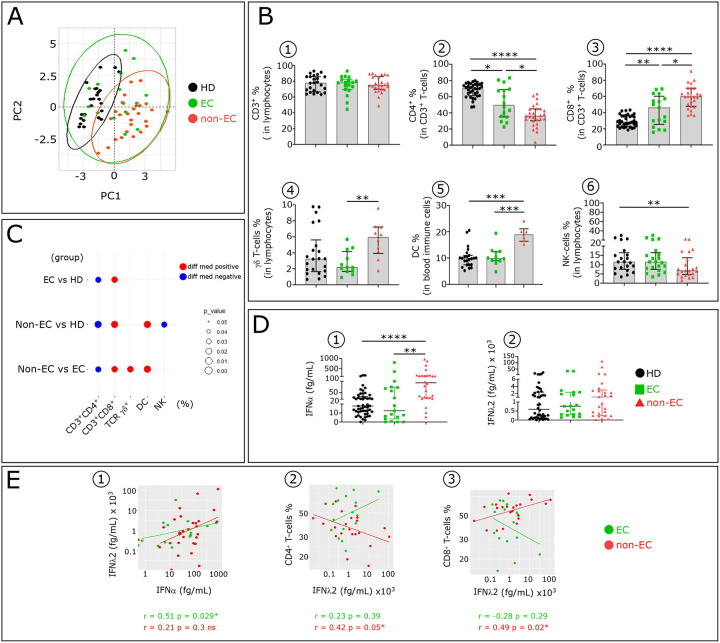
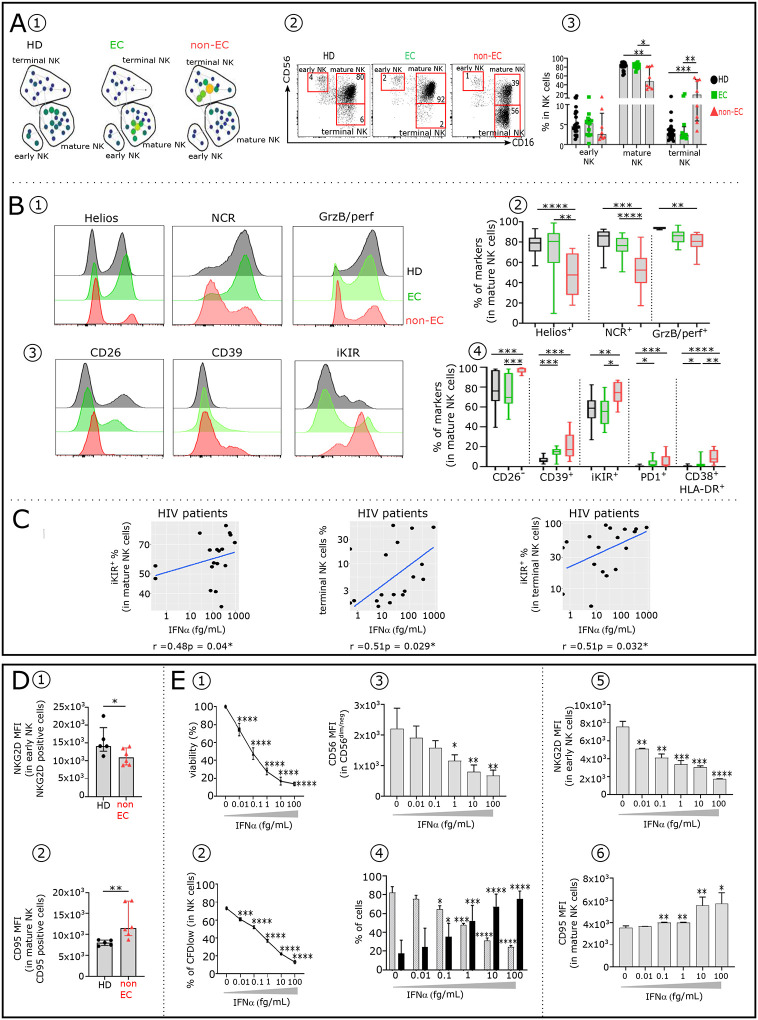
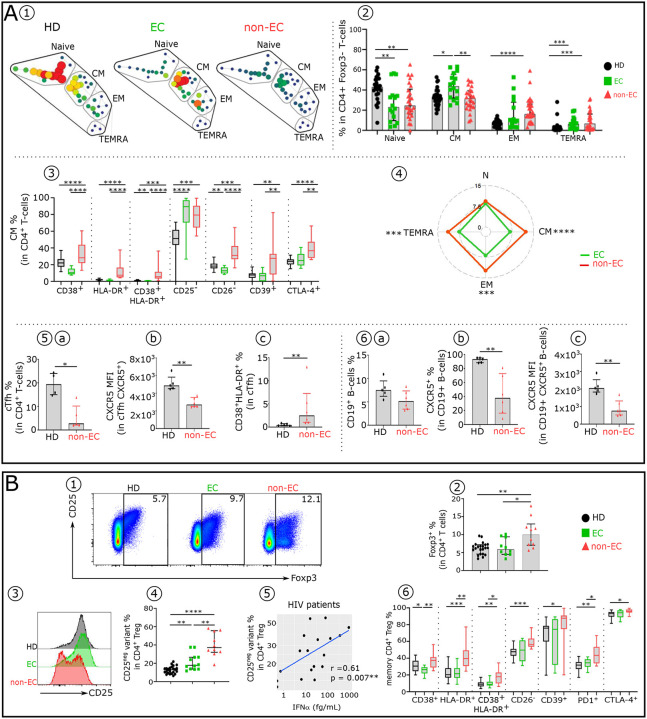
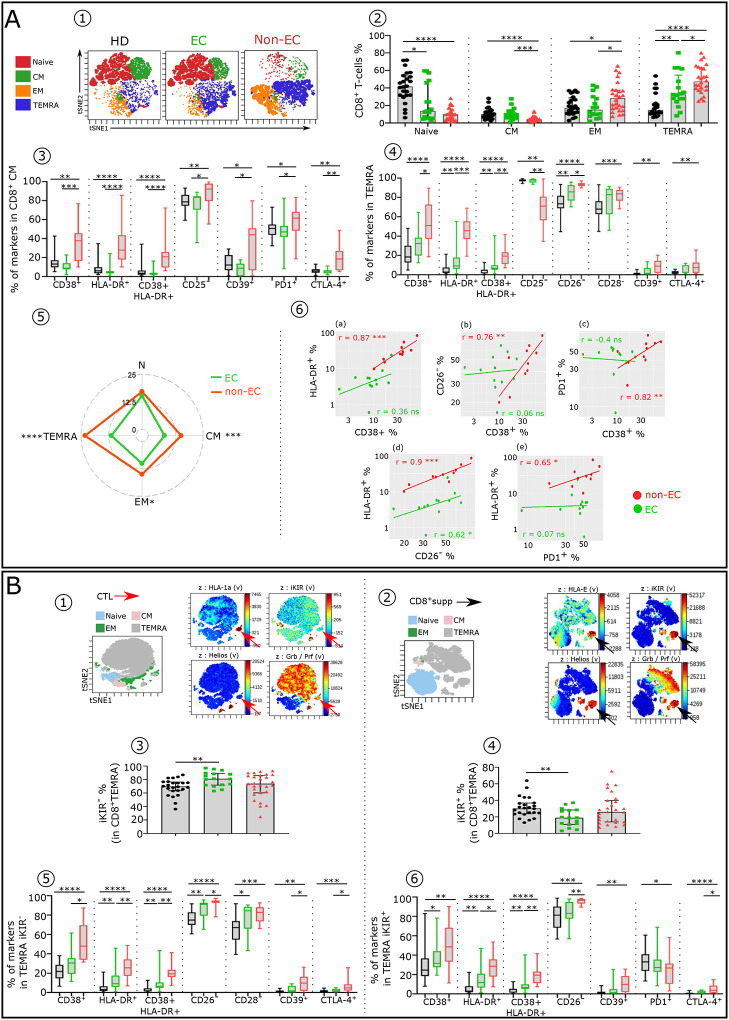
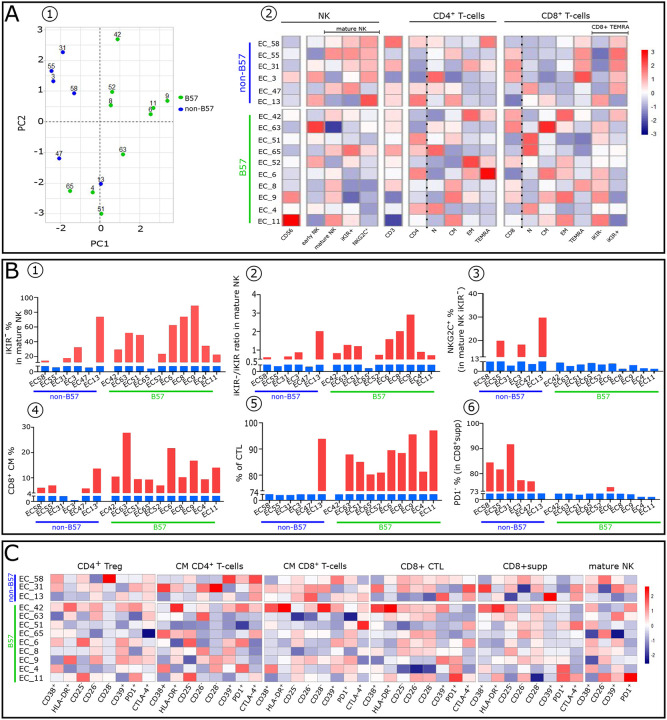
Advances in HIV therapy came from understanding its replication. Further progress toward "functional cure" -no therapy needed as found in Elite Controllers (EC)- may come from insights in pathogenesis and avoidance by EC. Here we show that all immune cells from HIV-infected persons are impaired in non-EC, but not in EC. Since HIV infects few cell types, these results suggest an additional mediator of pathogenesis. We identify that mediator as elevated pathogenic IFNα, controlled by EC likely by their preserved potent NK-cells and later by other killer cells. Since the earliest days of infection predict outcome genetic or chance events must be key to EC, and since we found no unique immune parameter at the onset, we suggest a chance infection with a lower HIV inoculum. These results offer an additional approach toward functional cure: a judicious targeting of IFNα for all non-EC patients.


Figures

Extended data Fig. 1:
Extended data Fig. 1:. Effect of IFNα and IFNλ2 on stimulated CD4+T-cells from HD.
CD4+T-cells (1.5 × 10⁵ per well) were stimulated with platebound anti-CD3 mAb (pbαCD3) (4 μg/mL) in presence of soluble anti-CD28 mAb (sαCD28) (4 μg/mL) and IL-2 (100 IU/mL) for 4 days. (A1) Representative FACS histograms displaying IFNα effect on CD4+T-cell proliferation measured by CFD dilution assay. (A2) Histograms showing dose–effect of IFNα and IFNλ2 on the frequency of CFDlow cells (n=4). (A1) Representative FACS histograms displaying IFNα effect on apoptosis of 4 d-stimulated CD4+T-cells evaluated by 7-amino-actinomycin D (7-AAD) staining. (B2) Histograms showing dose–effect of IFNα and IFNλ2 on the frequency of 7-AAD+ cells (n=4). (C1) Representative FACS histograms displaying IFNα effect on CD38 expression on 4 d-stimulated CD4+T-cells. Histograms showing the IFNα and IFNλ2 dose–effect on (C2) the CD38 frequency and (C3) the CD38 Mean Fluorescence Intensity (MFI) in CD4+ T cells (n=4). (C4) Representative FACS histograms displaying IFNα effect on CD25 expression on 4 d-stimulated CD4+T-cells. Histograms showing the IFNα and IFNλ2 dose–effect on (C5) the CD25 frequency and (C6) the CD25 MFI in CD4+T-cells (n=4).
Extended data Fig. 2:
Extended data Fig. 2:. Effect of IFNα and IFNλ2 on the IL-10 secretion by stimulated CD4+T-cells from HD.
CD4+T-cells (1.5 × 10⁵ per well) were stimulated with pbαCD3 (4 μg/mL) in presence of soluble sαCD28 (4 μg/mL) and IL-2 (100 IU/mL) for 4 days. IL-10 levels were quantified by Luminex technology in the 4-d culture supernatant of stimulated CD4+T-cells (n=3).
Extended data Fig. 3:
Extended data Fig. 3:. Gating strategy for immune cell types and specific markers analysed in each immune cell subsets.
A- Gating strategy for immune cell types. The gating strategy used to identify the main cellular subsets is presented. Arrows are used to visualize the relationships across plots, and numbers are used to call attention to populations described here. After doublets and dead cells were excluded, lymphocytes were gated based on FSC-A/SSC-A properties. From the CD14CD19 lymphocyte gate, the following populations were identified: CD3+TCRγδ+, TCRγδ were subdivided in CD3 and CD3+T-cells. NK-cells were defined as CD3−TCRγδ−HLA-DR− and classified as early NK (CD56+CD16−), mature NK (CD56+CD16+), and terminal NK (CD56−CD16+) cells. The CD3+TCRγδ− population was divided in CD4+ and CD8+ T-cells. In CD4+T-cells subpopulation, CCR7+ and CD45RA+ were used to further classify these cells in four subpopulations: N (CCR7+CD45RA+), CM (CCR7+CD45RA), EM (CCR7CD45RA) and TEMRA (CCR7CD45RA+). Tregs were identified from the CD4+ population using Foxp3 expression. Foxp3+ cells were classified in naïve and memory Treg cells using CD45RA and CD25 markers. CD45RACD25+ represent the memory Treg cells population. As for CD4+T_cells, CD8+T_cells were classified using CD45RA and CCR7 markers: four populations were identified: N (CCR7+CD45RA+), CM (CCR7+CD45RA), EM (CCR7CD45RA) and TEMRA (CCR7CD45RA+). Among TEMRA CD8+T-cells, we distinguished two cytotoxic subpopulations: iKIR+ (CD8+supp) and iKIR (CTL). Dendritic cells (DCs) were identified by gating on CD3CD19CD56CD14HLADR+ and from there CD123+CD11c (pDCs) and CD11c+CD123 mDCs were identified. B- Specific markers analysed in each immune cell subsets.
Extended data Fig. 4:
Extended data Fig. 4:. Immune cell types of non-EC but not of EC involved in the innate phase of an anti-HIV IR exhibit distinct altered pattern linked to elevated IFNα.
(A) Representative dot plot showing how to distinguish pDC (CD123+CD11c) and mDC (CD123CD11C+) subsets within the HLA-DR+lin population in HD (A1). Histograms showing the frequencies of pDC (A2) and the pDC:mDC ratio (A3) across the groups (HD n=22, EC n=12 and non-EC n=8). (B) Specific markers proportion on TCR γδ T-cells of each studied group (HD n=22, EC n=12 and non-EC n=8). (C) Histograms showing the frequencies of CCR7 in CD4+ (C1) and CD8+ (C2) T-cells across the groups (HD n=22, EC n=12 and non-EC n=26). Scatterplots showing relationships between the frequencies of CD4+CM (C3) and CD8+CM (C4) T-cells with IFNα levels in HIV-1-infected patients. (C5) Histograms showing the frequencies of CD8+CM in HD (n=22), HLA-B57+ EC (n=10), HLA-B57 EC (n=6) and non-EC (n=26). Significance was determined by unpaired Mann-Whitney U test. *P<0.05, **P<0.01, ***P<0.001, ****P<0.0001.
Extended data Fig. 5:
Extended data Fig. 5:. Frequency and phenotypic alterations of CD4+T-cell subsets in non-EC and EC
Boxplots showing the expression of indicated marker in CD4+Naïve (a), EM (b) and TEMRA (c) across the groups (HD n=22, EC n=12 and non-EC n=8). (d) Radar chart showing a composite score of phenotypic cell alteration calculated for each CD4+Tconv subpopulation in non-EC and EC (see Methods). (e) Scatterplots showing relationships between the expression level of indicated markers in the CD4+CM subsets (EC n=12 and non-EC n=8). Correlations were evaluated with Spearman’s rank correlation test. Significance was determined by unpaired Mann-Whitney U test. *P<0.05, **P<0.01, ***P<0.001, ****P<0.0001.
Extended data Fig. 6:
Extended data Fig. 6:. Frequency of CTL and CD8+supp in EC-B57+, EC-B57, non-EC and HD.
Histograms showing distributions of CTL and CD8+supp between HD (Black, n=24), EC-B57+ (green, n=10), EC-B57 (purple and blue, n=6) and non-EC (red, n=26). One EC-B57 (EC13) in blue behaves as an EC-B57+. Significance was determined by unpaired Mann-Whitney U test. *P<0.05, **P<0.01, ***P<0.001, ****P<0.0001.
Extended data Fig. 7:
Extended data Fig. 7:. NK-cell cytotoxic activity varies in HIV-infected patients according to their status.
1-Left: in non-EC, NK-cells are inactive given the high frequency of their inhibitory checkpoints leading to a state of exhaustion in large part induced by IFNα. 2-Right and up: in HLA-B57+ EC NK-cells, which possess negligible iKIR and further express negligible inhibitory receptors, lyse infected target cells expressing HLA-B restricted HIV-peptides. 3-Right and down: in HLA-B57 EC NK-cells, which express iKIR, but have negligible inhibitory checkpoints, express the activating NKG2C receptor, counterbalancing the iKIR signaling, and can thereby kill infected cells carrying HIV-peptides in an HLA-E restriction. Figure created with Biorender.
Figure 1:
Figure 1:. Comparative analysis of major blood immune cell subsets and serum IFNα and IFNλ2 concentration in non-EC, EC and HD.
(A) Principal component analysis (PCA) of studied participants based on the proportion of different immune cell subpopulations (CD4+, CD8+ and TCR γδ T-cells, NK and DC), evaluated by flow cytometry. Immune cell profiling was assessed by flow cytometry as depicted in extended data Fig. 3. The first two Principal components (PC1 and PC2) explaining the greatest differences among individuals are represented on a bi-plot. Each point represents one participant, colored by the group they belong to. Each group is outlined by an ellipse representing the 95% confidence interval of the sample groupings. (B) Histograms showing distributions of indicated immune cell populations between HD (Black, n=24), EC (green, n=16), and non-EC (red, n=26). (C) Balloon-plot summarizing the statistically significant changes in the indicated immune cell populations between EC and HD, non-EC and HD and non-EC and EC. The size of the circle represents the p-value. Red and blue colors show increased or decreased frequencies of the immune cell populations. (D) Scatterplots showing IFNα and IFNλ2 concentration in serum from HD (n=51), EC (n=18) and non-EC (n=26). IFNα and IFNλ2 levels were detected by SIMOA. (E) Scatterplot showing relationships between IFNα and IFNλ2 serum levels (E1), CD4+T-cells and IFNλ2 (E2), and CD8+T-cells and IFNλ2 (E3) in EC (n=18) and non-EC (n=26). Correlations were evaluated with Spearman’s rank correlation test. Differences between unpaired samples were performed with Mann-Whitney test. Graph show the median values and p values (*P<0.05, **P<0.01, ***P<0.001, ****P<0.0001)
Figure 2:
Figure 2:. Comparative distribution and immune phenotypic analysis of innate immune NK-cells in HD, EC and non-EC.
(A1) SPADE tree showing the distribution of the three main NK-cell subsets in HD, EC and non-EC, based on CD56 and CD16 expression levels. Nodes are colored by count. (A2) Representative Flow Cytometry plots of NK-cell subsets gated on CD19CD14TCRγδCD3HLA-DR cells from the 3 studied groups: early NK (CD56bright/CD16), mature NK (CD56dim/CD16+) and terminal NK (CD56CD16+). (A3) Frequency of early, mature and terminal NK in each studied group (HD n=22, EC n=12 and non-EC n=8). Profiles displaying the expression level of Helios, NCR (NKp30, NKp44, NKp46), GrzB/perf (B1) and CD26, CD39, iKIR (B3) on mature NK-cells from HD (black), EC (green) and non-EC (red). (B2 and B4) Box plots displaying the frequency of the indicated markers in mature NK-cells in each studied group. (C) Scatterplots showing relationships between IFNα serum level and the frequencies of selected NK-cell subsets. Correlations were evaluated with Spearman’s rank correlation test. Histograms showing the expression level (measured by median fluorescence intensity (MFI) of NKGD2 in early NK-cells (D1) and CD95 in mature NK-cells (D2) in non-EC (n=6) and HD (n=5). Percentage of viable NK-cells (E1) and frequency of CFDlow NK-cells (E2) after 7 days of culture in presence of increasing doses of IFNα. Histograms showing the expression level of CD56 in CD56dim/neg NK-cells (E3), distribution of mature (grey) and terminal NK-cells (black) (E4), expression levels of NKG2D in early NK-cells (E5) and CD95 in mature NK-cells (E6) after 3 days of culture in presence of IFNα. Significance was determined by unpaired Mann-Whitney U test. *P<0.05, **P<0.01, ***P<0.001, ****P<0.0001.
Figure 3:
Figure 3:. Comparative immune phenotypic analysis of (A) CD4+Tconv, CD19+B-cells and (B) CD4+Treg in non-EC, EC, and HD.
(A1) SPADE tree showing the distribution of CD4+Tconv subsets in HD, EC and non-EC. Nodes are colored by count. CD4+Tconv can be classified into four major subsets by their expression of CD45RA and the chemokine receptor CCR7: naïve (CCR7+CD45RA+); CM (CCR7+CD45RA), EM (CCR7CD45RA) and TEMRA (CCR7CD45RA+). (A2) Frequency of Naïve, CM, EM and TEMRA in each studied group (HD n=24, EC n=16 and non-EC n=23). Boxplots showing the expression of indicated marker in CD4+ CM (A3) across the groups (HD n=22, EC n=12 and non-EC n=8). (A4) Radar chart showing a composite score of phenotypic cell alteration calculated for each CD4+Tconv subpopulation in non-EC and EC (see Methods). Frequency of cTfh (A5a), expression levels of CXCR5 in cTfh (A5b) and frequency of cTfh co-expressing CD38 and HLADR (A5c) in non-EC (n=6) and HD (n=5). Proportion of CD19+ B-cells (A6a), frequency (A6b) and expression level (A6c) of CXCR5 in CD19+B-cells in non-EC (n=6) and HD (n=5). (B1) Representative flow cytometry plots of CD25+Foxp3+ cells within CD4+T-cells isolated from HD, EC and non-EC. (B2) Histograms showing the frequency of Foxp3 in CD4+T-cells, (B3) histograms displaying the CD25 expression level in CD4+ Foxp3+T-cells and (B4) the Treg CD25 variant frequency in CD4+Foxp3 T-cells in each studied group. (B5) Scatterplots showing relationships between frequency of Treg CD25 variant in HIV-infected patients and serum IFNα levels. (B6) Proportion of specific functional signaling checkpoint on memory CD4+ Treg (CD4+ Foxp3+CD25+CD45RA) of each studied group (HD n=22, EC n=12 and non-EC n=8). Correlations were evaluated using Spearman’s rank correlation test. Significance was determined by unpaired Mann-Whitney U test. *P<0.05, **P<0.01, ***P<0.001, ****P<0.0001.
Figure 4:
Figure 4:. Comparative immune phenotypic analysis of CD8+T-cell subsets in non-EC, EC and HD.
(A1) Representative viSNE plot showing the distribution CD8+T-cell subsets, as described above for CD4+Tconv in HD, EC, and non-EC. (A2) Histograms showing the frequency of Naïve, CM, EM and TEMRA CD8+T-cells subsets in each studied group (HD n=24, EC n=16 and non-EC n=23). Boxplots showing the expression of indicated marker in CD8+CM (A3) and TEMRA (A4) across the groups (HD n=22, EC n=12 and non-EC n=8). (A5) Radar chart showing a composite score of phenotypic cell alteration calculated for each CD8+T-cell subpopulations in EC and non-EC (EC n=12 and non-EC n=8). (A6) Scatterplots showing relationships between the expression level of indicated markers in CD8+CM (EC n=12 and non-EC n=8). (B) ViSNE plot depicting the phenotypic difference between CD8+CTL (TEMRA iKIR) (B1) and CD8+supp (TEMRA iKIR+) (B2). tSNE plot of CD8+T-cell subsets showed in different colors and viSNE projections of expression of indicated markers are shown. Red and black arrows indicate HLA-1a restricted and HLA-E-restricted CD8+supp respectively. Histograms showing the frequency of CD8+TEMRA iKIR (B3) and TEMRA iKIR+ (B4) in each studied group (HD n=24, EC n=16 and non-EC n=26). Box plots showing the proportion of specific markers on CD8+TEMRA iKIR (B5) and TEMRA iKIR+ (B6) in each studied group (HD n=22, EC n=12 and non-EC n=8). Correlations were evaluated using Spearman’s rank correlation test. Significance was determined by unpaired Mann-Whitney U test. *P<0.05, **P<0.01, ***P<0.001, ****P<0.0001.
Figure 5:
Figure 5:. Distinct immune cells phenotypic patterns between non-B57 and B57 EC with a peculiar profile displayed by each patient of these subgroups.
(A1) PCA scatterplots of CD8+T-cell subpopulations frequencies for non-B57 (ECB57−) and B57 (ECB57+) EC (shown as blue and green dots respectively). (A2) Heatmaps representing the distribution of the indicated lymphocytes subsets in EC. Histograms showing frequency and index ratio of indicated subsets in mature NK (B1–3) and CD8+T-cell compartment (B4–6). (C) Heatmaps showing the frequency of indicated markers in CD4+ Treg, CD4+CM, CD8+CM, CD8+CTL, CD8+supp and mature NK-cells.

Similar articles

References

    1. Deeks S. G. & Walker B. D. Human Immunodeficiency Virus Controllers: Mechanisms of Durable Virus Control in the Absence of Antiretroviral Therapy. Immunity 27, 406–416 (2007). - PubMed
    1. Jiang C. et al. Distinct viral reservoirs in individuals with spontaneous control of HIV-1. Nature 585, 261–267 (2020). - PMC - PubMed
    1. Martin M. P. et al. Innate partnership of HLA-B and KIR3DL1 subtypes against HIV-1. Nat. Genet. 39, 733–740 (2007). - PMC - PubMed
    1. Migueles S. A. et al. HLA B*5701 is highly associated with restriction of virus replication in a subgroup of HIV-infected long term nonprogressors. Proc. Natl. Acad. Sci. 97, 2709–2714 (2000). - PMC - PubMed
    1. Zagury D. et al. Interferon alpha and Tat involvement in the immunosuppression of uninfected T cells and C-C chemokine decline in AIDS. Proc. Natl. Acad. Sci. U. S. A. 95, 3851–3856 (1998). - PMC - PubMed

Publication types