. 2023 May 4:11:1125015.
doi: 10.3389/fcell.2023.1125015. eCollection 2023.

The dynamical organization of the core pluripotency transcription factors responds to differentiation cues in early S-phase

Affiliations

The dynamical organization of the core pluripotency transcription factors responds to differentiation cues in early S-phase

Camila Oses et al. Front Cell Dev Biol. .

Abstract

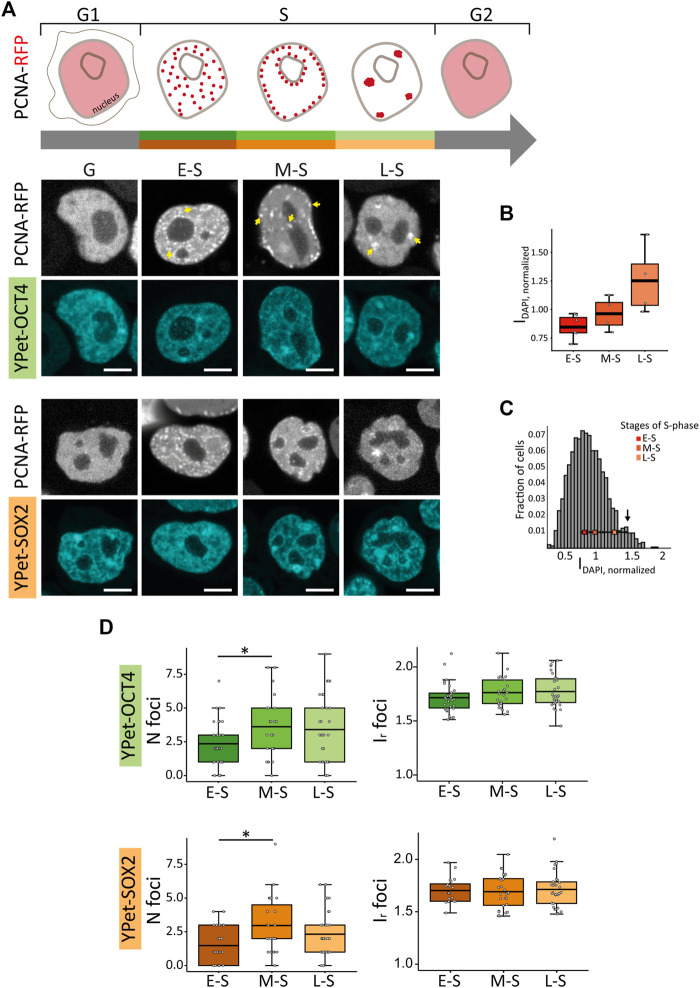
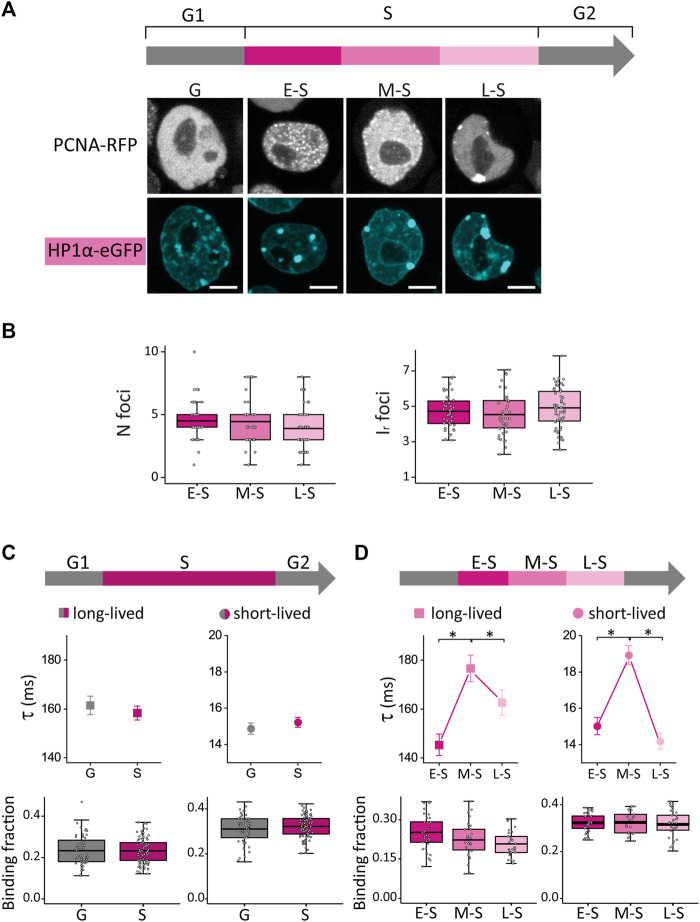
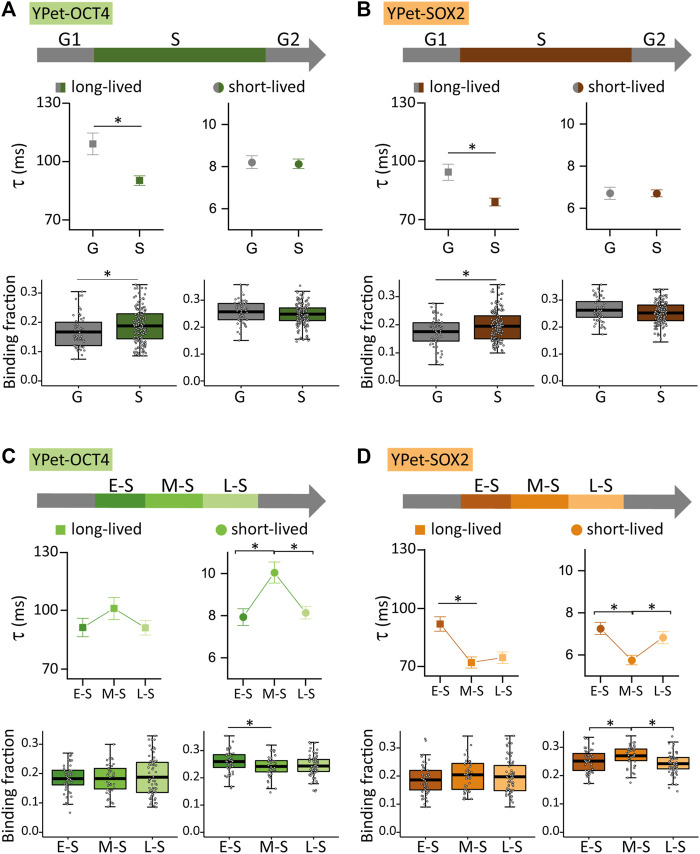
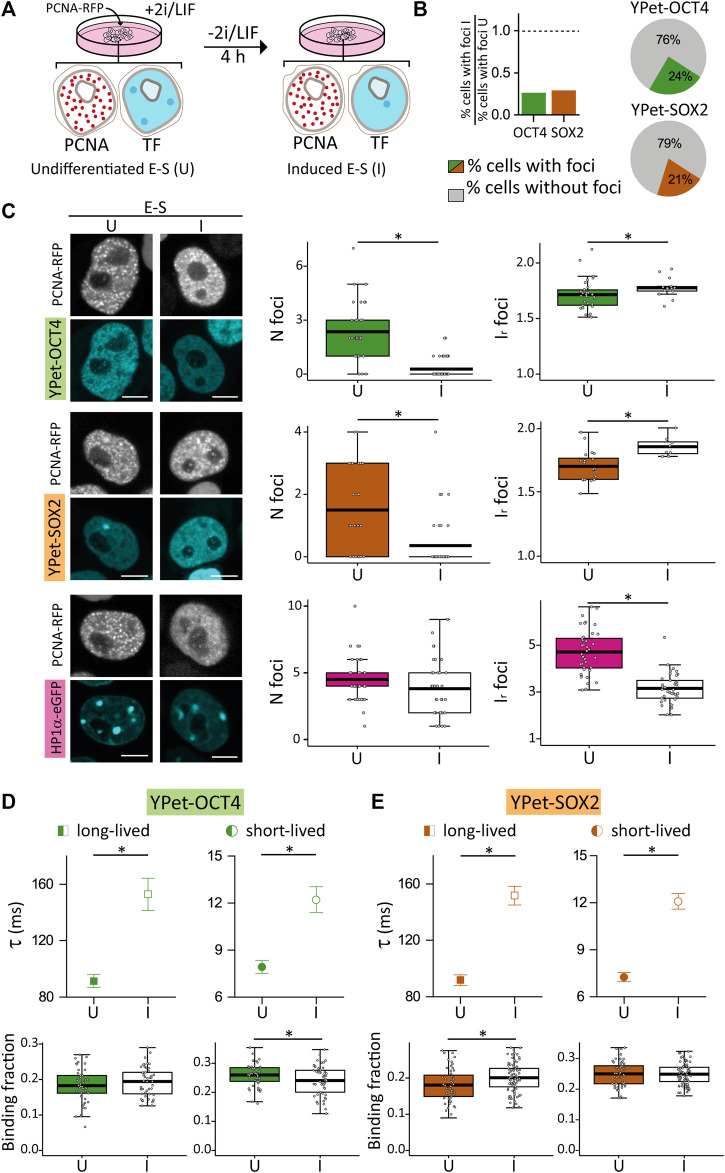
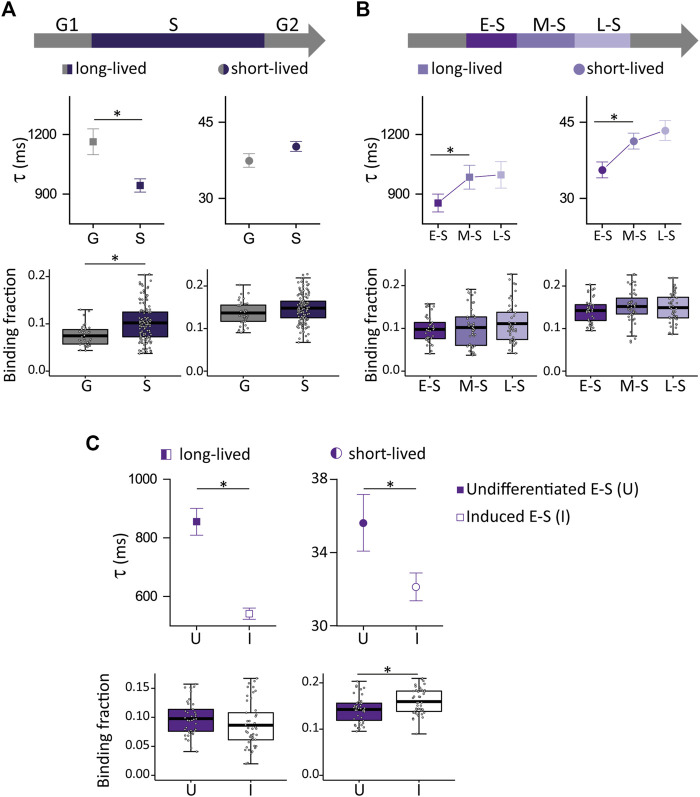
DNA replication in stem cells is a major challenge for pluripotency preservation and cell fate decisions. This process involves massive changes in the chromatin architecture and the reorganization of many transcription-related molecules in different spatial and temporal scales. Pluripotency is controlled by the master transcription factors (TFs) OCT4, SOX2 and NANOG that partition into condensates in the nucleus of embryonic stem cells. These condensates are proposed to play relevant roles in the regulation of gene expression and the maintenance of pluripotency. Here, we asked whether the dynamical distribution of the pluripotency TFs changes during the cell cycle, particularly during DNA replication. Since the S phase is considered to be a window of opportunity for cell fate decisions, we explored if differentiation cues in G1 phase trigger changes in the distribution of these TFs during the subsequent S phase. Our results show a spatial redistribution of TFs condensates during DNA replication which was not directly related to chromatin compaction. Additionally, fluorescence fluctuation spectroscopy revealed TF-specific, subtle changes in the landscape of TF-chromatin interactions, consistent with their particularities as key players of the pluripotency network. Moreover, we found that differentiation stimuli in the preceding G1 phase triggered a relatively fast and massive reorganization of pluripotency TFs in early-S phase. Particularly, OCT4 and SOX2 condensates dissolved whereas the lifetimes of TF-chromatin interactions increased suggesting that the reorganization of condensates is accompanied with a change in the landscape of TF-chromatin interactions. Notably, NANOG showed impaired interactions with chromatin in stimulated early-S cells in line with its role as naïve pluripotency TF. Together, these findings provide new insights into the regulation of the core pluripotency TFs during DNA replication of embryonic stem cells and highlight their different roles at early differentiation stages.

Keywords: DNA replication; cell cycle; condensates; differentiation; embryonic stem cells; pluripotency transcription factors.


Conflict of interest statement

The authors declare that the research was conducted in the absence of any commercial or financial relationships that could be construed as a potential conflict of interest.

Figures

FIGURE 1
FIGURE 1
PCNA, SOX2 and OCT4 distribution in undifferentiated ESCs in G, E-S, M-S or L-S phases. (A) The cartoon represents PCNA distribution in these phases. Representative images of YPet-OCT4 and YPet-SOX2 ESCs transfected with a vector encoding PCNA-RFP in the different phases (G: G1 and G2). Arrows point to the characteristic foci observed in each phase. Scale bar: 5 µm. (B) DAPI normalized integrated intensity (IDAPI, normalized) for the E-S, M-S and L-S cells (dark to light red) classified according to PCNA distribution represented in boxplots; the thick, black lines represent mean values. (C) Intensity distribution of DAPI in ESCs (n cells = 1,362). The peak at 1.4 (arrow) probably corresponds to G2 cells and consequently, the region of the histogram with lower intensities than those of E-S cells probably includes cells in G1. The mean IDAPI, normalized ± standard error determined in E-S, M-S and L-S cells (dark to light red) are plotted overlapped to the histogram. (D) Mean values of number of foci per cell (N foci, left) and relative foci intensity (Ir foci, right) for YPet-OCT4 (top, green) and YPet-SOX2 (bottom, orange) determined in E-S, M-S and L-S cells (dark to light). The thick, black lines in boxplots represent the mean values. *p-value < 0.05. Number of analyzed cells: YPet-OCT4: 34 (E-S), 26 (M-S), 33 (L-S); YPet-SOX2: 30 (E-S), 27 (M-S), 35 (L-S).
FIGURE 2
FIGURE 2
HP1α distribution and dynamics in undifferentiated ESCs in G, E-S, M-S or L-S phases. (A) ESCs were co-transfected with PCNA-RFP and HP1α-eGFP. Representative images of cells in G, E-S, M-S or L-S. Scale bar: 5 µm. (B) Mean values of N foci (left) and Ir foci (right) for HP1α-eGFP in cells in E-S, M-S and L-S (dark to light) phases. (C) HP1α-eGFP long-lived (left, squares) and short-lived (right, circles) binding times and the corresponding fractions were obtained from ACF curves during G (gray) and S (pink) phases or (D) during the different stages of S phase: E-S, M-S and L-S (dark to light pink). The thick, black lines in boxplots represent the mean values. *p-value < 0.05. Number of analyzed cells: 40 (E-S), 41 (M-S), and 57 (L-S); and FCS data: 58 (G), 35 (E-S), 27 (M-S) and 33 (L-S).
FIGURE 3
FIGURE 3
YPet-OCT4 and YPet-SOX2 dynamics during the cell cycle of ESCs. (A) YPet-OCT4 and (B) YPet-SOX2 long-lived (left, squares) and short-lived (right, circles) binding times (top) and the corresponding fractions (bottom) obtained from ACF curves during G (gray) or S (color) phases. (C) YPet-OCT4 and (D) YPet-SOX2 long-lived (left, squares) and short-lived (right, circles) binding times (top) and the corresponding fractions (bottom) obtained from ACF curves during E-S, M-S or L-S (dark to light) phases. The thick, black lines in boxplots represent the mean values. *p-value < 0.05. Number of FCS data for YPet-OCT4: 53 (G), 47 (E-S), 42 (M-S) and 68 (L-S); and for YPet-SOX2: 56 (G), 60 (E-S), 46 (M-S) and 63 (L-S).
FIGURE 4
FIGURE 4
Distribution and dynamics of HP1α-eGFP, YPet-OCT4 and YPet-SOX2 in undifferentiated E-S cells or after 4 h of induction of differentiation. (A) Cartoon schematizing the experimental procedure. (B) Proportion of cells with at least one focus in induced E-S cells (I) relative to that of undifferentiated E-S cells (U). Pie charts showing the proportion of induced E-S cells without foci (gray) or with at least one focus (YPet-OCT4 or YPet-SOX, green and orange, respectively). (C) Representative images of undifferentiated and induced E-S cells expressing YPet-OCT4 (top), YPet-SOX2 (middle) and HP1α-eGFP (bottom) and mean values of N foci (left) and Ir foci (right) (filled and empty symbols for U and I cells, respectively). Scale bar: 5 µm. (D,E) long-lived (squares) and short-lived (circles) binding times and the corresponding fractions obtained from ACF data collected in undifferentiated (filled symbols) or induced (empty symbols) E-S cells expressing (D) YPet-OCT4 or (E) YPet-SOX2. The thick, black lines in boxplots represent the mean values. *p-value < 0.05. Number of induced E-S cells analyzed: 58 (YPet-OCT4), 39 (YPet-SOX2), 37 (HP1α-eGFP); and FCS data: 52 (YPet-OCT4), 77 (YPet-SOX2).
FIGURE 5
FIGURE 5
NANOG-GFP dynamics during the cell cycle of undifferentiated ESCs and in induced E-S cells. (A,B) NANOG-eGFP long-lived (left, squares) and short-lived (right, circles) binding times (top) and the corresponding fractions (bottom) obtained from ACF curves during (A) G (gray) or S (purple) phases or (B) during E-S, M-S or L-S (dark to light) phases. (C) long-lived (squares) and short-lived (circles) binding times and the corresponding fractions were obtained from ACF data collected in undifferentiated (filled symbols) or induced (empty symbols) E-S cells. The thick, black lines in boxplots represent the mean values. *p-value < 0.05. Number of FCS data: 41 (G), 43 (E-S), 47 (M-S), 69 (L-S), and 45 (induced E-S).

Similar articles

Cited by

References

    1. Azuara V., Perry P., Sauer S., Spivakov M., Jorgensen H. F., John R. M., et al. (2006). Chromatin signatures of pluripotent cell lines. Nat. Cell Biol. 8, 532–538. 10.1038/ncb1403 - DOI - PubMed
    1. Barr A. R., Heldt F. S., Zhang T., Bakal C., Novak B. (2016). A dynamical Framework for the all-or-none G1/S transition. Cell Syst. 2, 27–37. 10.1016/j.cels.2016.01.001 - DOI - PMC - PubMed
    1. Becker K. A., Ghule P. N., Therrien J. A., Lian J. B., Stein J. L., van Wijnen A. J., et al. (2006). Self-renewal of human embryonic stem cells is supported by a shortened G1 cell cycle phase. J. Cell Physiol. 209, 883–893. 10.1002/jcp.20776 - DOI - PubMed
    1. Boehm E. M., Gildenberg M. S., Washington M. T. (2016). The many roles of PCNA in eukaryotic DNA replication. Enzymes 39, 231–254. 10.1016/bs.enz.2016.03.003 - DOI - PMC - PubMed
    1. Boija A., Klein I. A., Sabari B. R., Dall'Agnese A., Coffey E. L., Zamudio A. V., et al. (2018). Transcription factors activate genes through the phase-separation capacity of their activation domains. Cell 175, 1842–1855. 10.1016/j.cell.2018.10.042 - DOI - PMC - PubMed