. 2023 Apr 4:11:1123299.
doi: 10.3389/fcell.2023.1123299. eCollection 2023.

Cartilage regeneration in zebrafish depends on Nrg1/ErbB signaling pathway

Affiliations

Cartilage regeneration in zebrafish depends on Nrg1/ErbB signaling pathway

Dora Sapède et al. Front Cell Dev Biol. .

Abstract

Objective: Cartilage, as the majority of adult mammalian tissues, has limited regeneration capacity. Cartilage degradation consecutive to joint injury or aging then leads to irreversible joint damage and diseases. In contrast, several vertebrate species such as the zebrafish have the remarkable capacity to spontaneously regenerate skeletal structures after severe injuries. The objective of our study was to test the regenerative capacity of Meckel's cartilage (MC) upon mechanical injury in zebrafish and to identify the mechanisms underlying this process. Methods and Results: Cartilage regenerative capacity in zebrafish larvae was investigated after mechanical injuries of the lower jaw MC in TgBAC(col2a1a:mCherry), to visualize the loss and recovery of cartilage. Confocal analysis revealed the formation of new chondrocytes and complete regeneration of MC at 14 days post-injury (dpi) via chondrocyte cell cycle re-entry and proliferation of pre-existing MC chondrocytes near the wound. Through expression analyses, we showed an increase of nrg1 expression in the regenerating lower jaw, which also expresses Nrg1 receptors, ErbB3 and ErbB2. Pharmacological inhibition of the ErbB pathway and specific knockdown of Nrg1 affected MC regeneration indicating the pivotal role of this pathway for cartilage regeneration. Finally, addition of exogenous NRG1 in an in vitro model of osteoarthritic (OA)-like chondrocytes induced by IL1β suggests that Nrg1/ErbB pathway is functional in mammalian chondrocytes and alleviates the increased expression of catabolic markers characteristic of OA-like chondrocytes. Conclusion: Our results show that the Nrg1/ErbB pathway is required for spontaneous cartilage regeneration in zebrafish and is of interest to design new therapeutic approaches to promote cartilage regeneration in mammals.

Keywords: cartilage; chrondrocytes; neuregulin 1; osteoarthritis; regeneration.


Conflict of interest statement

The authors declare that the research was conducted in the absence of any commercial or financial relationships that could be construed as a potential conflict of interest.

Figures
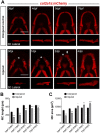
FIGURE 1
FIGURE 1
Regrowth of the Meckel’s cartilage (MC) following mechanical injury of the lower jaw in Tg(col2a1:mCherry) line (A) Confocal analysis of the normal growth of MC between 3 and 7 dpf (upper panel) and formation of new chondrocytes (lower panel) at equivalent stages after surgical amputation of the anterior half of the MC at 3 dpf. The upper row of each panel are maximal projections of z-stacks in ventral views, whereas the lower rows are 3D reconstructions corresponding to each ventral view, oriented in lateral views of the MC. The asterisk marks the amputated anterior part of MC and the white dotted line indicates the site of amputation. Note that a group of new chondrocytes are visible at the tip of the cut MC at 2 dpi (white arrow). (B) Time course of MC elongation after injury and comparison with normal growth in age-matched controls from 3 to 7 dpf. (C) Time course of MC area increase after injury and comparison with normal growth in age-matched controls from 3 to 7 dpf. Scale bar: 100 µm. Graphs indicate the means ± SEM. N = 10 individuals minimum were analyzed for each condition. Mann-Whitney test was used to compare the length and area in injured and uninjured individuals. *: p < 0.05; **: p < 0.01; ***: p < 0.001; ****: p < 0.0001.
FIGURE 2
FIGURE 2
Late observations of MC at 14 and 26 dpi indicate full regeneration of injured cartilage (A, B) Confocal maximal projections of z-stacks in ventral views and corresponding lateral 3D reconstructions of the uninjured (A) and injured (B) MC at 17 dpf (14 dpi). (C, D) 3D reconstructions of the distal tip of the uninjured (C) and injured (D) MC at 11 dpf (8 dpi) and 17 dpf (14 dpi). The yellow asterisks mark the absence of col2a1:mCherry expression at the level of the central cells of the distal tip until late stages of development in uninjured controls. Note the absence of col2a1 fluorescence in the central cells prefiguring the mandibular symphysis, whereas the regenerated MC harbors a continuum of cells expressing col2a1 at 8 dpi. Later on, central cells at the tip had lost col2a expression at 14 dpi. (E, F) 3D reconstructions of the distal tip of the uninjured (C) and injured (D) MC at 6 dpf (3 dpi) and 14 dpf (11 dpi) in the double Tg(sox10:GFP;col2a1:mCherry) line. The central cells of the distal tip contains GFP expressing cells during development in uninjured controls. Note that the regenerated MC harbors a continuum of cells expressing low levels of GFP at 3 dpi but higher expression at the tip at 11 dpi. (G, H) Graphs comparing MC length (G) and area (H) in injured versus uninjured fish at 14 and 26 dpi. N = 11 to 22 individuals for each condition. (I) Graphs comparing the L/W ratio of MC col2a1 + cells within the 100 µm region located at the anterior tip of MC in injured versus uninjured fish at 14 dpi. Note that the col2a1 + cells are similarly elongated (the dotted blue line indicates a ratio of 1 which would correspond to round cells. Scale bar: 100 µm. Graphs indicate the means ± SEM. N = 50 cells were analyzed in uninjured, n = 70 cells in injured for the graph in I. Mann-Whitney test was used to compare the MC lenght and area and the L/W ratio of cells in injured and uninjured individuals. p > 0.05.
FIGURE 3
FIGURE 3
Analyses of cell proliferation in growing versus regenerating MC in Tg(col2a1:mCherry) line (A) Double immuno-stainings against BrdU (green) and Ds-Red (red) after BrdU incorporations performed during 16 h between 4 and 20 hpi. The pictures are confocal maximal projections of z-stacks in ventral views of MC in injured at 20hpi versus age-matched uninjured fish. The white arrowheads mark the BrdU+ chondrocytes highlighted in the orthogonal views. (B) Countings of double BrdU+/mCherry+ cells in injured MC at 20hpi (immediately after a 16 h pulse at 4–20 hpi) versus uninjured MC at an equivalent stage. (C, D) Countings of double BrdU+/mCherry+ cells in injured MC at 3 dpi after sequential periods of BrdU incorporations in pulse-chase strategy. The double positive cells counted in graph (C) correspond to cells found in each MC half, whereas the cells counted in (D) are double positive cells mapped at 3 dpi in the anterior tip of each MC half. (E) Time lapse analysis of chondrocyte cell division at the wound in a double transgenic Tg(col2a1:mCherry;XIa.Eef1a1:H2B-venus) fish taken from 1 to 22hpi. The panel on the right describes the successive steps of division of two chondrocytes (white arrowheads) located at the border of the wound at the anterior end of cut MC (dotted white line in the left picture). Scale bar: 100 µm. Graphs indicate the means ± SEM. Mann-Whitney test was used to compare the number of BrdU+ cells in injured and uninjured individuals. *: p < 0.05; **: p < 0.01; ***: p < 0.001; ****: p < 0.0001.
FIGURE 4
FIGURE 4
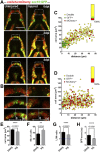
Distribution of cells expressing distinct levels of sox10:GFP and col2a1:mcherry transgenes during MC regeneration (A) Confocal maximal projections of MC in ventral views for control uninjured and injured fish at 0, 2 and 4 dpi. (B) Close-up on the midzones of the control uninjured and injured lower jaws presented in A at 0, 2 and 4 dpi (delineated by the white dotted line). The center of the midzone is indicated by a dotted line that represents the “0” of the x-axis for mapping the cells. (C, D) Mapping of the cell areas depending on their distance to the center of the corresponding MC in injured (D) versus uninjured (C). Data from the two hemi-segments of each MC are placed in the same direction for analyses. Qualitative data about the expression of sox10:GFP and col2a1:mcherry transgenes are color coded on the graph (red: col2a1:mcherry + only, green: sox10:GFP + only, yellow: double positive for sox10:GFP and col2a1:mcherry + ). A graph on each upper right corner indicates the proportions of each cell population. (E–H) Graphs comparing different parameters of the cells present in injured versus uninjured MC midzones at 4 dpi. The scoring for fluorescence intensities were as follows: 0 = no fluorescence, 1 = detectable fluorescence, 2 = clear fluorescence, 3 = bright fluorescence. Scale bar: 100 µm (A); 25 µm (B). Four individuals of each condition were analyzed for each experiment, 2 independent experiments (n = 8), in total 293 and 390 cells were analyzed for uninjured and injured condition, respectively. Graphs indicate the means ± SEM. Mann-Whitney test was used to compare the indicated parameters in injured and uninjured individuals. *: p < 0.05; **: p < 0.01; ***: p < 0.001; ****: p < 0.0001.
FIGURE 5
FIGURE 5
Role of the Nrg1/ErbB signaling pathway in MC regeneration (A) Expression analysis of nrg1 by in situ hybridization in fish injured at 3 dpf at the different times post-injury indicated (lower panel) and in uninjured control at equivalent stages (upper panel). MC is delineated by a white dotted line. Insert present a close-up on cells expressing nrg1 at the level of the epithelium covering the wound below the pictures with positive signal (superficial focal plane). White arrowheads point to the midline of the lower jaw at which the epithelial cells from the two sides have joined. (B) Levels of mRNA expression of the genes indicated in injured fish at 24 hpi relative to expression in control uninjured larvae at corresponding stages. N = 5–7 for each gene, all the values were normalized relative to the corresponding control uninjured value. (C) Representative pictures of growing uninjured MC and regenerating MC at 3 dpi after incubations of the fish with the pan-ErbB inhibitor PD168393, or with DMSO alone. The treated and untreated MC are presented in ventral views (confocal maximal projections of z-stacks) and lateral views of 3D reconstructed MC. (D) Representative pictures of growing uninjured MC and regenerating MC at 3 dpi after mosaic injections of OG with or without Mo-nrg1. The fish are presented in ventral views (confocal maximal projections of z-stacks) and lateral views of 3D reconstructed MC. (E) Graphs comparing the length and area of uninjured and injured MC, treated with PD168393 or DMSO alone. N = 17-20 for each condition, data from three independent experiments. (F) Graphs comparing the length and area of uninjured and injured MC, co-injected with OG and Mo-nrg1 or injected with OG alone. N = 6–11 for each injured condition, data from two independent experiments. Scale bars: 100 µm. Graphs indicate the means ± SD. Mann-Whitney test was used to compare the data obtained in two conditions. p values are indicated on the graph when significant. *: p < 0.05; **: p < 0.01.
FIGURE 6
FIGURE 6
Effect of NRG1 treatment on chondrocytes undergoing an IL1β-dependent degeneration associated with osteoarthritic (OA)-like phenotype in vitro (A) Design of the experiment. (B) Nrg1, ErbB2 and ErbB3 mRNA expression in naïve chondrocytes (CTRL, not treated with IL1β) and chondrocytes impaired by IL1β, treated or not by NRG1. (C) RT-qPCR analysis of CTRL and OA-like chondrocytes (IL1β). Expression profile of hypertrophic (Mmp13, Adamts5 and Alpl) marker genes. Each dot represents one biological replicate, and results are expressed as the mean ± SEM. Mann-Whitney test was used to compare control untreated samples and samples treated with either IL1β or IL1β and NRG1. *: p < 0.05.

Similar articles

Cited by

References

    1. Akiyama H., Chaboissier M. C., Behringer R. R., Rowitch D. H., Schedl A., Epstein J. A., et al. (2004). Essential role of Sox9 in the pathway that controls formation of cardiac valves and septa. Proc. Natl. Acad. Sci. U. S. A. 101, 6502–6507. 10.1073/pnas.0401711101 - DOI - PMC - PubMed
    1. Ando K., Shibata E., Hans S., Brand M., Kawakami A. (2017). Osteoblast production by reserved progenitor cells in zebrafish bone regeneration and maintenance. Dev. Cell 43, 643–650. 10.1016/j.devcel.2017.10.015 - DOI - PubMed
    1. Askary A., Smeeton J., Paul S., Schindler S., Braasch I., Ellis N. A., et al. (2016). Ancient origin of lubricated joints in bony vertebrates. Elife 5, e16415. 10.7554/eLife.16415 - DOI - PMC - PubMed
    1. Bartus K., Galino J., James N. D., Hernandez-Miranda L. R., Dawes J. M., Fricker F. R., et al. (2016). Neuregulin-1 controls an endogenous repair mechanism after spinal cord injury. Brain 139, 1394–1416. 10.1093/brain/aww039 - DOI - PMC - PubMed
    1. Bersell K., Arab S., Haring B., Kuhn B. (2009). Neuregulin1/ErbB4 signaling induces cardiomyocyte proliferation and repair of heart injury. Cell 138, 257–270. 10.1016/j.cell.2009.04.060 - DOI - PubMed