

Temporal changes in glucose metabolism reflect polarization in resident and monocyte-derived macrophages after myocardial infarction
- PMID: 37215542
- PMCID: PMC10196495
- DOI: 10.3389/fcvm.2023.1136252
Temporal changes in glucose metabolism reflect polarization in resident and monocyte-derived macrophages after myocardial infarction
Abstract
Introduction: Metabolic reprogramming from glycolysis to the mitochondrial tricarboxylic acid (TCA) cycle and oxidative phosphorylation may mediate macrophage polarization from the pro-inflammatory M1 to the anti-inflammatory M2 phenotype. We hypothesized that changes in cardiac macrophage glucose metabolism would reflect polarization status after myocardial infarction (MI), ranging from the early inflammatory phase to the later wound healing phase.
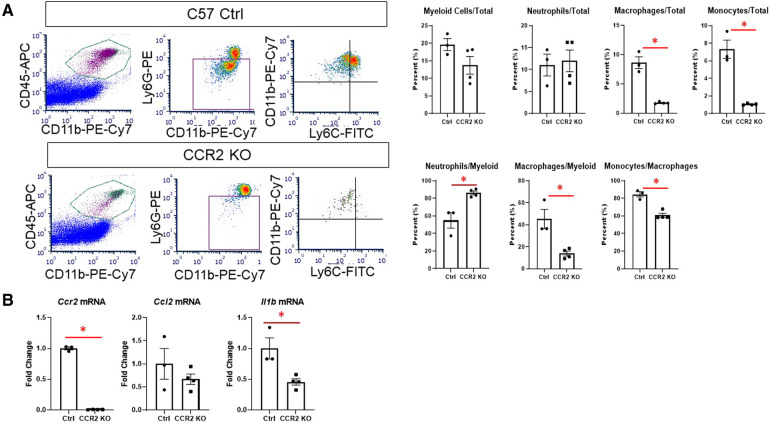
Methods: MI was induced by permanent ligation of the left coronary artery in adult male C57BL/6J mice for 1 (D1), 3 (D3), or 7 (D7) days. Infarct macrophages were subjected to metabolic flux analysis or gene expression analysis. Monocyte versus resident cardiac macrophage metabolism was assessed using mice lacking the Ccr2 gene (CCR2 KO).
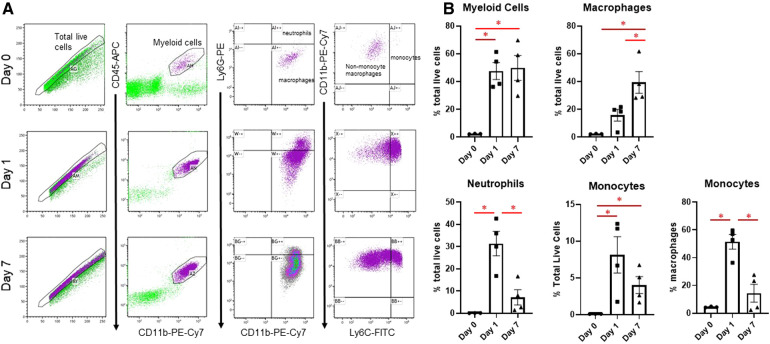
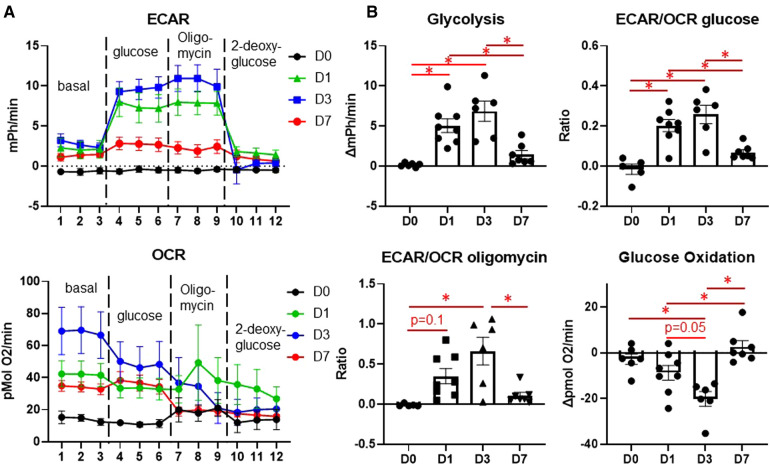
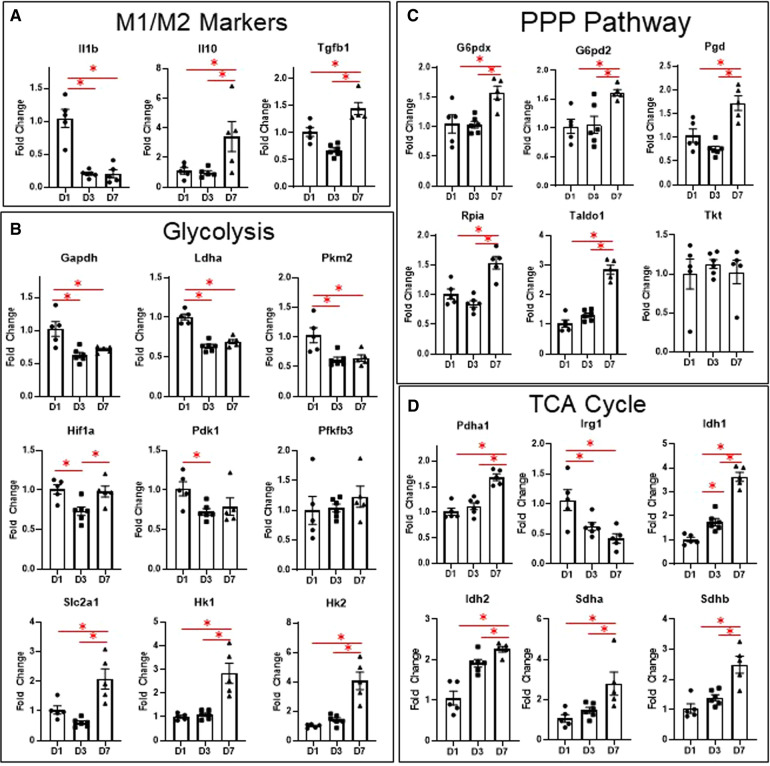
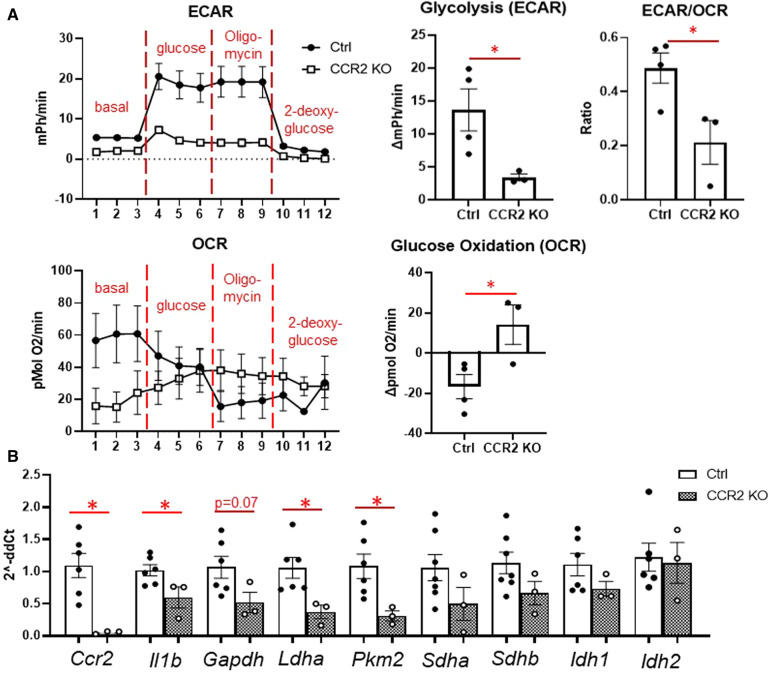
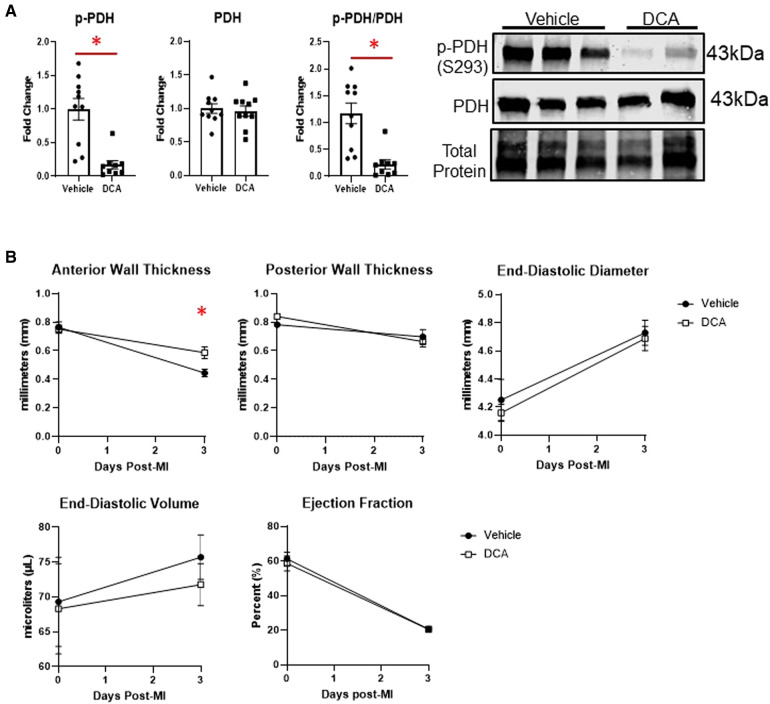
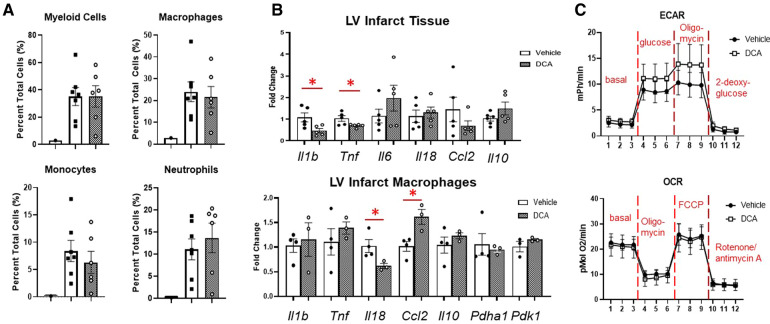
Results: By flow cytometry and RT-PCR, D1 macrophages exhibited an M1 phenotype while D7 macrophages exhibited an M2 phenotype. Macrophage glycolysis (extracellular acidification rate) was increased at D1 and D3, returning to basal levels at D7. Glucose oxidation (oxygen consumption rate) was decreased at D3, returning to basal levels at D7. At D1, glycolytic genes were elevated (Gapdh, Ldha, Pkm2), while TCA cycle genes were elevated at D3 (Idh1 and Idh2) and D7 (Pdha1, Idh1/2, Sdha/b). Surprisingly, Slc2a1 and Hk1/2 were increased at D7, as well as pentose phosphate pathway (PPP) genes (G6pdx, G6pd2, Pgd, Rpia, Taldo1), indicating increased PPP activity. Macrophages from CCR2 KO mice showed decreased glycolysis and increased glucose oxidation at D3, and decreases in Ldha and Pkm2 expression. Administration of dichloroacetate, a pyruvate dehydrogenase kinase inhibitor, robustly decreased pyruvate dehydrogenase phosphorylation in the non-infarcted remote zone, but did not affect macrophage phenotype or metabolism in the infarct zone.
Discussion: Our results indicate that changes in glucose metabolism and the PPP underlie macrophage polarization following MI, and that metabolic reprogramming is a key feature of monocyte-derived but not resident macrophages.
Keywords: glycolysis; heart failure; immunometabolism; inflammation; macrophage.
© 2023 Mouton, Aitken, Codreanu, Sherrod, McLean, Moak, do Carmo, da Silva, Omoto, Li, Wang, Schrimpe-Rutledge and Hall.
Conflict of interest statement
The authors declare that the research was conducted in the absence of any commercial or financial relationships that could be construed as a potential conflict of interest.
Figures
Similar articles
-
A simplified herbal decoction attenuates myocardial infarction by regulating macrophage metabolic reprogramming and phenotypic differentiation via modulation of the HIF-1α/PDK1 axis.Chin Med. 2024 May 30;19(1):75. doi: 10.1186/s13020-024-00933-x. Chin Med. 2024. PMID: 38816815 Free PMC article.
-
Aminooxyacetic acid attenuates post-infarct cardiac dysfunction by balancing macrophage polarization through modulating macrophage metabolism in mice.J Cell Mol Med. 2020 Feb;24(4):2593-2609. doi: 10.1111/jcmm.14972. Epub 2020 Jan 13. J Cell Mol Med. 2020. PMID: 31930778 Free PMC article.
-
M2 Macrophage-Derived sEV Regulate Pro-Inflammatory CCR2+ Macrophage Subpopulations to Favor Post-AMI Cardiac Repair.Adv Sci (Weinh). 2023 May;10(14):e2202964. doi: 10.1002/advs.202202964. Epub 2023 Mar 22. Adv Sci (Weinh). 2023. PMID: 36950739 Free PMC article.
-
The Role of Metabolic Remodeling in Macrophage Polarization and Its Effect on Skeletal Muscle Regeneration.Antioxid Redox Signal. 2019 Apr 20;30(12):1553-1598. doi: 10.1089/ars.2017.7420. Epub 2018 Oct 9. Antioxid Redox Signal. 2019. PMID: 30070144 Review.
-
Regulation of macrophage polarization by targeted metabolic reprogramming for the treatment of lupus nephritis.Mol Med. 2024 Jun 25;30(1):96. doi: 10.1186/s10020-024-00866-z. Mol Med. 2024. PMID: 38914953 Free PMC article. Review.
Cited by
-
Proteomic and metabolomic insights into oxidative stress response activation in mouse embryos generated by in vitro fertilization.Hum Reprod Open. 2025 Apr 28;2025(2):hoaf022. doi: 10.1093/hropen/hoaf022. eCollection 2025. Hum Reprod Open. 2025. PMID: 40416391 Free PMC article.
-
Dysregulated cytokine and oxidative response in hyper-glycolytic monocytes in obesity.Front Immunol. 2024 Jul 10;15:1416543. doi: 10.3389/fimmu.2024.1416543. eCollection 2024. Front Immunol. 2024. PMID: 39050851 Free PMC article.
-
Modulation of cardiac resident macrophages immunometabolism upon high-fat-diet feeding in mice.Front Immunol. 2024 Jun 28;15:1371477. doi: 10.3389/fimmu.2024.1371477. eCollection 2024. Front Immunol. 2024. PMID: 39007149 Free PMC article.
-
Macrophage energy metabolism in cardiometabolic disease.Mol Cell Biochem. 2025 Mar;480(3):1763-1783. doi: 10.1007/s11010-024-05099-6. Epub 2024 Aug 29. Mol Cell Biochem. 2025. PMID: 39198360 Free PMC article. Review.
-
Metabolic regulation of the immune system in health and diseases: mechanisms and interventions.Signal Transduct Target Ther. 2024 Oct 9;9(1):268. doi: 10.1038/s41392-024-01954-6. Signal Transduct Target Ther. 2024. PMID: 39379377 Free PMC article. Review.
References
Grants and funding
LinkOut - more resources
Full Text Sources
Research Materials
Miscellaneous