. 2023 Apr 29;13(8):2673-2692.
doi: 10.7150/thno.80271. eCollection 2023.

Human iPSC-derived midbrain organoids functionally integrate into striatum circuits and restore motor function in a mouse model of Parkinson's disease

Affiliations

Human iPSC-derived midbrain organoids functionally integrate into striatum circuits and restore motor function in a mouse model of Parkinson's disease

Xin Zheng et al. Theranostics. .

Abstract

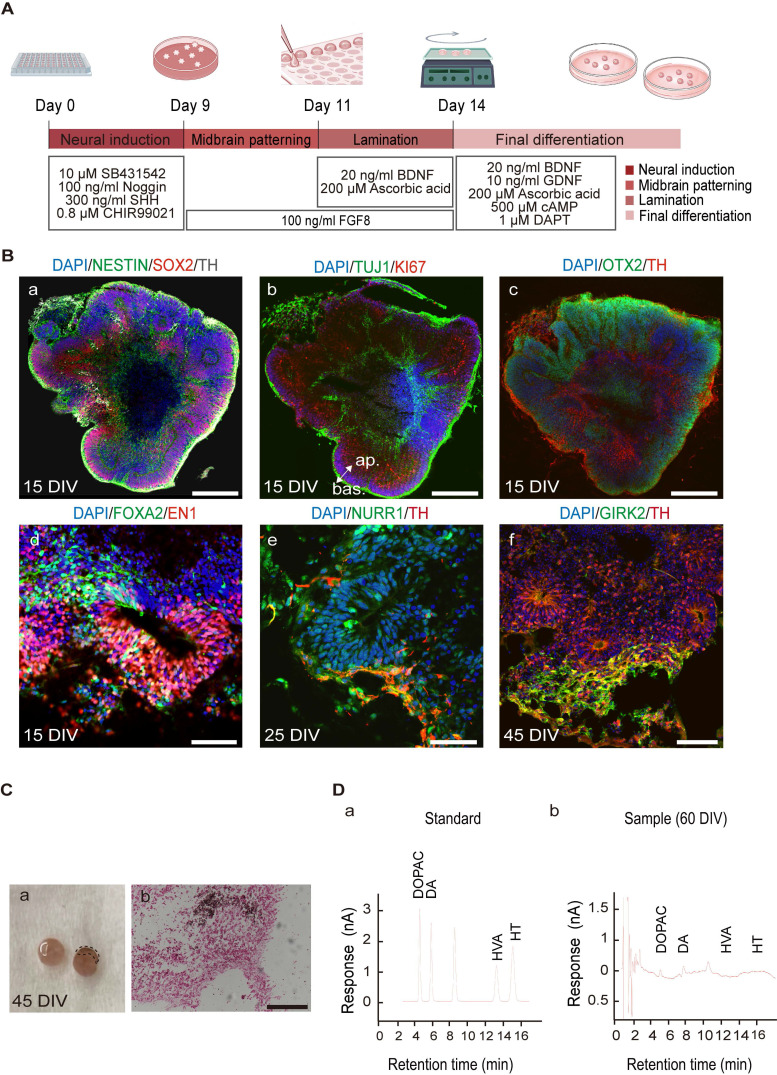
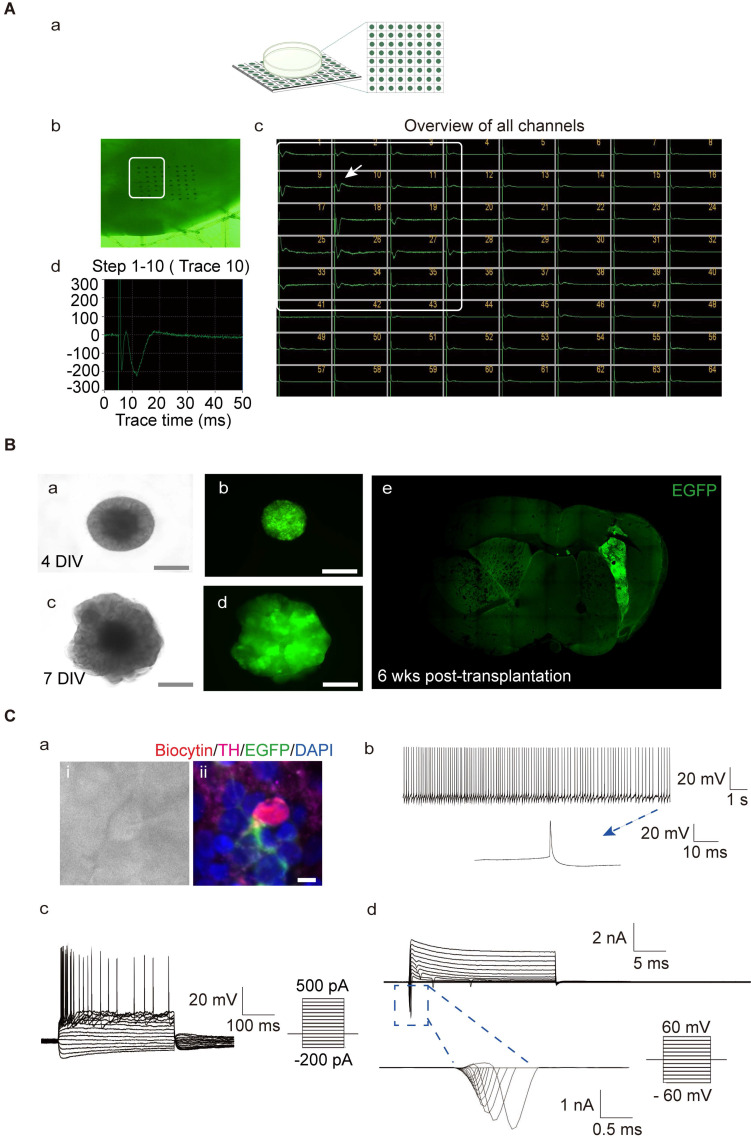
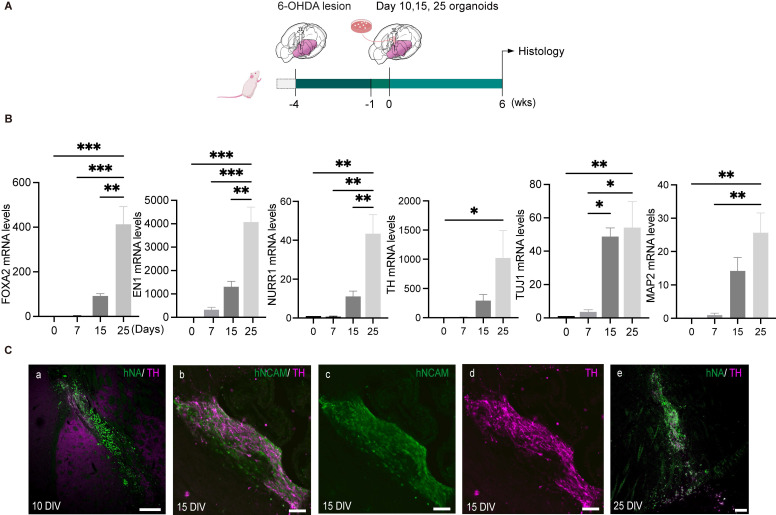
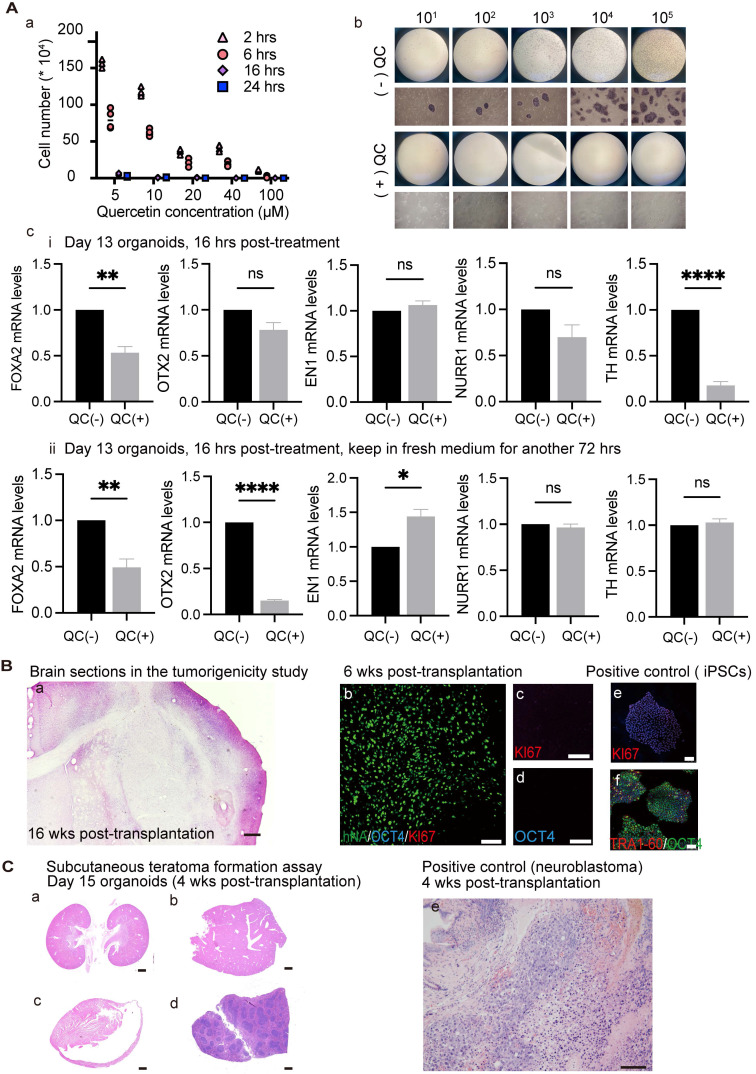
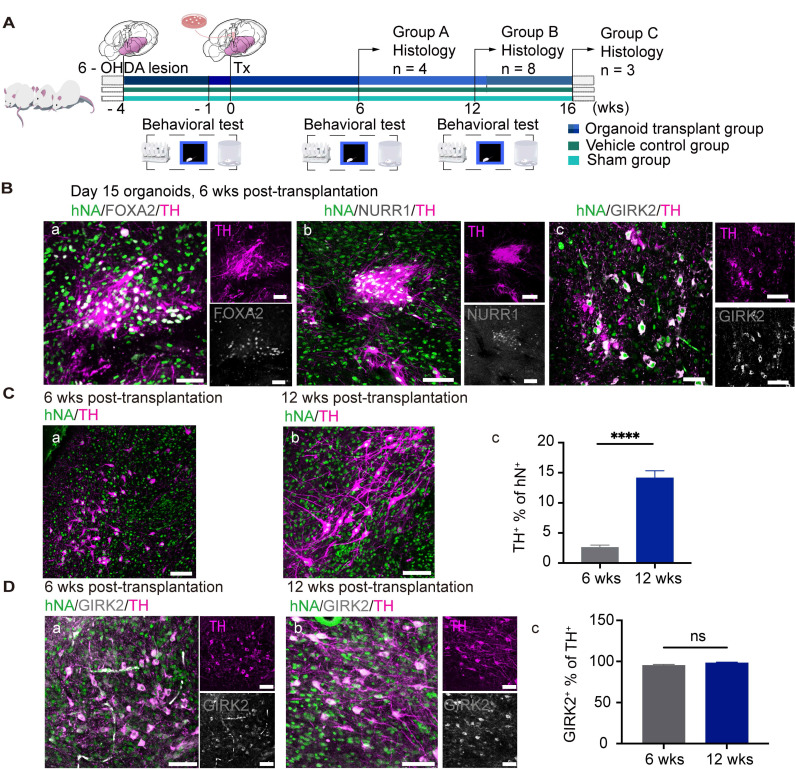
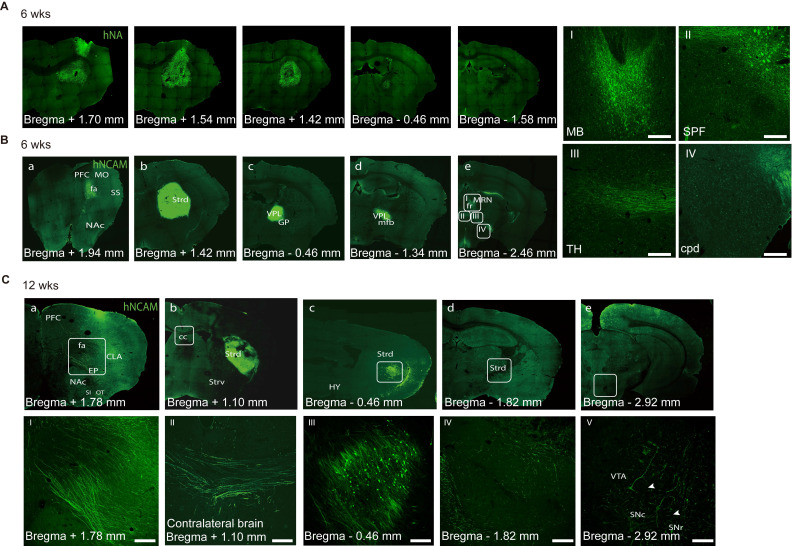
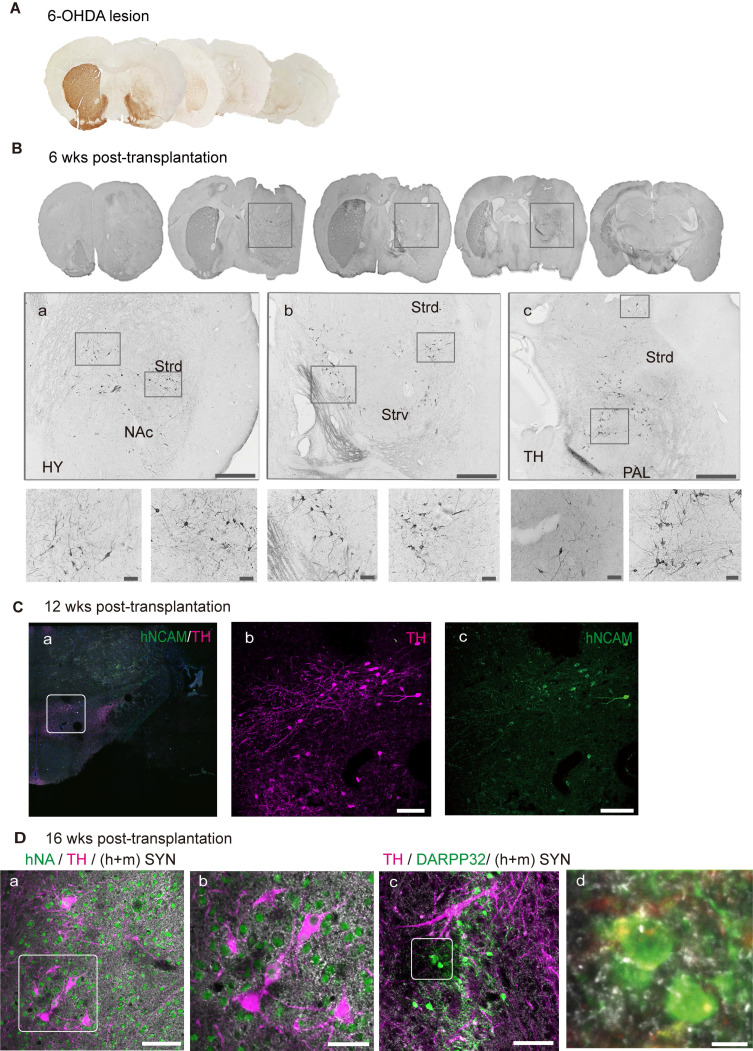
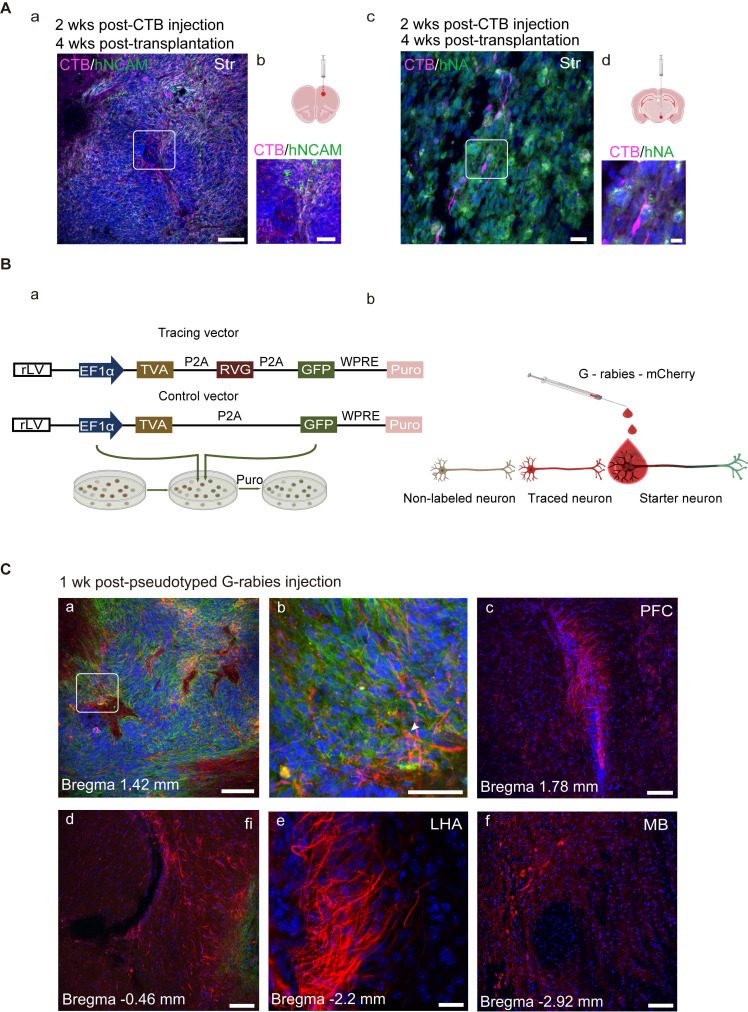
Rationale: Parkinson's disease (PD) is a prevalent neurodegenerative disorder that is characterized by degeneration of dopaminergic neurons (DA) at the substantia nigra pas compacta (SNpc). Cell therapy has been proposed as a potential treatment option for PD, with the aim of replenishing the lost DA neurons and restoring motor function. Fetal ventral mesencephalon tissues (fVM) and stem cell-derived DA precursors cultured in 2-dimentional (2-D) culture conditions have shown promising therapeutic outcomes in animal models and clinical trials. Recently, human induced pluripotent stem cells (hiPSC)-derived human midbrain organoids (hMOs) cultured in 3-dimentional (3-D) culture conditions have emerged as a novel source of graft that combines the strengths of fVM tissues and 2-D DA cells. Methods: 3-D hMOs were induced from three distinct hiPSC lines. hMOs at various stages of differentiation were transplanted as tissue pieces into the striatum of naïve immunodeficient mouse brains, with the aim of identifying the most suitable stage of hMOs for cellular therapy. The hMOs at Day 15 were determined to be the most appropriate stage and were transplanted into a PD mouse model to assess cell survival, differentiation, and axonal innervation in vivo. Behavioral tests were conducted to evaluate functional restoration following hMO treatment and to compare the therapeutic effects between 2-D and 3-D cultures. Rabies virus were introduced to identify the host presynaptic input onto the transplanted cells. Results: hMOs showed a relatively homogeneous cell composition, mostly consisting of dopaminergic cells of midbrain lineage. Analysis conducted 12 weeks post-transplantation of day 15 hMOs revealed that 14.11% of the engrafted cells expressed TH+ and over 90% of these cells were co-labeled with GIRK2+, indicating the survival and maturation of A9 mDA neurons in the striatum of PD mice. Transplantation of hMOs led to a reversal of motor function and establishment of bidirectional connections with natural brain target regions, without any incidence of tumor formation or graft overgrowth. Conclusion: The findings of this study highlight the potential of hMOs as safe and efficacious donor graft sources for cell therapy to treat PD.

Keywords: Cell therapy; Human induced pluripotent stem cells; Midbrain organoids; Parkinson's disease; Transplantation.


Conflict of interest statement

Competing Interests: The authors have declared that no competing interest exists.

Figures

Figure 1
Figure 1
Differentiation of human induced pluripotent stem cells (hiPSCs) to hMOs. (A) Schematic representation of the procedure for differentiation of hiPSCs to hMOs. (B) Immunofluorescent staining for characterization of hiPSC-derived hMOs (n = 10). Scale bars: a, b, c, 250 μm; d, 75 μm; e, 50 μm; f, 100 μm. (C) Assessment of neuromelanin production in hMOs (n = 6). (a) A representative differential interface contrast (DIC) image of organoids with neuromelanin granule (within dotted box). (b) Fontana-Masson staining. Scale bar, 100 μm. (D) HPLC analysis of the whole organoids. The concentration of dopamine and the metabolite, 3,4-dihydroxyphenylacetic acid, were assessed following high potassium stimulation at 60 DIV (n = 10). FGF8, fibroblast growth factor 8; SHH, Sonic hedgehog; BDNF, brain-derived neurotrophic factor; GDNF, glial cell-derived neurotrophic factor; cAMP, dibutyryladenosine 3′,5′-cyclic monophosphate sodium salt; DAPT, 1-dimethylethyl ester; SOX2, sry-box transcription factor 2; TH, tyrosine hydroxylase; TUJ1, tubulin beta 3 class III; OTX2, orthodenticle homeobox 2; FOXA2, forkhead box A2; EN1, engrail-1; NURR1, nuclear receptor subfamily 4; GIRK2, G-protein-coupled inward rectifier potassium; DIV, Days in vitro; ap., apical; bas., basal; min, minutes; DA, dopamine; DOPAC, 3,4-dihydroxyphenylacetic acid; HVA, homo-vanillic acid; HT, 5-hydroxytryptamine.
Figure 2
Figure 2
Evaluation of the functional maturity of hMOs. (A) The electrophysiological activity in whole organoids was assessed using a MED64 multi-electrode array system (n = 4). (a) Schematic representation of the electrophysiological signal processing system. (b) Photomicrographs of an organoid on a dish with the 64-electrode array. (c) Bursts occurring at the same time in different channels represented a network burst (the boxed region). (d) A representative spike cluster (arrow in c). (B) hiPSC- enhanced green fluorescent protein (EGFP) -derived hMOs were engrafted into the brain of severe combined immunodeficient (SCID) mice for examination of electrophysiological properties. (a-d) Microscopic images showing EGFP+ organoids on days 4 and day 7 (a, c, DIC images; b, d, fluorescence microscopic images). Scale bars, 2 mm. (e) A brain slice containing EGFP+ organoids 6 weeks post-transplantation. (C) Whole-cell current clamp recordings (n = 3). (a) Phase contrast image of a patched neuron and corresponding triple staining of the recorded neuron for EGFP, biocytin, and TH. (b) Regular spontaneous AP activity of a transplanted EGFP-cell. (c) APs evoked by step-current injections. (d) Representative voltage-dependent Na+ and K+ currents patched on a grafted neuron. Respective traces of inward Na+ in the blue box were expanded. Scale bars, 25 μm. DIV, days in vitro; wks, weeks.
Figure 3
Figure 3
The optimal differentiation stage of hMOs for transplantation. (A) Schematic representation of the experimental design. (B) Representative RT-PCR results at different differentiation time points (n = 6). Results are expressed as fold changes compared to undifferentiated hiPSCs at day 0. Three independent experiments were conducted. (C) Survival and differentiation of hMOs following transplantation into brains of SCID mice (n = 9). Transplantation of day 10 (a), day 15 (b - d) and day 25 organoids. (e) Most organoids at 25 DIV died following transplantation, D 0, Day 0; DIV, Days in vitro. Scale bars: a, 250 μm; b, c, d, 50 μm; e, 100 μm.
Figure 4
Figure 4
Effects of quercetin (QC) treatment on cultured undifferentiated cells and tumorigenicity study of transplanted organoids. (A) (a) Testing the optimal QC treatment conditions. Three independent experiments were conducted. (b) Response of different concentrations of hiPSCs to 40 μm QC. (n = 3) (c) Differentiation of organoids were evaluated after 40 μm QC treatment for 16 h. (i) Organoids were examined after the termination of QC treatment. (ii) Organoids were examined after having 3 days of recovery period. (B) Representative images of brain sections of the mice used in the tumorigenicity study (n = 8). H&E (a) / IF staining (b-d) of brain slices revealed no malignant or proliferative cells. Scale bars: a, 1mm; b-f, 100 μm. (e, f) Positive control for KI67 and OCT4 staining. (C) (a) Neither tumor formation nor tumor migration was detected in the subcutaneous space or in organs, such as the kidney (a), liver (b), heart (c), spleen (d). Scale bars: a-d, 1mm; e, 100 μm; (e) Representative images of grafts in the subcutaneous space of mice injected with neuroblastoma cell line as a positive control (n = 6). wks, weeks; hrs, h.
Figure 5
Figure 5
Transplantation of hiPSC-derived hMOs into PD mice. (A) Schematic representation of the experimental design and timeline of behavioral tests. Small subsets of mice in groups A and C were sacrificed for histology analysis at a specific time point, while a subset of mice in group B (n = 8) were examined for behavioral data collection. (B) Immunofluorescent staining confirmed the differentiation and maturation of engrafted organoids in vivo (n = 8). Scale bars, 50 μm. (C) (a-c) Representative confocal microscopic images at two time points following transplantation and the proportions of TH+ cells among the engrafted cells were plotted (2.57% for 6 weeks [n = 4] and 14.11% for 12 weeks [n = 8]). (D) Representative confocal microscopic images at two time points of transplantation and the proportions of GIRK2+ in TH+ graft areas (95% for 6 weeks [n = 10] and 98% for 12 weeks [n = 20]); *p < 0.05, ** p < 0.01, **** p < 0.0001 by t - test. Scale bars, 100 μm. Tx, transplantation; wks, weeks.
Figure 6
Figure 6
Axonal projections of engrafted neurons. (A) Representative immunofluorescence images revealing the distribution of transplanted cells at 6 weeks. (B) Immunofluorescent staining of hNCAM demonstrating graft-derived fibers innervating into host brain regions, including cerebral cortex (a), striatum (b), medial forebrain bundle (c, d), and midbrain (e). The boxed areas were magnified in I-IV. Scale bars, 250 μm. (n = 4) (C) Immunofluorescent staining of hNCAM demonstrating graft-derived fibers innervating into host brain regions at 12 weeks (n = 8); I-IV corresponds to a-e, respectively. Scale bars, 250 μm. wks, weeks; PFC, prefrontal cortex; fa/CC, corpus callosum; MO, somatomotor cortex; SS, somatosensory cortex; NAc, nucleus accumbens; Strd/ Strv, dorsolateral/ventral striatum; GP, globus pallidus; VPL, ventral posterolateral nucleus of the thalamus; mfb, medial forebrain bundle; HY, hypothalamus; TH, thalamus; MB, midbrain; MRN, midbrain reticular nucleus; fr, fasciculus retro-flexus; SPF, sub-parafascicular nucleus; CLA, claustrum; EP, endopiriform nucleus; SI, substantia innominate; OT, olfactory bulb; SNr/ SNc, reticular/ compact part of substantial nigra; VTA, ventral tegmental area.
Figure 7
Figure 7
Graft-derived DA neurons innervate into host neuronal circuitry. (A) Immunohistochemical analysis revealed degeneration of unilateral endogenous TH-positive midbrain dopaminergic neurons in the substantia nigra (SN) and striatum in 6-OHDA-lesioned mice. (B) Graft-derived DA neurons in the lesioned hemisphere. Scale bars, 100 μm. (C) TH+/hNCAM+ fibers innervated into ipsilateral reticular/compact part of the SN. The boxed areas in a were magnified in b and c. Scale bars, 250 μm. (D) Transplanted DA neurons received synaptic (h+m Syn) inputs from host and/or grafted neurons (a, the box area was magnified in b). Grafted DA neurons extended the axons to adjacent medial spiny neurons (the boxed area in c was magnified in d). Scale bars, a, b, c, 50 μm; d, 7.5 μm; 6-OHDA, 6-hydroxydopamine; wks, weeks; NAc, nucleus accumbens; Strd/ Strv, dorsolateral/ventral striatum; TH, thalamus; PAL, pallidum.
Figure 8
Figure 8
Transplanted neurons connect with host neurons. (A) Grafted neurons located in the striatum projecting to prefrontal cortex (PFC) and hypothalamus (HY) (the boxed areas in a and c were magnified in b and d, respectively). (B) (a) Ideograph illustrating the rabies virus tracing system. (b) Ideograph illustrating GFP+ starter neurons infected with G-rabies which then started expressing mCherry. Traced neurons were infected by retrogradely transmitted G-rabies and were labeled with mCherry. (C) Monosynaptic tracing identified the early host-to-graft connectivity (n = 4). (a) Starter neurons were mainly located at the transplantation site and retrogradely infected adjacent grafted and/or host cells (arrows highlighted the starter neurons with GFP+/mCherry+). (b-f) Scattered traced neurons located at several brain regions, including PFC, fimbria, dorsolateral striatum, lateral hypothalamus area, and midbrain. Scale bars, a, c, d, e, f, 250 μm; b, 75 μm. Puro, puromycin; fi, fimbria; LHA, lateral hypothalamus area.

Similar articles

Cited by

References

    1. Tysnes OB, Storstein A. Epidemiology of Parkinson's disease. J Neural Transm (Vienna) 2017;124:901–5. - PubMed
    1. Brundin P, Li JY, Holton JL, Lindvall O, Revesz T. Research in motion: the enigma of Parkinson's disease pathology spread. Nat Rev Neurosci. 2008;9:741–5. - PubMed
    1. Lees AJ, Hardy J, Revesz T. Parkinson's disease. Lancet. 2009;373:2055–66. - PubMed
    1. Sage JI, McHale DM, Sonsalla P, Vitagliano D, Heikkila RE. Continuous levodopa infusions to treat complex dystonia in Parkinson's disease. Neurology. 1989;39:888–91. - PubMed
    1. Obeso JA, Rodriguez-Oroz MC, Goetz CG, Marin C, Kordower JH, Rodriguez M. et al. Missing pieces in the Parkinson's disease puzzle. Nat Med. 2010;16:653–61. - PubMed

Publication types