. 2023 Apr 17;13(8):2424-2438.
doi: 10.7150/thno.81714. eCollection 2023.

Therapeutic effect of ultra-long-lasting human C-peptide delivery against hyperglycemia-induced neovascularization in diabetic retinopathy

Affiliations

Therapeutic effect of ultra-long-lasting human C-peptide delivery against hyperglycemia-induced neovascularization in diabetic retinopathy

Chan-Hee Moon et al. Theranostics. .

Abstract

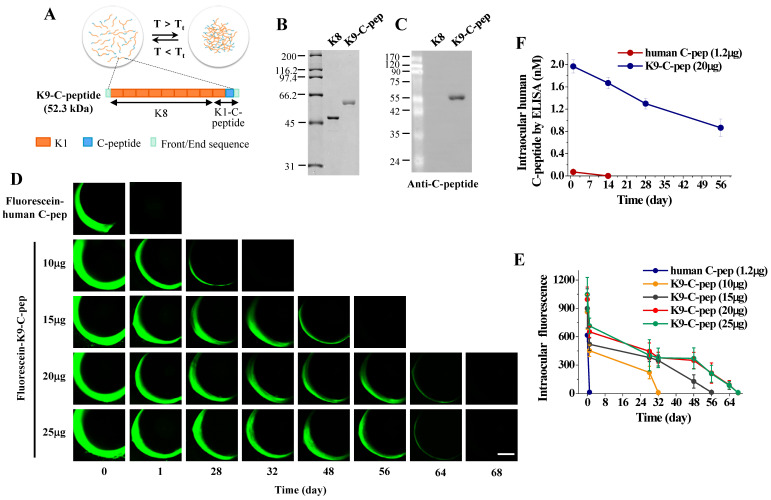
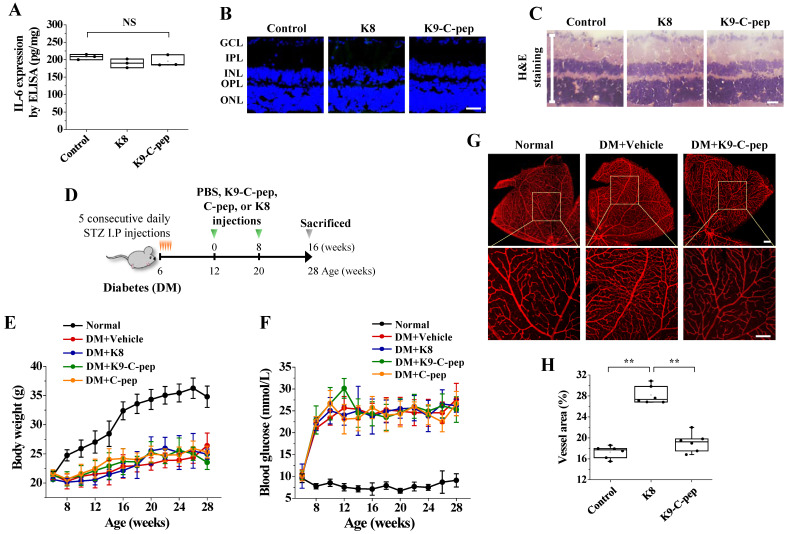
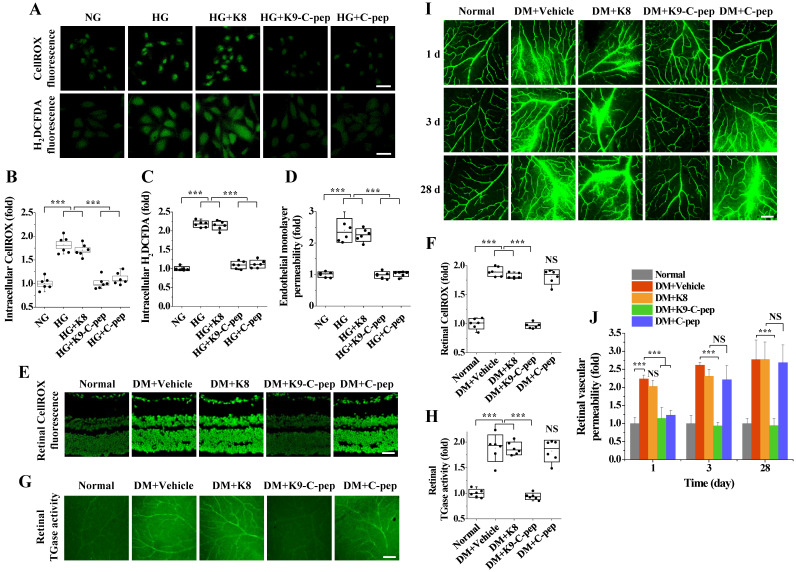
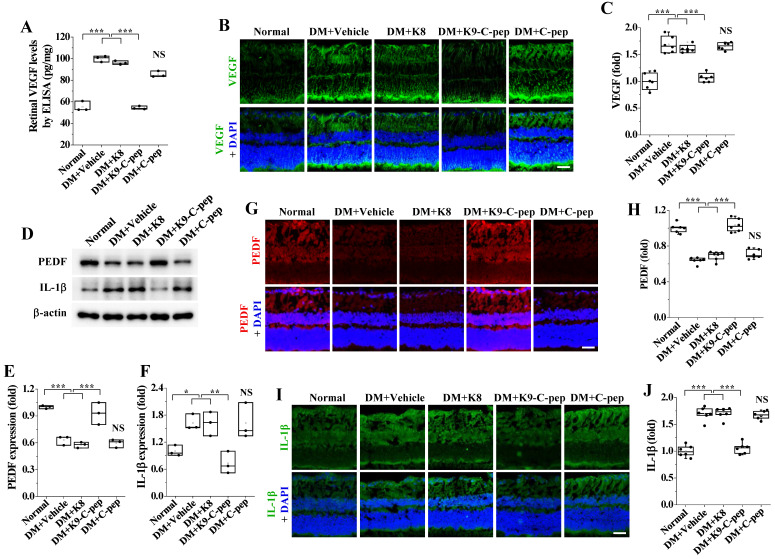
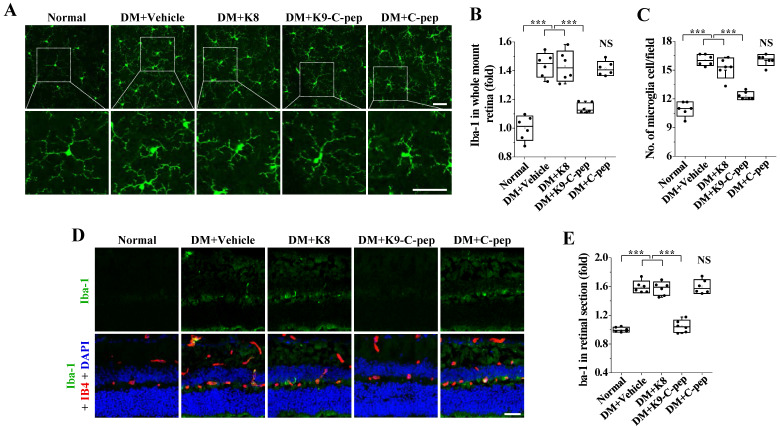
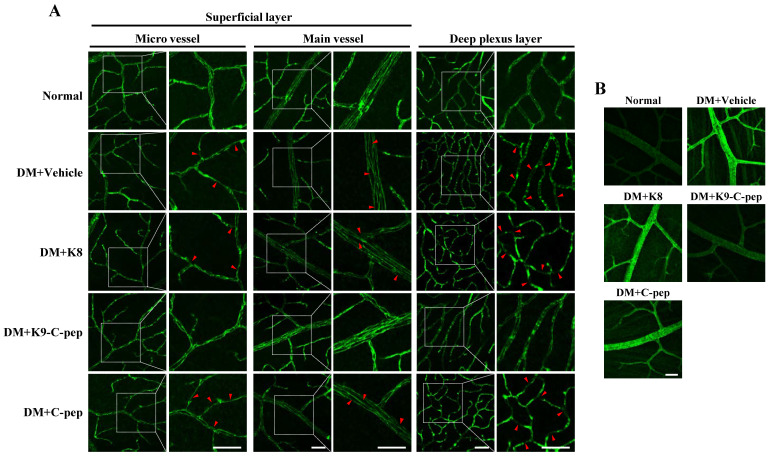
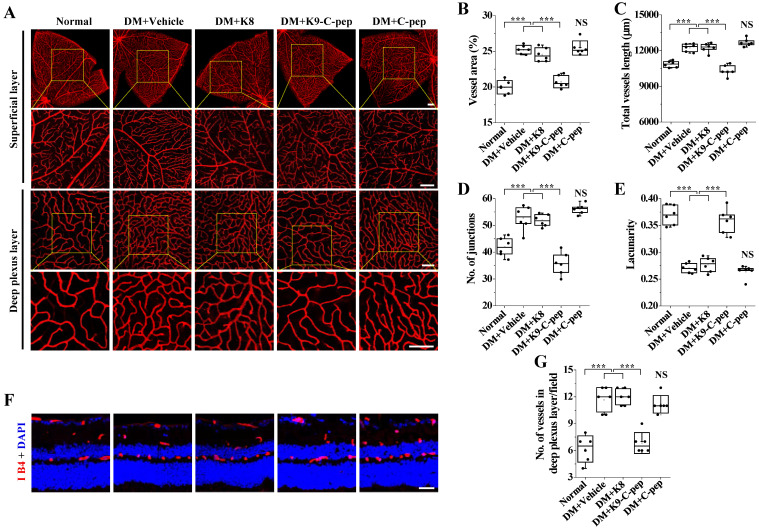
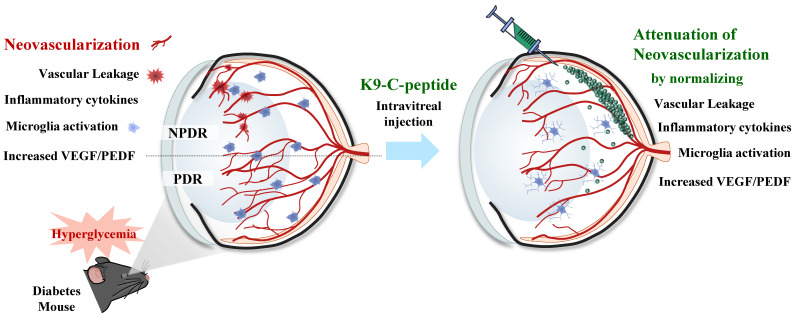
Rationale: Neovascularization is a hallmark of the late stages of diabetic retinopathy (DR) leading to blindness. The current anti-DR drugs have clinical disadvantages including short circulation half-lives and the need for frequent intraocular administration. New therapies with long-lasting drug release and minimal side effects are therefore needed. We explored a novel function and mechanism of a proinsulin C-peptide molecule with ultra-long-lasting delivery characteristics for the prevention of retinal neovascularization in proliferative diabetic retinopathy (PDR). Methods: We developed a strategy for ultra-long intraocular delivery of human C-peptide using an intravitreal depot of K9-C-peptide, a human C-peptide conjugated to a thermosensitive biopolymer, and investigated its inhibitory effect on hyperglycemia-induced retinal neovascularization using human retinal endothelial cells (HRECs) and PDR mice. Results: In HRECs, high glucose conditions induced oxidative stress and microvascular permeability, and K9-C-peptide suppressed those effects similarly to unconjugated human C-peptide. A single intravitreal injection of K9-C-peptide in mice resulted in the slow release of human C-peptide that maintained physiological levels of C-peptide in the intraocular space for at least 56 days without inducing retinal cytotoxicity. In PDR mice, intraocular K9-C-peptide attenuated diabetic retinal neovascularization by normalizing hyperglycemia-induced oxidative stress, vascular leakage, and inflammation and restoring blood-retinal barrier function and the balance between pro- and anti-angiogenic factors. Conclusions: K9-C-peptide provides ultra-long-lasting intraocular delivery of human C-peptide as an anti-angiogenic agent to attenuate retinal neovascularization in PDR.

Keywords: K9-C-peptide; diabetic retinopathy; human C-peptide; long-term delivery; neovascularization.


Conflict of interest statement

Competing Interests: The authors have declared that no competing interest exists.

Figures

Figure 1
Figure 1
Pharmacokinetic analysis and intravitreal fluorescence imaging of fluorescein-conjugated K9-C-peptide and human C-peptide in mice. A. Schematic diagram showing the construction of K9-C-peptide. B. Coomassie staining of purified K8 polypeptide (K8) and K9-C-peptide (K9-C-pep). C. Western blot analysis of K8 polypeptide and K9-C-peptide using an anti-C-peptide antibody to validate the localization of C-peptide in K9-C-peptide, but not in K8 polypeptide. D and E. C57BL/6 mice were intravitreally injected with 1.2 μg fluorescein-conjugated human C-peptide (human C-pep) or the indicated amounts of fluorescein-conjugated K9-C-peptide. Fluorescence images were obtained for 68 days by intravitreal fluorescence imaging. D. Representative fluorescence images of fluorescein-conjugated C-peptide and K9-C-peptide in the vitreous chamber. Scale bar, 1,000 μm. E. Quantification of fluorescein-conjugated C-peptide and K9-C-peptide levels in mice by measuring fluorescence intensity (n = 6). F. C57BL/6 mice were intravitreally injected with equimolar amounts of C-peptide or K9-C-peptide for the indicated times. C-peptide levels in the intraocular space were measured by ELISA (n = 6).
Figure 2
Figure 2
K9-C-peptide was not cytotoxic in the retina and had a prolonged inhibitory effect against retinal angiogenesis in PDR mice. A-C. K8 polypeptide (K8) and K9-C-peptide (K9-C-pep) were not cytotoxic in mouse retinas. Eight weeks after intravitreal injection of C57BL/6 mice with K9-C-peptide or K8 polypeptide, the negative control for K9-C-peptide, ocular IL-6 levels, retinal cell apoptosis, and histological changes were analyzed. A. Ocular IL-6 levels determined by ELISA of retinal lysates (n = 3). B. Retinal apoptosis. Representative images of TUNEL-positive cells (green) with nuclear counterstaining using DAPI (blue) in retinal sections are shown. Scale bar, 100 μm. C. No histopathological change was apparent in retinal sections by H&E staining. Scale bar, 100 μm. D-H. Six weeks after STZ injection, diabetic mice (DM) were given two intravitreal injections of PBS (vehicle), K9-C-peptide, K8 polypeptide, or human C-peptide (C-pep) over 16 weeks. Angiogenesis was then analyzed in whole-mounted retinas. D. Scheme for supplementing diabetic mice by two intravitreal injections of PBS, K9-C-peptide, K8 polypeptide, or C-peptide over 16 weeks. E and F. Body weight (E) and blood glucose levels (F) were monitored every 2 weeks (n = 9). G and H. Vascular organization was visualized by Alexa 647-isolectin B4 staining (G) and quantified by measuring the vessel percentage area (n = 6) in whole-mounted retinas (H). The bottom row of each group displays enlarged images of the square areas in the top row. Scale bar, 100 μm. Statistical significance was determined using one-way ANOVA with Holm-Sidak`s multiple comparisons test. GCL, ganglion cell layer; IPL, inner plexiform layer; INL, inner nuclear layer; OPL, outer plexiform layer; ONL, outer nuclear layer; NS, non-significant; ∗∗ P < 0.01.
Figure 3
Figure 3
K9-C-peptide inhibits hyperglycemia-induced ROS generation, TGase activation, and vascular leakage in HRECs and retinas of NPDR mice. A-D. HRECs were treated for 3 days with normal glucose (NG), high glucose (HG), or high glucose in the presence of 1 nmol/L K8 polypeptide (HG+K8), K9-C-peptide (HG+K9-C-pep), or C-peptide (HG+C-pep). Intracellular ROS generation was visualized by confocal microscopy using CellROXTM green and H2DCFDA. A: Representative images of ROS generation. Scale bar, 50 μm. B-C. ROS generation was quantified by measuring the fluorescence intensities of CellROXTM (B) and H2DCFDA (C) (n = 6). D. In vitro endothelial permeability was determined by 40-kDa FITC-dextran passage (n = 6). E-J. Six weeks after STZ injection, diabetic mice (DM) were supplemented for 4 weeks by a single intravitreal injection of PBS (DM+Vehicle), K8 polypeptide (DM+K8), K9-C-peptide (DM+K9-C-pep), or human C-peptide (DM+C-pep). E and F. Retinal ROS levels were visualized by CellROXTM green staining (E) and quantified (n = 6) by measuring fluorescence intensity in retinal sections (F). Scale bar, 100 μm. G and H. TGase activity was visualized in whole-mounted retinas (G) and quantified (n = 6) by measuring fluorescence intensity (F). I and J. Vascular leakage was visualized using FITC-dextran in whole-mounted retinas (I) and quantitatively analyzed (n = 6) by measuring fluorescence intensity (J). Scale bar, 100 μm. Statistical significance was determined using one-way ANOVA with Holm-Sidak`s multiple comparisons test. NS, non-significant; ∗∗∗P < 0.001.
Figure 4
Figure 4
Intravitreal K9-C-peptide inhibits VEGF overexpression, PEDF downregulation, and IL-1β expression in the retinas of PDR mice. Six weeks after STZ injection, diabetic mice (DM) were supplemented for 16 weeks with two intravitreal injections of PBS (DM+Vehicle), K8 polypeptide (DM+K8), K9-C-peptide (DM+K9-C-pep), or C-peptide (DM+C-pep). The mice were then subjected to analysis of VEGF, PEDF, and IL-1β expression. A-C. VEGF expression in the retinas was analyzed by ELISA (A) and immunofluorescence (B and C). A. Quantitation of retinal VEGF levels by ELISA (n = 3, two retinas/experiment). B. Representative images of VEGF expression (green) with nuclear counterstaining using DAPI (blue) in retinal sections. Scale bar, 100 μm. C. Quantitation of VEGF expression by measuring fluorescence intensity (n = 6). D-J. Expression of PEDF and IL-1β in the retinas was analyzed by Western blot (D-F) and immunofluorescence (G-J). D. Representative Western blot images of PEDF and IL-1β expression in the retinas. E and F. Densitometric quantification of PEDF (E) and IL-1β (F) expression levels (n = 3, two retinas/experiment). G and I. Representative images of PEDF (red) and IL-1β (green) expression in retinal sections with nuclear counterstaining using DAPI (blue). Scale bar, 100 μm. H and J. Quantitation of PEDF and IL-1β expression by measuring fluorescence intensity (n = 6). Statistical significance was determined using one-way ANOVA with Holm-Sidak`s multiple comparisons test. NS, non-significant; P < 0.05; ∗∗ P < 0.01; ∗∗∗P < 0.001.
Figure 5
Figure 5
Intravitreal K9-C-peptide inhibits hyperglycemia-induced microglial activation in the retinas of PDR mice. Diabetic mice (DM) were supplemented for 16 weeks with two intravitreal injections of PBS (DM+Vehicle), K8 polypeptide (DM+K8), K9-C-peptide (DM+K9-C-pep), or C-peptide (DM+C-pep). Microglia activation was analyzed by immunofluorescence using anti-Iba-1 antibody in whole-mounted retinas (A-C) and retinal sections (D and E). A. Representative images of microglia morphology and distribution in the deep plexus of whole-mounted retinas. The bottom row of each group displays enlarged images of the square areas in the top row. Scale bar, 50 μm. B. Quantitation of Iba-1 expression by measuring the fluorescence intensity in A (n = 6). C. Quantification of microglia per field in the deep plexus (n = 6). D. Representative images of Iba-1 expression (green) in retinal sections with nuclear counterstaining using DAPI (blue) and vessel staining using Alexa 647-isolectin B4 (red). Scale bar, 100 μm. E. Quantitation of Iba-1 expression by measuring the fluorescence intensity in D (n = 6). Statistical significance was determined using one-way ANOVA with Holm-Sidak`s multiple comparisons test. NS, non-significant; ∗∗∗P < 0.001.
Figure 6
Figure 6
Intravitreal K9-C-peptide inhibits hyperglycemia-induced VE-cadherin disassembly and stress fiber formation in the retinas of PDR mice. Diabetic mice (DM) were supplemented for 16 weeks with two intravitreal injections of PBS (DM+Vehicle), K8 polypeptide (DM+K8), K9-C-peptide (DM+K9-C-pep), or C-peptide (DM+C-pep). VE-cadherin disruption (A) and stress fiber formation (B) were then analyzed in the retinas of the mice. A. Representative images of VE-cadherin in the superficial and deep plexus layers of whole-mounted retinas. The right column of each group displays enlarged images of the square areas in the left column. Arrows indicate disrupted adherens junction. Scale bar, 50 μm. B. Representative images of stress fibers in the deep plexus. Scale bar, 50 μm.
Figure 7
Figure 7
Detailed investigation of pathological neovascularization in the deep plexus of PDR mouse retinas. Diabetic mice were supplemented for 16 weeks with two intravitreal injections of PBS (DM+Vehicle), K8 polypeptide (DM+K8), K9-C-peptide (DM+K9-C-pep), or C-peptide (DM+C-pep). Angiogenesis was then visualized by Alexa 647-isolectin B4 staining (red) in whole-mounted retinas (A-E) and retinal sections (F and G). A. Representative images of vascular organization (red) in the superficial (Scale bar, 200 μm) and deep plexus (Scale bar, 100 μm) layers of whole-mounted retinas. The bottom row of each group displays enlarged images of the square areas in the top row. B-E. Quantitation of indexes of vascularity in whole-mounted retinas (n = 6): vascular area (B), vessel length (C), number of junctions (D), and lacunarity (E). F. Representative images of retinal vasculatures (red) in retinal sections with nuclear counterstaining using DAPI (blue). Scale bar, 100 μm. G. The number of vessels in the deep plexus layer of retinal sections (n = 6). Statistical significance was determined using one-way ANOVA with Holm-Sidak`s multiple comparisons test. NS, non-significant; ∗∗∗P < 0.001.
Figure 8
Figure 8
Schematic depicting the ultra-prolonged therapeutic effect of intravitreal K9-C-peptide on vascular leakage, inflammation, microglia activation, and neovascularization in the retinas of diabetic mice. NPDR, non-proliferative diabetic retinopathy; PDR, proliferative diabetic retinopathy; VEGF, vascular endothelial growth factor; PEDF, pigment epithelium-derived factor.

References

    1. Duh EJ, Sun JK, Stitt AW. Diabetic retinopathy: current understanding, mechanisms, and treatment strategies. JCI Insight. 2017;2:e93751. - PMC - PubMed
    1. Jeon HY, Lee AJ, Ha KS. Polymer-Based Delivery of Peptide Drugs to Treat Diabetes: Normalizing Hyperglycemia and Preventing Diabetic Complications. Biochip J. 2022;16:111–27.
    1. Antonetti DA, Klein R, Gardner TW. Diabetic retinopathy. N Engl J Med. 2012;366:1227–39. - PubMed
    1. Kusuhara S, Fukushima Y, Ogura S, Inoue N, Uemura A. Pathophysiology of Diabetic Retinopathy: The Old and the New. Diabetes Metab J. 2018;42:364–76. - PMC - PubMed
    1. Crawford TN, Alfaro DV 3rd, Kerrison JB, Jablon EP. Diabetic retinopathy and angiogenesis. Curr Diabetes Rev. 2009;5:8–13. - PubMed

Publication types