. 2023 Apr 17;13(8):2384-2407.
doi: 10.7150/thno.79493. eCollection 2023.

Non-canonical integrin signaling activates EGFR and RAS-MAPK-ERK signaling in small cell lung cancer

Affiliations

Non-canonical integrin signaling activates EGFR and RAS-MAPK-ERK signaling in small cell lung cancer

Karla Rubio et al. Theranostics. .

Abstract

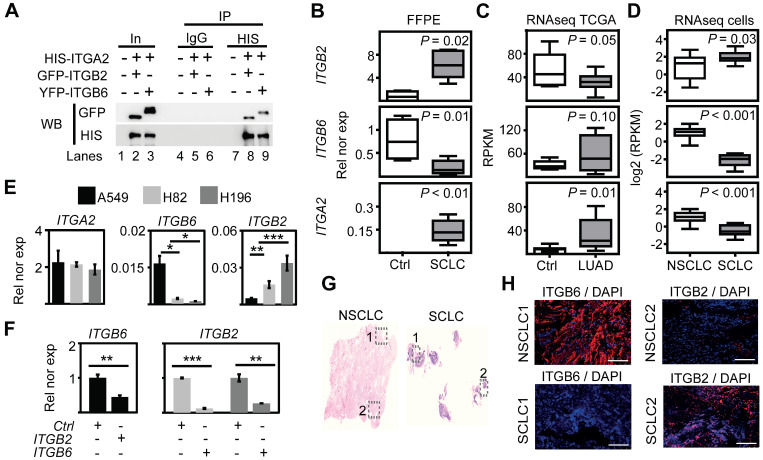
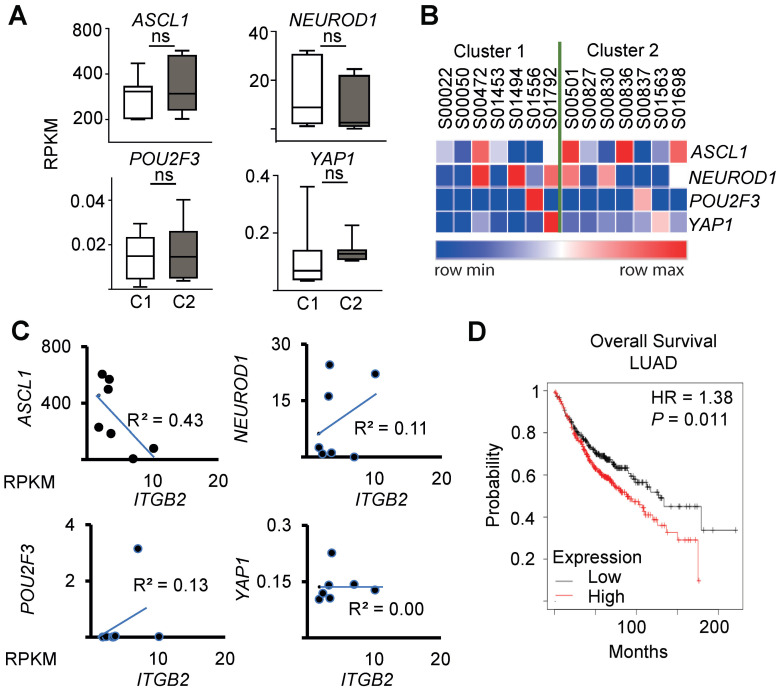
Background: Small cell lung cancer (SCLC) is an extremely aggressive cancer type with a patient median survival of 6-12 months. Epidermal growth factor (EGF) signaling plays an important role in triggering SCLC. In addition, growth factor-dependent signals and alpha-, beta-integrin (ITGA, ITGB) heterodimer receptors functionally cooperate and integrate their signaling pathways. However, the precise role of integrins in EGF receptor (EGFR) activation in SCLC remains elusive. Methods: We analyzed human precision-cut lung slices (hPCLS), retrospectively collected human lung tissue samples and cell lines by classical methods of molecular biology and biochemistry. In addition, we performed RNA-sequencing-based transcriptomic analysis in human lung cancer cells and human lung tissue samples, as well as high-resolution mass spectrometric analysis of the protein cargo from extracellular vesicles (EVs) that were isolated from human lung cancer cells. Results: Our results demonstrate that non-canonical ITGB2 signaling activates EGFR and RAS/MAPK/ERK signaling in SCLC. Further, we identified a novel SCLC gene expression signature consisting of 93 transcripts that were induced by ITGB2, which may be used for stratification of SCLC patients and prognosis prediction of LC patients. We also found a cell-cell communication mechanism based on EVs containing ITGB2, which were secreted by SCLC cells and induced in control human lung tissue RAS/MAPK/ERK signaling and SCLC markers. Conclusions: We uncovered a mechanism of ITGB2-mediated EGFR activation in SCLC that explains EGFR-inhibitor resistance independently of EGFR mutations, suggesting the development of therapies targeting ITGB2 for patients with this extremely aggressive lung cancer type.

Keywords: EGFR; KRAS; extracellular vesicles; integrin; small cell lung cancer.


Conflict of interest statement

Competing Interests: The authors have declared that no competing interest exists.

Figures

Figure 1
Figure 1
Mutual negative regulation of ITGB2 and ITGB6 levels in SCLC and NSCLC. (A) Protein extracts of MLE-12 cells co-transfected with ITGA2-HIS and ITGB2-YFP or ITGA2-HIS and ITGB6-GFP were immunoprecipitated (IP) using either immunoglobulin G (IgG, as control) or HIS-specific antibodies. Co-IP proteins were analyzed by WB using the indicated antibodies. In, input, 3% of material used for the IP. (B) Box plots of qRT-PCR-based expression analysis of indicated transcripts using RNA isolated from FFPE lung tissue sections from Ctrl (n = 4) and small cell-lung cancer (SCLC, n = 5) patients. Rel nor exp, relative normalized expression to GAPDH. (C) Box plots of RNA-seq-based expression analysis of indicated transcripts in matched control donors (Ctrl; n = 9) and matched lung adenocarcinoma (LUAD; n = 11) patients from the Cancer Genome Atlas (TCGA). Values were normalized using reads per kilobase per million (RPKM). (D) Box plots of RNA-seq-based expression analysis of indicated transcripts in non-small cell lung cancer (NSCLC; n = 34) and small cell lung cancer (SCLC; n = 17) cell lines. Values are represented as log2 RPKM. All box plots (B-D) indicate median (middle line), 25th, 75th percentile (box) and 5th and 95th percentile (whiskers); P-values after two-tailed t-test. (E) qRT-PCR-based expression analysis of indicated mRNA in A549, NCI-H82 and NCI-H196 cell lines. (F) qRT-PCR-based expression analysis of indicated mRNA in A549 cells (left panel) transfected with ITGB2 or NCI-H196 cells (right panel) transfected with ITGB6. In the bar plots (E-F), data are shown as means ± SD (n = 3); asterisks, P-values after two-tailed t-test, *** P ˂ 0.001; ** P ˂ 0.01; * P ˂ 0.05. (G) Hematoxylin and eosin staining in human lung tissue from NSCLC (left) and SCLC (right) patients. Squares are respectively shown in E at higher magnification. (H) Fluorescence microscopy after immunostaining using ITGB6 or ITGB2-specific antibodies in NSCLC and SCLC FFPE lung tissues (in G). DAPI, nuclear staining. Scale bar, 500 µm. Source data for all plots are provided as Source Data S1. See also Figure S1-S5 and Source Data S2.
Figure 2
Figure 2
Non-canonical ITGB2 signaling activates EGFR in SCLC. (A) Total protein extracts of A549, NCI-H82 and NCI-H196 cell lines transfected with ITGB2 or ITGB6 were analyzed by WB using the indicated antibodies. (B) Total protein extracts of A549 cells transfected with ITGB2, ligand-binding-deficient D134A ITGB2 mutant (mutITGB2) or Galectin-3-specific small interfering RNA (siGAL3) were analyzed by WB using the indicated antibodies. (C) Confocal microscopy after immunostaining with specific antibodies against EGFR, pEGFR, ITGB2 and ITGB6 in NCI-H196 and A549 cells. DAPI, nucleus. Scale bars, 10 μm. (D) Schematic representation of a EGFR-dimer highlighting specific key amino acid residues, including phosphorylation sites in two p38 target regions (R1 and R2; 39) that were mutated in two expression constructs MutR1 and MutR2. (E) Total protein extracts of NCI-H196 cell lines were analyzed by WB using the indicated antibodies. NCI-H196 cells were transiently transfected with control empty plasmid (Ctrl), or constructs for expression of MYC-tagged wild-type EGFR (EGFR-WT) or EGFR mutants, in which either S1015, T1017 and S1018 were mutated to alanine (MutR1); or S1046 and S1047 were mutated to alanine (MutR2) alone or in combination (MutR1R2). Exogenous EGFR (exoEGFR) was differentiated from endogenous EGFR (endoEGFR) using MYC-tag-specific antibodies. See also Figure S1-S5 and Source Data S2.
Figure 3
Figure 3
ITGB2 induces a novel SCLC gene expression signature. (A) Correlogram showing the correlation score matrix (RPKM values, Spearman correlation coefficient) across RNA-seq data of lung tissue of SCLC patients from the European Genome Archive (EGAS00001000299). SCLC patients were grouped in cluster 1 (C1) and cluster 2 (C2). (B) Bubble plot of top six enrichment of Reactome pathways in C2 by Overrepresentation Analysis (ORA). P-values after two-tailed t-test are shown by different color, the size of bubble indicate the gene count of each pathway. Sig., signaling; int., interactions; chemok., chemokine; rec., receptor. (C) Gene Set Enrichment Analysis (GSEA) using the fold change of genes inside the integrin pathway in B. ES, enrichment score; P-value after two-tailed t-test. (D) Box plots of RNA-seq-based expression analysis of indicated transcripts in SCLC patients C1 (n = 7) and C2 (n = 7). Values are represented as log2 RPKM. Nor exp, normalized expression to GAPDH. Box plots indicate median (middle line), 25th, 75th percentile (box) and 5th and 95th percentile (whiskers); P-values after two-tailed t-test. Source data are provided as Source Data S1. (E) Venn diagram comparing transcripts that were significantly increased in SCLC patients C2 compared to C1 (FC ≥ 3; P ≤ 0.05 after two-tailed t-test), NCI-H196 cells, A549 cells transfected either with ITGB2 or mutITGB2 (for all 3 cell lines, coding transcripts; FC ≥ 1.15; P ≤ 0.05 after two-tailed t-test) highlights a group of 93 transcripts that are common in all four groups, the SCLC-ITGB2 gene expression signature (SCLC-ITGB2-sig). See also Table S4. (F) Hierarchical heatmap using RPKM of all 93 IDs of the SCLC-ITGB2-sig comparing SCLC patients in C1 to C2. Hierarchical clustering was performed using Person's correlation based distance and average linkage. (G) External validation of the SCLC-ITGB2-sig. GSEA using independent RNA-seq data from SCLC cell lines comparing the conventional SCLC signature in KEGG (left) versus the SCLC-ITGB2-sig (right) identified in E. ES, enrichment score; FDR, false discovery rate. See also Figure S6 and S7.
Figure 4
Figure 4
SCLC-ITGB2 gene expression signature occurs in all SCLC subtypes. (A) Box plots of RNA-seq-based expression analysis of the transcripts used for SCLC subtype classification (ASCL1, NEUROD1, POU2F3 and YAP1) , in SCLC patients C1 (n = 7) and C2 (n = 7). Values are represented as log2 RPKM. Nor exp, normalized expression to GAPDH. Box plots indicate median (middle line), 25th, 75th percentile (box) and 5th and 95th percentile (whiskers); P-values after two-tailed t-test. Source data are provided as Source Data S1. (B) Heat map representing the RNA-seq-based expression levels of the indicated transcripts in SCLC patients C1 (n = 7) and C2 (n = 7). Blue, low expression; red, high expression. (C) Correlation analysis between ITGB2 and ASCL1, NEUROD1, POU2F3 and YAP1 by linear regression of relative normalized expression from RNA-seq-based expression analysis of indicated transcripts in SCLC patients C1 (n = 7) and C2 (n = 7). (D) Overall survival rates by Kaplan-Meier plotter of LUAD patients expressing low (n = 300) or high (n = 372) SCLC-ITGB2-sig (127 vs 88.7 months, respectively, P = 0.011 after after Log Rank test). HR, hazard ratio. See also Figure S6 and S7.
Figure 5
Figure 5
Non-canonical ITGB2 signaling activates RAS/MAPK/ERK signaling. (A) Gene Ontology (GO)-based enrichment analysis of biological pathways in the 93 IDs of the SCLC-ITGB2 gene expression signature (SCLC-ITGB2-sig) from Figure 3E using Webgestalt bioinformatics tool and plotted by highest enrichment ratio. Reg., regulation. (B) GSEA line profiles of SCLC-ITGB2-sig in RAS (Panther) and MAPK signaling pathways (KEGG). P-values after two-tailed t-test. (C) RAS activation assay. Protein extracts of A549, NCI-H196 and NCI-H82 were immunoprecipitated (IP) using a KRAS-specific antibody (KRAS) or RAF-RBD (RBD, active KRAS) coated beads. Co-IP proteins were analyzed by WB using the indicated antibodies. In, input, 5% of material used for the IP. (D) Total protein extracts of A549 cells transfected with ITGB2 or ligand-binding-deficient D134A ITGB2 mutant (mutITGB2) were analyzed by WB using the indicated antibodies. pEGFR, active phosphorylated epidermal growth factor receptor; pMAPK, phosphorylated mitogen-activated protein kinase; pRAF1, phosphorylated proto-oncogene serine/threonine-protein kinase; pERK, phosphorylated extracellular signal-regulated kinase. (E) Total protein extracts of NCI-H82 and NCI-H196 cells transfected with small interfering RNA specific for ITGB2 (siITGB2) or KRAS (siKRAS) were analyzed by WB using the indicated antibodies. Vimentin (VIM) as product of a downstream gene target of EGF signaling is highlighted in green. See also Source Data S2.
Figure 6
Figure 6
Different multimeric protein complexes sequentially occur during non-canonical ITGB2-mediated activation of KRAS/MAPK/ERK signaling in SCLC. (A) Total protein extracts of A549 cells transfected with empty vector (Ctrl) or ITGB2 were immunoprecipitated (IP) using either immunoglobulin G (IgG, as control) or ITGB6 and ITGB2-specific antibodies. Co-IP proteins were analyzed by WB using the indicated antibodies. Input, 5% of material used for the IP. Squares indicate conditions in which endogenous ITGB6 interacts with inactive EGFR (green) and overexpressed ITGB2 interacts with active pEGFR (gold). (B) Total protein extracts of NCI-H196 cells transfected with empty vector (Ctrl) or ITGB6 were immunoprecipitated (IP) using either immunoglobulin G (IgG, as control) or ITGB2-specific antibodies. Co-IP proteins were analyzed by WB using the indicated antibodies. Input, 5% of material used for the IP. Gold square indicates conditions in which endogenous ITGB2 interacts with endogenous, active pEGFR. (C) Protein extracts of NCI-H196 cells transfected with small interfering RNA specific for ITGB2 (siITGB2), GAL3 (siGAL3) or KRAS (siKRAS) were immunoprecipitated (IP) using either immunoglobulin G (IgG, as control) or EGFR-specific antibodies. Co-IP proteins were analyzed by WB using the indicated antibodies. In, input, 5% of material used for the IP. Gold square indicates conditions showing the ITGB2-pEGFR-interaction is specific and GAL3- and KRAS-dependent. (D) RAS activation assay. Protein extracts of A549 cells transfected with ITGB2 or ligand-binding-deficient D134A ITGB2 mutant (mutITGB2) and siGAL3 were immunoprecipitated (IP) using KRAS-specific antibody (KRAS) or RAF-RBD (RBD, active KRAS) coated beads. Co-IP proteins were analyzed by WB using the indicated antibodies. In, input, 5% of material used for the IP. Gold square highlights conditions in which KRAS interacts with ITGB2, mutITGB2, GAL3, EGFR and pEGFR in GAL3-dependent manner. Magenta square highlights conditions in which active, GTP-bound KRAS interacts with ITGB2, mutITGB2, GAL3 and EGFR, but not with pEGFR. (E) Model. Left, endogenous ITGB6 interacts with EGFR in the NSCLC cell line A549. Middle, endogenous ITGB2 interacts with endogenous pEGFR in the SCLC cell line NCI-H196, or in A549 cells after ITGB2 or mutITGB2 transfection. Further, results from RAS activation assays indicate the formation of a multimeric protein complex in two different forms, one form containing ITGB2, pEGFR, GAL3 and inactive, GDP-bound KRAS (middle) and the other form containing ITGB2, EGFR, GAL3 and active, GTP-bound KRAS (right), both forms occurring in sequential order during non-canonical ITGB2-mediated activation of KRAS/MAPK/ERK signaling in SCLC. See also Source Data S2.
Figure 7
Figure 7
Extracellular vesicles containing ITGB2 activate RAS/MAPK/ERK signaling and induce SCLC proteins. (A) Reactome-based enrichment analysis of significant pathways in the 93 IDs of the SCLC-ITGB2 gene expression signature (SCLC-ITGB2-sig) from Figure 3E using Webgestalt bioinformatics tool and plotted by highest enrichment ratio. Int., interactions; metab., metabolism. (B) RNA-seq-based expression analysis of indicated transcripts in non-small cell lung cancer (NSCLC; n = 33) and small cell lung cancer (SCLC; n = 17) cell lines. Values were normalized to GAPDH and represented as log2 of reads per kilobase per million (RPKM). Bar plots show data as means; error bars, SD. (C) Scheme of experiments with EVs isolated from the cell culture medium of NSCLC and SCLC cell lines. Characterization of the protein cargo of the isolated EVs by high-resolution mass spectrometry (HRMS) analysis. Characterization of human precision-cut lung slices (hPCLS) that were treated with isolated EVs. (D) Venn diagram comparing proteins that were detected by HRMS in EVs from control transfected A549 cells, NCI-H196 cells, as well as from A549 cells transfected either with ITGB2 or mutITGB2 highlights a group of 189 proteins that are common for the last 3 conditions. See also Table S5. (E) Panther-based enrichment analysis of significant pathways in the 189 proteins highlighted in D, using Webgestalt bioinformatics tool and plotted by highest significance enrichment ratio. (F) Total protein extracts of EVs from A549 cells transfected with ITGB2 or mutITGB2 were analyzed by WB using the indicated antibodies. (G) Confocal microscopy after immunostaining with specific antibodies against ITGB2 in hPCLS incubated with EVs from A549 cells previously transfected with Ctrl or ITGB2. DAPI, nucleus. Scale bars, 500 μm. (H) Total protein extracts of hPCLS incubated with EVs from A549 cells previously transfected with ITGB2 or mutITGB2 alone or in combination with binase were analyzed by WB using the indicated antibodies. Products of downstream gene targets of EGF signaling (green) and SCLC proteins (red) are highlighted. See also Figure S8, S9 and Data Source S2.
Figure 8
Figure 8
ITGB2 loss-of-function and binase inhibit SCLC. (A) Total protein extracts of EVs from NCI-H196 cells transfected with control or ITGB2-specific small interfering RNA (siCtrl or siITGB2), or treated with binase, were analyzed by WB using the indicated antibodies. (B) Left, cell proliferation of hPCLS co-cultured without or with NCI-H196 cells previously transfected with siITGB2 or treated with binase was measured by the colorimetric method using BrdU incorporation (top) cell number quantification (bottom). Data are shown as means ± SD (n = 3 independent experiments); asterisks, P-values after two tailed t-test, *** P ˂ 0.001; ** P ˂ 0.01; * P ˂ 0.05. Right, representative live microscopy images to the bar plots. Quadrants used for quantification are indicated. Scale bars, 500 μm. (C) Confocal microscopy after immunostaining with specific antibodies against ITGB2 and VIM in hPCLS incubated with EVs from A549 cells previously transfected with ITGB2 and non-treated or treated with binase. DAPI, nucleus. Scale bars, 500 μm. Squares are respectively shown below at higher magnification. (D) Total protein extracts of hPCLS incubated with EVs from NCI-H196 cells previously transfected with siCtrl or siITGB2 alone or in combination with binase were analyzed by WB using the indicated antibodies. Products of downstream gene targets of EGF signaling (green) and SCLC proteins (red) are highlighted. (E) Model. In SCLC, high ITGB2 induces a KRAS-driven secretory phenotype of ITGB2/ITGA2 loaded EVs, which total protein cargo induces a SCLC-like phenotypic transformation in normal cells. See also Figure S10, S11 and Source Data S1 and S2.

References

    1. Mehta A, Dobersch S, Romero-Olmedo AJ, Barreto G. Epigenetics in lung cancer diagnosis and therapy. Cancer Metastasis Rev. 2015;34(2):229–41. - PubMed
    1. Blandin Knight S, Crosbie PA, Balata H, Chudziak J, Hussell T, Dive C. Progress and prospects of early detection in lung cancer. Open Biol. 2017;7(9):170070. - PMC - PubMed
    1. Herbst RS, Heymach JV, Lippman SM. Lung cancer. N Engl J Med. 2008;359:1367–80. - PMC - PubMed
    1. Sabari JK, Lok BH, Laird JH, Poirier JT, Rudin CM. Unravelling the biology of SCLC: implications for therapy. Nat Rev Clin Oncol. 2017;14:549–61. - PMC - PubMed
    1. Tartarone A, Giordano P, Lerose R, Rodriquenz MG, Conca R, Aieta M. Progress and challenges in the treatment of small cell lung cancer. Med Oncol. 2017;34:110. - PubMed

Publication types