. 2023 Apr 29;19(8):2409-2427.
doi: 10.7150/ijbs.79461. eCollection 2023.

Brain-derived extracellular vesicles promote bone-fat imbalance in Alzheimer's disease

Affiliations

Brain-derived extracellular vesicles promote bone-fat imbalance in Alzheimer's disease

Xixi Liu et al. Int J Biol Sci. .

Abstract

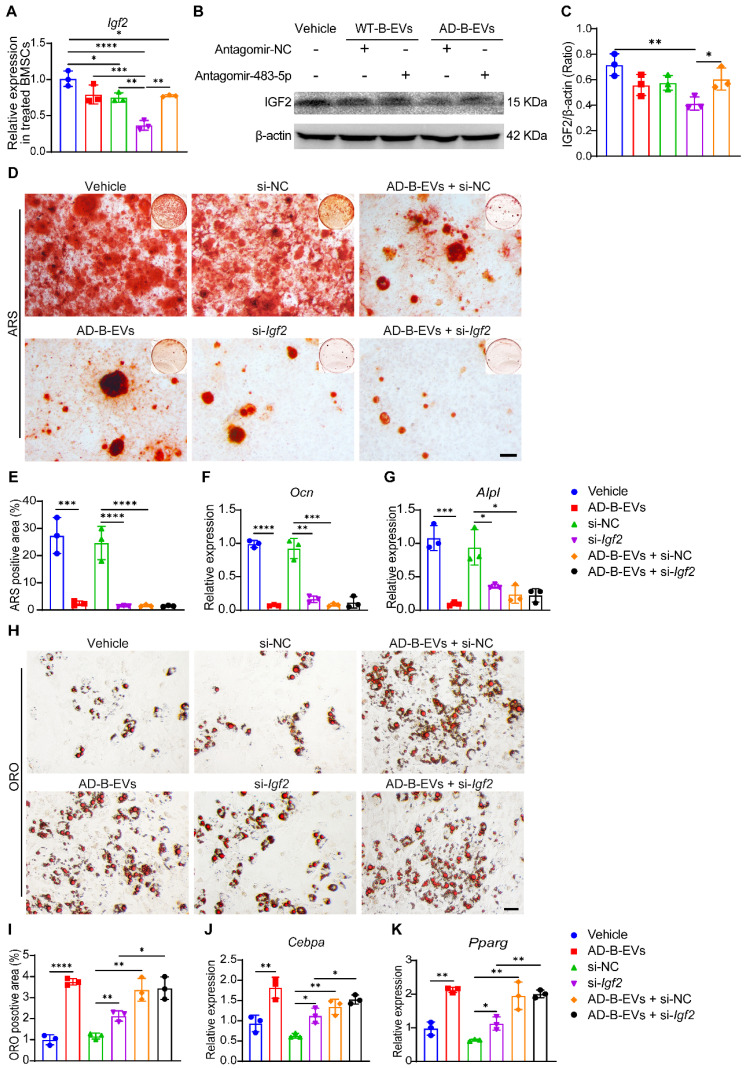
Inadequate osteogenesis and excessive adipogenesis of bone marrow mesenchymal stem cells (BMSCs) are key factors in the pathogenesis of osteoporosis. Patients with Alzheimer's disease (AD) have a higher incidence of osteoporosis than healthy adults, but the underlying mechanism is not clear. Here, we show that brain-derived extracellular vesicles (EVs) from adult AD or wild-type mice can cross the blood-brain barrier to reach the distal bone tissue, while only AD brain-derived EVs (AD-B-EVs) significantly promote the shift of the BMSC differentiation fate from osteogenesis to adipogenesis and induce a bone-fat imbalance. MiR-483-5p is highly enriched in AD-B-EVs, brain tissues from AD mice, and plasma-derived EVs from AD patients. This miRNA mediates the anti-osteogenic, pro-adipogenic, and pro-osteoporotic effects of AD-B-EVs by inhibiting Igf2. This study identifies the role of B-EVs as a promoter of osteoporosis in AD by transferring miR-483-5p.

Keywords: Alzheimer's disease; adipogenesis; extracellular vesicles; miR-483-5p; osteoporosis.


Conflict of interest statement

Competing Interests: The authors have declared that no competing interest exists.

Figures

Figure 1
Figure 1
Identification and distribution of B-EVs. (A) Morphology of WT- and AD-B-EVs under transmission electron microscopy. Scale bar: 100 nm. (B) Particle size distribution of WT- and AD-B-EVs. (C) Western blot analysis of exosomal markers in WT- and AD-B-EVs. (D) BMSC phagocytosis of PKH26-labeled WT- and AD-B-EVs under fluorescence microscope. Scale bar: 20 μm. (E) CCK-8 assay showing the viability of BMSCs after treatment with WT-B-EVs or AD-B-EVs for 48 h. n=3 per group. (F) Ex vivo fluorescent imaging and (G) quantification of fluorescent signals in the brain, bone, heart, liver, spleen, lungs, and kidneys from mice intracerebroventricularly or intravenously injected with DiR-labeled WT- and AD-B-EVs for 24 h. Scale bar: 5 mm. n = 3 per group. (H) Fluorescence microscopy images and (I) quantification of fluorescence intensity of femur tissue sections from mice intracerebroventricularly or intravenously injected with DiI-labeled AD-B-EVs for 24 h. TB: trabecular bone; BM: bone marrow. Scale bar: 50 μm. n = 3 per group. The data are shown as the mean ± SD. For panel (E), (G), and (I): one-way ANOVA with Bonferroni post hoc correction. *p < 0.05.
Figure 2
Figure 2
AD-B-EVs and AD-P-EVs shift BMSC fate from osteogenesis toward adipogenesis. (A) Alizarin Red S (ARS) staining of mineralized nodules of BMSCs receiving treatments of vehicle, WT-B-EVs, or AD-B-EVs under osteogenic inductive conditions. Scale bar: 100 μm. n = 3 per group. (B) The percentages of ARS-positive staining areas in (A). (C, D) qRT-PCR analysis of the genes related to osteogenesis (Ocn and Alpl). (E) Oil red O (ORO) staining of BMSCs receiving treatments of vehicle, WT-B-EVs, or AD-B-EVs under adipogenic inductive conditions. Scale bar: 50 μm. n = 3 per group. (F) Measurement of the percentages of ORO-positive area in E. (G, H) qRT-PCR analysis of the genes related to adipogenesis (Cebpa and Pparg). (I) ARS staining of mineralized nodules of BMSCs receiving treatments of vehicle, cognitively normal subject-plasma-EVs (Four donors, named CN subject 1-CN subject 4), or AD-plasma-EVs (Four donors, named AD patient 1-AD patient 4) under osteogenic inductive conditions. Scale bar: 100 μm. n = 3 per group. (J, K) The percentages of ARS positively stained areas were measured (J: Treatment of every donor's P-EVs was compared with the Vehicle group; K: The comparison between CN and AD group). (L) ORO staining of BMSCs receiving treatments of vehicle, CN subject-P-EVs, or AD-P-EVs under adipogenic inductive conditions. Scale bar: 50 μm. n = 3 per group. (M) and (N) Measurement of the percentages of ORO-positive area (M: Treatment of every donor's P-EVs was compared with the Vehicle group; N: The comparison between CN and AD group). The data are shown as the mean ± SD. For panel (B-D) and (F-H): one-way ANOVA with Bonferroni post hoc correction. For panel (J), (K), (M), and (N): unpaired, two-tailed Student's t-test. *p < 0.05, **p < 0.01, ***p < 0.001.
Figure 3
Figure 3
AD-B-EVs induce bone loss and marrow adiposity. (A) Experimental design for testing the impact of tail vein injection of AD-B-EVs on the bone. Four-month-old C57BL/6 mice were treated with vehicle, WT-B-EVs, or AD-B-EVs once a week for 8 weeks (8 times within 60 days). (B) Representative μCT images of femora. Scale bars: 1 mm. (C-G) Quantitative μCT analysis of the bone mineral density (BMD), trabecular bone volume fraction (Tb. BV/TV), trabecular number (Tb. N), trabecular separation (Tb. Sp), trabecular thickness (Tb. Th). n = 10 per group. (H-J) Calcein double labeling of trabecular bones (H) with quantification of MAR and BFR/BS (I, J). Scale bar: 20 μm. n = 4 per group. (K) Representative OCN-stained sections and (L) numbers of OCN-stained osteoblasts (N. OBs) on trabecular bone surface in distal femurs. Scale bar: 20 μm. n = 6 per group. (M) ELISA for serum OCN. n = 5 per group. (N) Immunostaining images for perilipin A in distal femurs and (O) quantification of adipocyte number. Scale bar: 100 μm (Perilipin A), 20 μm (magnified images). n = 5 per group. (P) Representative TRAP staining images. (Q) Quantitative analysis of the numbers of TRAP-positive osteoclasts. n = 6 per group. (R) ELISA of the serum concentration of CTX-I. n = 5 per group. The data are shown as the mean ± SD. All dot plots: one-way ANOVA with Bonferroni post hoc correction. *p < 0.05, **p < 0.01, ***p < 0.001, ****p < 0.0001.
Figure 4
Figure 4
MiR-483-5p is highly enriched in B-EVs from AD subjects and negatively correlated with bone mass in AD patients. (A) Venn diagram of upregulated and downregulated miRNAs in AD patients compared with CN subjects and those shared by brain-derived EVs and peripheral EVs. (B) Histogram showing fold changes in miRNAs shared by brain-derived EVs and peripheral EVs. (C) qRT-PCR analysis of miR-483-5p expression in different tissues in WT or AD mice. n = 5 per group. (D) Relative expression of miR-483-5p in B-EVs and EVs derived from heart and liver. n = 5 per group. (E) Characteristics of patients with AD and CN subjetcts recruited in this study. (F) Relative expression of miR-483-5p in human P-EVs. n = 20 per group. (G) Plasma exosomal miR-483-5p levels in AD patients with different bone mass. (H) Relationship between plasma exosomal miR-483-5p level and BMD (T-Score) of the femoral neck in AD patients. The data are shown as the mean ± SD. For panel (C), (D), and (F): unpaired, two-tailed Student's t-test. For panel (G): one-way ANOVA with Bonferroni post hoc correction. For panel (H): linear regression model. *p < 0.05, **p < 0.01, ***p < 0.001.
Figure 5
Figure 5
MiR-483-5p mediates the anti-osteogenic and pro-adipogenic effects of AD-B-EVs on BMSCs. (A) Expression of miR-483-5p in BMSCs treated with vehicle or AD-B-EVs. (B) Flow cytometric detection of the transfection efficiency of Cy3- labeled AntagomiR-NC to AD-B-EVs. (C) CCK-8 assay showing the viability of BMSCs after treated with vehicle, AD-B-EVs + AntagomiR-NC, and AD-B-EVs + AntagomiR-483-5p for 48 h. (D) ARS staining imaging of BMSCs treated with vehicle, WT-B-EVs + AntagomiR-NC, WT-B-EVs + AntagomiR-483-5p, AD-B-EVs + AntagomiR-NC, and AD-B-EVs + AntagomiR-483-5p under osteogenic inductive conditions. Scale bar: 100 μm. n = 3 per group. (E) Quantitation of the percentages of ARS positive area. n = 3 per group. (F) ORO staining imaging of BMSCs treated with vehicle, WT-B-EVs + AntagomiR-NC, WT-B-EVs + AntagomiR-483-5p, AD-B-EVs + AntagomiR-NC, and AD-B-EVs + AntagomiR-483-5p under adipogenic inductive conditions. Scale bar: 50 μm. n = 3 per group. (G) Quantitation of the percentages of ORO-positive area. n = 3 per group. The data are shown as the mean ± SD. For panel (A): unpaired, two-tailed Student's t-test. For other dot plots: one-way ANOVA with Bonferroni post hoc correction. *p < 0.05, **p < 0.01, ***p < 0.001, ****p < 0.0001.
Figure 6
Figure 6
MiR-483-5p contributes to AD-B-EV-induced promotion of bone loss and marrow adiposity. (A) Experimental design for testing the impact of intravenous injection of antagomiR-483-5p-pretreated AD-B-EVs on bone metabolism. Four-month-old mice were treated with vehicle, AD-B-EVs + AntagomiR-NC, or AD-B-EVs + AntagomiR-483-5p once a week for 8 weeks (8 times within 60 days). (B) Representative μCT images of femora. Scale bars: 1 mm. (C-G) Quantitative μCT analysis of the BMD, Tb. BV/TV, Tb. N, Tb. Sp, and Tb. Th. n = 10 per group. (H-J) Calcein double labeling of trabecular bones (H) with quantification of MAR and BFR/BS (I, J). Scale bar: 20 μm. n = 4 per group. (K) Representative OCN-stained sections and (L) numbers of OCN-stained osteoblasts on trabecular BS in distal femurs. Scale bar: 20 μm. n = 6 per group. (M) ELISA for serum OCN. n = 5 per group. (N) Immunostaining images for perilipin A in distal femurs and (O) quantification of adipocyte number. Scale bar: 100 μm (Perilipin A), 20 μm (magnified images). n = 5 per group. (P) Representative TRAP staining images. Scale bar: 20 μm. (Q) Quantitative analysis of the number of osteoclasts. n = 6 per group. (R) ELISA of the serum concentration of CTX-I. n = 5 per group. The data are shown as the mean ± SD. For all dot plots: one-way ANOVA with Bonferroni post hoc correction. *p < 0.05, **p < 0.01, ***p < 0.001, ****p < 0.0001.
Figure 7
Figure 7
AD brain exosomal miR-483-5p targets Igf2 to modulate BMSC fate. (A) qRT-PCR analysis of Igf2 mRNA levels in BMSCs treated with vehicle, WT-B-EVs + AntagomiR-NC, WT-B-EVs + AntagomiR-483-5p, AD-B-EVs + AntagomiR-NC, and AD-B-EVs + AntagomiR-483-5p. (B) Western blot images and (C) relative quantification of IGF2 protein in BMSCs with different treatments. n = 3 per group. (D) ARS staining imaging of BMSCs receiving different treatments under osteogenic inductive conditions and (E) quantification of ARS-positive area. Scale bar: 100 μm. n = 3 per group. (F, G) qRT-PCR analysis of the genes related to osteogenesis (Ocn and Alpl). (H) ORO staining images of BMSCs receiving different treatments under adipogenic inductive conditions. Scale bar: 50 μm. n = 3 per group. (I) Quantitation of the percentages of ORO-positive area. n = 3 per group. (J, K) qRT-PCR analysis of the genes related to adipogenesis (Cebpa and Pparg). n = 3 per group. The data are shown as the mean ± SD. For all dot plots: one-way ANOVA with Bonferroni post hoc correction. *p < 0.05, **p < 0.01, ***p < 0.001, ****p < 0.0001.
Figure 8
Figure 8
Schematic diagram shows the mode of AD-B-EVs regulating the fate of BMSC differentiation from osteogenesis to adipogenesis and inducing bone loss and bone marrow obesity. In Alzheimer's disease, B-EVs were transported to the distal bone, and target BMSCs to inhibit osteogenesis and promote adipogenesis. MiR-483-5p contributes to the AD brain-derived EVs-induced promotion of bone loss and marrow adiposity by inhibiting IGF2.

Similar articles

Cited by

References

    1. Scheltens P, De Strooper B, Kivipelto M, Holstege H, Chetelat G, Teunissen CE. et al. Alzheimer's disease. Lancet (London, England) 2021;397:1577–90. - PMC - PubMed
    1. Masters CL, Bateman R, Blennow K, Rowe CC, Sperling RA, Cummings JL. Alzheimer's disease. Nat Rev Dis Primers. 2015;1:15056. - PubMed
    1. Pu Z, Tang X, Fei Y, Hou Q, Lin Y, Zha X. Bone metabolic biomarkers and bone mineral density in male patients with early-stage Alzheimer's disease. Eur Geriatr Med. 2020;11:403–8. - PubMed
    1. Liu D, Zhou H, Tao Y, Tan J, Chen L, Huang H. et al. Alzheimer's Disease is Associated with Increased Risk of Osteoporosis: The Chongqing Aging Study. Current Alzheimer research. 2016;13:1165–72. - PubMed
    1. Compston JE, McClung MR, Leslie WD. Osteoporosis. Lancet (London, England) 2019;393:364–76. - PubMed

Publication types