. 2023 May 8;19(8):2551-2571.
doi: 10.7150/ijbs.83824. eCollection 2023.

Comprehensive Analyses Reveal Effects on Tumor Immune Infiltration and Immunotherapy Response of APOBEC Mutagenesis and Its Molecular Mechanisms in Esophageal Squamous Cell Carcinoma

Affiliations

Comprehensive Analyses Reveal Effects on Tumor Immune Infiltration and Immunotherapy Response of APOBEC Mutagenesis and Its Molecular Mechanisms in Esophageal Squamous Cell Carcinoma

Jie Yang et al. Int J Biol Sci. .

Abstract

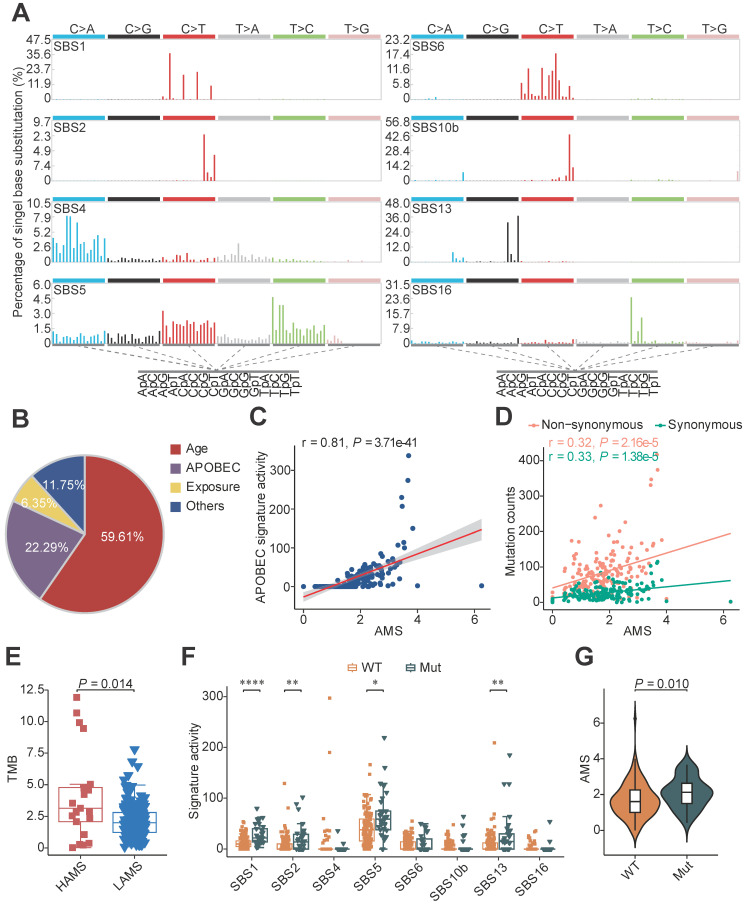
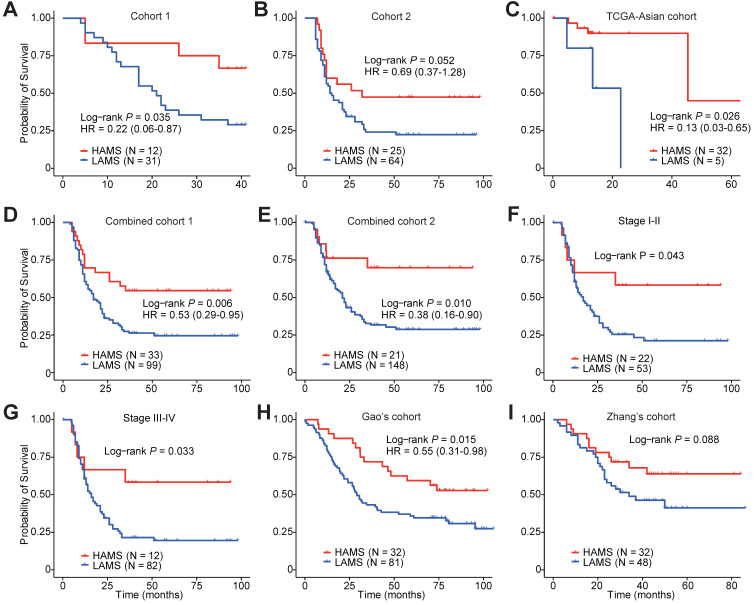
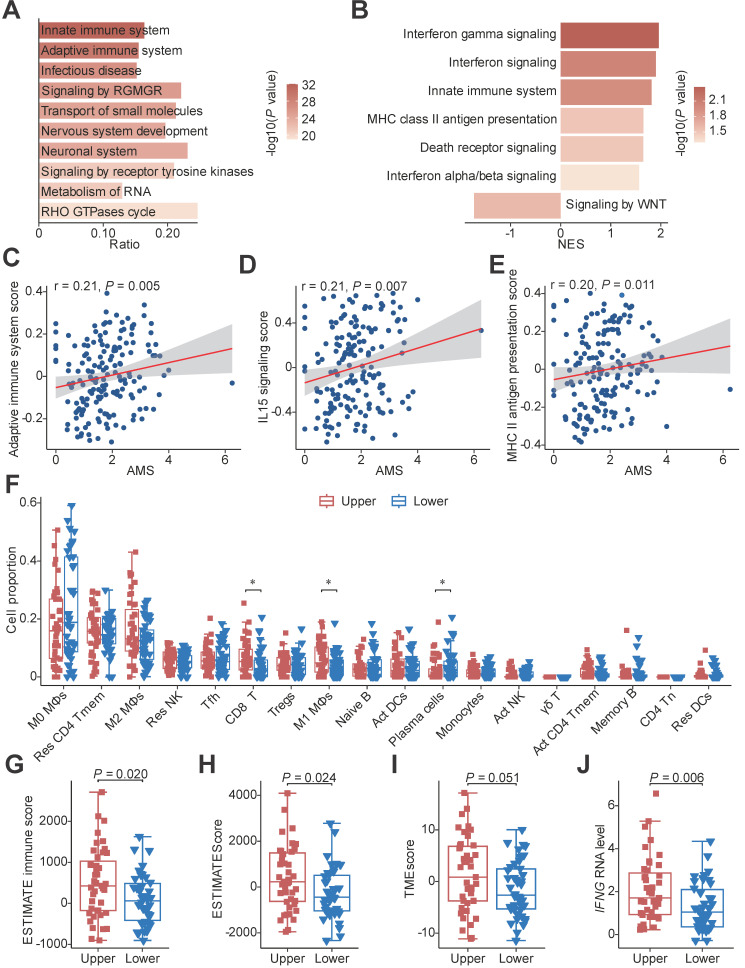
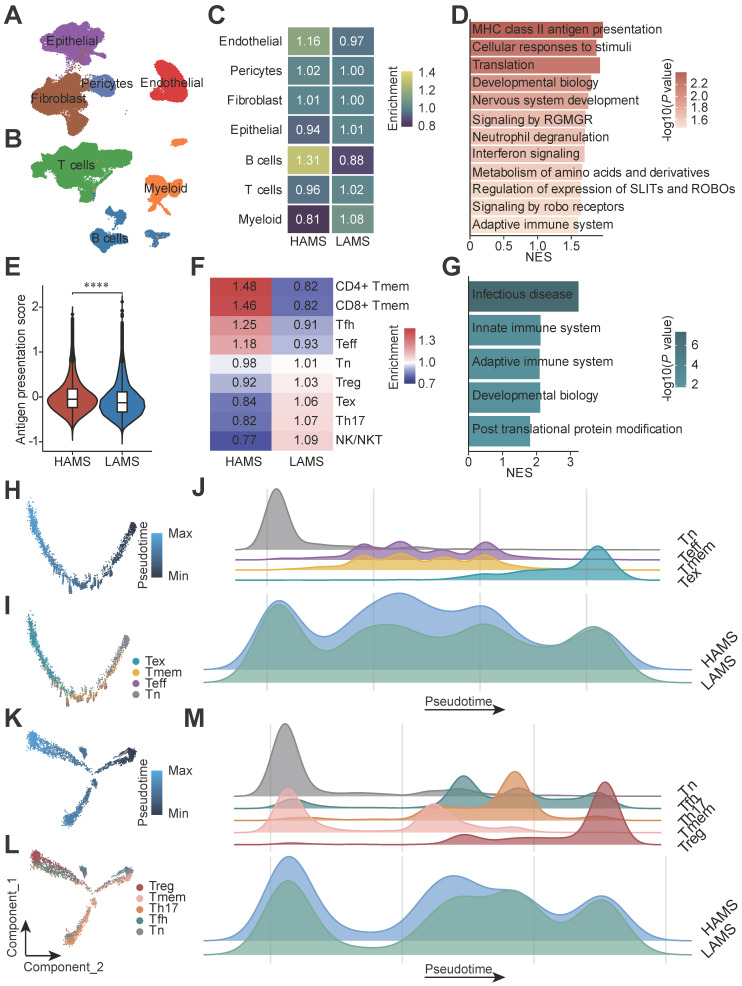
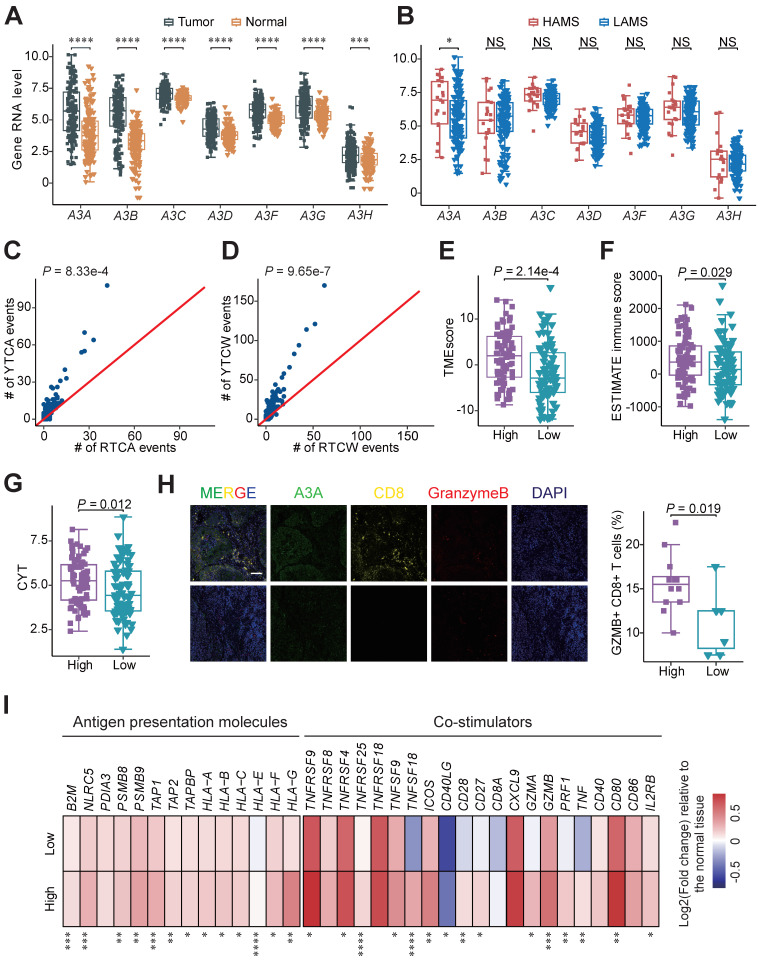
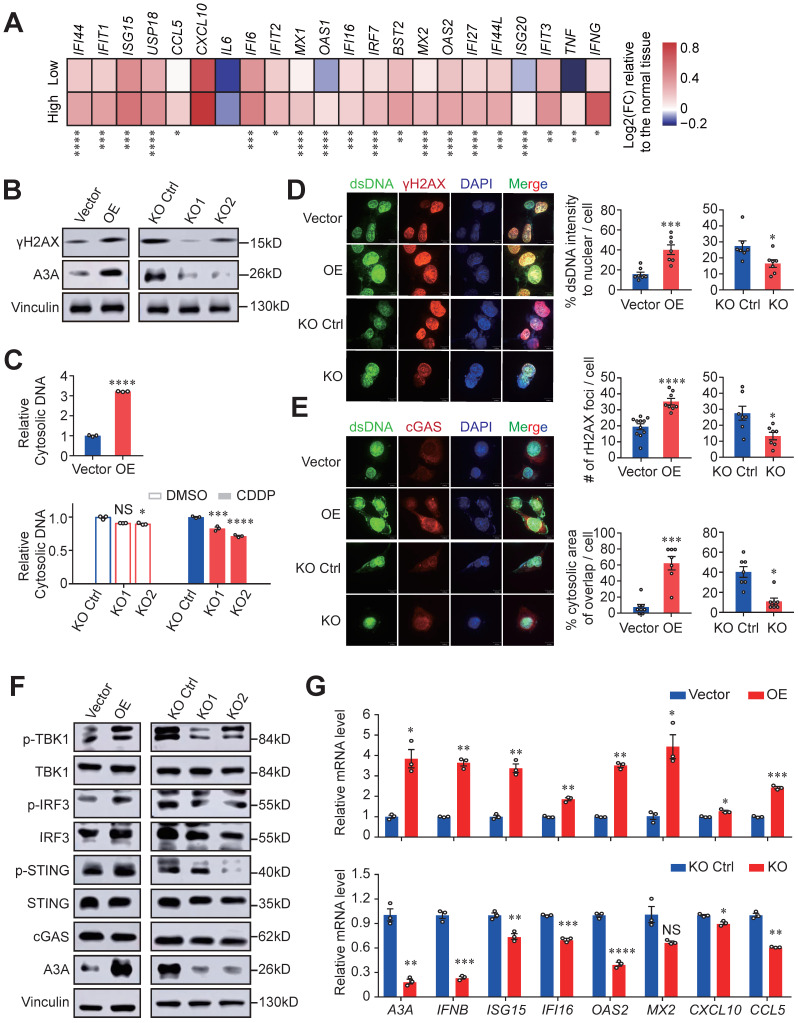
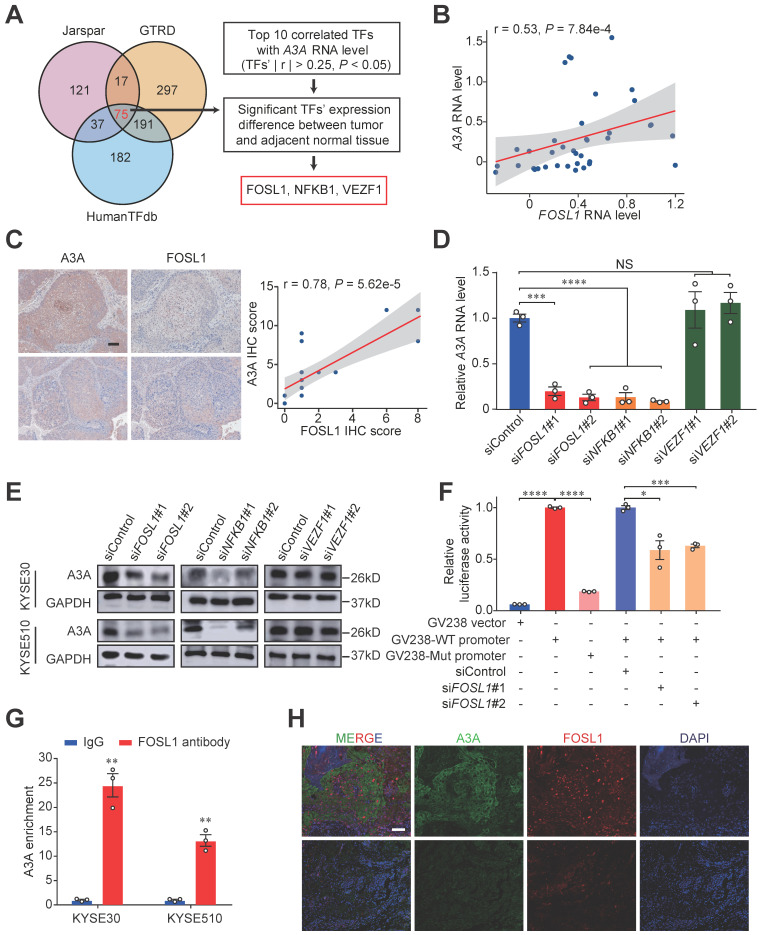
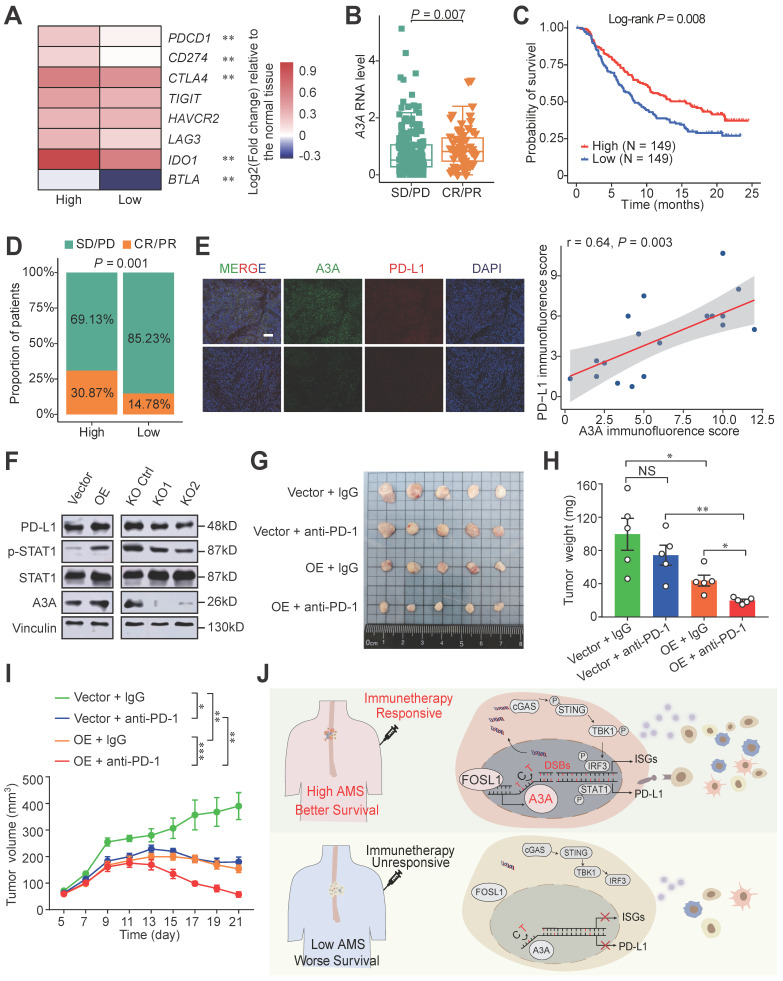
The apolipoprotein B mRNA editing enzyme catalytic polypeptide (APOBEC) mutagenesis is prevalent in esophageal squamous cell carcinoma (ESCC). However, the functional role of APOBEC mutagenesis has yet to be fully delineated. To address this, we collect matched multi-omics data of 169 ESCC patients and evaluate characteristics of immune infiltration using multiple bioinformatic approaches based on bulk and single-cell RNA sequencing (scRNA-seq) data and verified by functional assays. We find that APOBEC mutagenesis prolongs overall survival (OS) of ESCC patients. The reason for this outcome is probably due to high anti-tumor immune infiltration, immune checkpoints expression and immune related pathway enrichment, such as interferon (IFN) signaling, innate and adaptive immune system. The elevated AOBEC3A (A3A) activity paramountly contributes to the footprints of APOBEC mutagenesis and is first discovered to be transactivated by FOSL1. Mechanistically, upregulated A3A exacerbates cytosolic double-stranded DNA (dsDNA) accumulation, thus stimulating cGAS-STING pathway. Simultaneously, A3A is associated with immunotherapy response which is predicted by TIDE algorithm, validated in a clinical cohort and further confirmed in mouse models. These findings systematically elucidate the clinical relevance, immunological characteristics, prognostic value for immunotherapy and underlying mechanisms of APOBEC mutagenesis in ESCC, which demonstrate great potential in clinical utility to facilitate clinical decisions.

Keywords: APOBEC signature; APOBEC3A; esophageal squamous cell carcinoma; immune; immunotherapy.


Conflict of interest statement

Competing Interests: The authors have declared that no competing interest exists.

Figures

Figure 1
Figure 1
Mutational signatures analysis in ESCC. (A) Eight distinct mutational signatures were identified in 169 ESCC tumors. The x-axis denoted the 96 types of trinucleotide context sequence, and the y-axis denoted the percentage of the detected signature. (B) Pie charts showing the percentage of mutations assigned to each signature in ESCC described in A. Age: SBS1 and SBS5; APOBEC: SBS2 and SBS13; Exposure: smoking-related SBS4 and drinking-related SBS16; Others: SBS6 and SBS10b. (C) Scatter plot showing positive correlation between AMS and APOBEC signature activity. (D) AMS was positively correlated with both non-synonymous (pink) and synonymous (green) mutation counts in ESCC. (E) Boxplot showing TMB comparison between different AMS groups. TMB was measured by the counts of non-synonymous SNVs and indels per megabase. (F) Boxplots showing mutational signature activitity described in A across patients with or without somatic mutations in DDR genes. WT: wild type; Mut: mutant. The P value of Wilcoxon rank sum test represented the significance. * indicating P < 0.05, ** indicating P < 0.01, *** indicating P < 0.001, **** indicating P < 0.0001. (G) Violin plot showing AMS difference across patients with at least one or without somatic mutations in DDR genes. Boxplots in (E-F) displayed the median (central line), the 25-75% interquartile range (IQR) (box limits), the ±1.5 times IQR (Tukey whiskers), respectively.
Figure 2
Figure 2
Survival-based clinical relevance of AMS in ESCC. (A-E) The Kaplan-Meier survival curves and multivariate analyses showing the cumulative risk of AMS in three independent cohorts (Cohort 1, Cohort 2 and TCGA-Asian cohort), combined cohort 1 combining two our own cohorts (Cohort 1 and Cohort 2) and combined cohort 2 combing these three cohorts. (F-G) Subgroup survival analysis in ESCC patients of stage I-II and stage III-IV. (H-I) Associations between AMS and OS were further validated in two independent cohorts. P values were derived from log-rank test. HRs and 95% CI derived from multivariate Cox proportional hazard models adjusting age, gender, clinical stage, smoking and drinking status were presented.
Figure 3
Figure 3
Functional pathways annotation and immune infiltration comparison between HAMS and LAMS groups. (A) The top 10 significant pathways by mutation enrichment analysis between HAMS and LAMS patients. RGMGR: RHO GTPases, Miro GTPases and RHOBTB3. (B) GSEA results showing significantly enriched pathways using genes positively correlated with AMS. (C-E) Spearman correlations between AMS and activity of specific immune related pathways measured by GSVA. (F) The proportion comparison of immune cells estimated by CIBERSORT between patients with upper and lower quantile of AMS. Mφ: macrophages; Res: resting; Tmem: memory T cells; Tfh: follicular helper T cells; Tregs: regulatory T cells; Act: activated; γδ T: gamma delta T cells; Tn: naive T cells; DCs: dendritic cells. The P value of Wilcoxon rank sum test represented the significance. * indicating P < 0.05. (G-H) Boxplots comparing ESTIMATE immune score and ESTIMATEScore estimated by ESTIMATE algorithm. The latter is a comprehensive assessment of immune and stromal score. (I-J) TMEscore (I) and IFNG mRNA expression (J) comparison between different AMS groups. Boxplots in (F-J) displayed the median (central line), the 25-75% IQR (box limits), the ±1.5 times IQR (Tukey whiskers), respectively.
Figure 4
Figure 4
Single-cell transcriptomic analysis deciphers that APOBEC mutagenesis activates immune response. (A-B) UMAP plots of 44,340 CD45- (A) and 65,748 CD45+ (B) cells from 43 ESCC patients annotated by cell type. (C) Heatmap displaying the relative enrichment of each cell type in individuals with high and low AMS. (D) GSEA analysis of top 400 genes positively correlated with AMS in epithelial cells. (E) Violin plot showing antigen presentation score among different AMS groups. The P value of Wilcoxon rank sum test represented the significance. **** indicating P < 0.0001. (F) T Cells population enrichment differences between HAMS and LAMS group. (G) Results of GSEA in T cells showing functional pathway which genes positively correlated with AMS enriched in. (H, K) Pseudotime trajectory plots showing evolution of CD8+ T cells (H) and CD4+ T cells (K). Each dot representing a cell and the color intensity representing the pseudotime. (I, L) The developmental trajectory was plotted by subtype of CD8+ T cells (I) and CD4+ T cells (L). Each dot representing a cell and the color representing cell subtypes. (J, M) The density plots showing the distribution of CD8+ T cells (J) and CD4+ T cells (M) with different cell types along the pseudotime trajectory in patients with different AMS.
Figure 5
Figure 5
A3A, the dominant mutator for APOBEC mutagenesis in ESCC, stimulates immune infiltration. (A-B) Boxplots showing gene mRNA expression levels of APOBEC3 subfamily members between tumor and normal tissues (A) and tumors with high and low AMS (B). (C-D) Comparisons between counts of RTCA (or RTCW) events and YTCA (or YTCW) events. Red line indicating a 1:1 ratio. (E-G) Boxplots comparing the TMEscore (E), ESTIMATE immune score (F) and CYT score (G) between high and low A3A expression groups. Patients were divided into high and low groups based on the median A3A expression levels. (H) The left panel showing representative immunofluorescence images of Granzyme B+ CD8+ cells, representative of cytotoxic T cells, in tumors with different A3A expression levels. The boxplot in the right panel comparing the percentage of Granzyme B+ CD8+ T cells in tumors with different A3A expression levels from Cohort 1 (N = 19). Scale bar, 100 μm. (I) Heatmap displaying the log2 transformed fold change in tumors relative to that in normal tissues of antigen presentation molecules and immune stimulators. Boxplots displayed the median (central line), the 25-75% IQR (box limits), the ±1.5 times IQR (Tukey whiskers), respectively. The P value of Wilcoxon rank sum test represented the significance. * indicating P < 0.05, ** indicating P < 0.01, *** indicating P < 0.001, **** indicating P < 0.0001; and NS, not significant of two-sided Wilcoxon rank sum test.
Figure 6
Figure 6
A3A overexpression enhances immune signaling by activating cGAS-STING pathway. (A) Heatmap showing the differential expressions of ISGs between the high and low A3A groups. FC: fold change. (B) Western blot analysis of A3A and γH2AX levels of KYSE30 with A3A overexpression (OE) or knockout (KO). (C) Cytosolic dsDNA isolated by a commercial kit and quantified in KYSE30 with A3A OE. Cytosolic dsDNA also quantified in KYSE30 with A3A KO after treated with CDDP or DMSO. (D-E) Representative confocal microscopy images (left) of dsDNA, γH2AX and cGAS in the KYSE30 with A3A OE or KO. Statistical graphs (right) showing the proportion of extra-nuclear dsDNA, quantitative analysis of γH2AX foci and the area of cytoplasmic cGAS overlapped with cytosolic dsDNA. KYSE30 with A3A KO were treated with CDDP to induce DNA damage. Scale bars, 10 μm. (F) Western blot analysis of key factors in cGAS-STING pathway including total and p-TBK1, total and p-IRF3, total and p-STING and cGAS in KYSE30 with A3A OE or KO. (G) RT-qPCR quantifying A3A, IFNB and several representative ISGs levels, including ISG15, IFI16, OAS2, MX2, CXCL10 and CCL5, in KYSE30 with A3A OE or KO. Data are shown as mean ± SEM. * indicating P < 0.05, ** indicating P < 0.01, *** indicating P < 0.001, **** indicating P < 0.0001, and NS, not significant of Student's t-test.
Figure 7
Figure 7
FOSL1, a key transcription factor, promotes the expression of A3A. (A) Venn diagram and flow chart showing the prediction process of the three TFs. (B) Spearman correlation between FOSL1 and A3A RNA levels in scRNA-seq data. (C) Representative IHC staining photomicrographs displaying the correlation between FOSL1 and A3A protein levels (N = 20, tissues collected from Cohort 1). Scale bar, 100 μm. (D) RT-qPCR showing the influence of the indicated TFs knockdown on A3A RNA level in KYSE30. (E) Western blot analysis demonstrating the influence of the indicated TFs knockdown on A3A protein levels in KYSE30 and KYSE510. (F) Dual luciferase reporter assays showing elevated luciferase activity in KYSE510 transfected with GV238-WT promoter and decreased activity after knockdown FOSL1 by siRNA. (G) ChIP-qPCR determination showing A3A mRNA enrichment in cell lysates treated with FOSL1 antibody in KYSE30 and KYSE510. (H) Representative multiplexed immunofluorescent staining images showing the positive correlation and co-localization between A3A and FOSL1. Scale bar, 100 μm. Data are shown as mean ± SEM. * indicating P < 0.05, ** indicating P < 0.01, *** indicating P < 0.001, **** indicating P < 0.0001, and NS, not significant of Student's t-test.
Figure 8
Figure 8
A3A's role in predicting immunotherapy response. (A) Heatmap showing the log2 transformed fold change in tumors relative to that in normal tissues of several important immune checkpoints. The P value of Wilcoxon rank sum test represented the significance. ** indicating P < 0.01 of two-sided Wilcoxon rank sum test. (B) A3A mRNA levels comparison between patients with different anti-PD-L1 treatment response. (C) The Kaplan-Meier survival curves according to A3A mRNA levels in patients receiving anti-PD-L1 treatment. (D) The proportion of patients with different treatment response in high and low A3A groups. (E) Representative multiplexed immunofluorescent staining pictures showing the positive correlation and co-localization between A3A and PD-L1 (N = 19, tissues collected from Cohort 1). Scale bar, 100 μm. (F) Western blot analysis of PD-L1, total and p-STAT1 in KYSE30 with A3A OE or KO. (G) Image of the mouse tumors with or without A3A overexpression receiving anti-PD-1 treatment or IgG control treatment at the end of the experiment. (H-I) Statistical graph showing the weight of subcutaneous tumors (H) and tumor growth curves showing the tumor volume (I) among the four groups (N=5 per group). Data are shown as mean ± SEM. * indicating P < 0.05, ** indicating P < 0.01, *** indicating P < 0.001, **** indicating P < 0.0001, and NS, not significant of Student's t-test. (J) A proposed model for the regulatory mechanism of APOBEC mutagenesis in immunity and immunotherapy response in ESCC.

References

    1. Alexandrov LB, Kim J, Haradhvala NJ. et al. The repertoire of mutational signatures in human cancer. Nature. 2020;578:94–101. - PMC - PubMed
    1. Alexandrov LB, Jones PH, Wedge DC. et al. Clock-like mutational processes in human somatic cells. Nat Genet. 2015;47:1402–7. - PMC - PubMed
    1. Chang J, Tan W, Ling Z. et al. Genomic analysis of oesophageal squamous-cell carcinoma identifies alcohol drinking-related mutation signature and genomic alterations. Nat Commun. 2017;8:15290. - PMC - PubMed
    1. Zhang X, Peng L, Luo Y. et al. Dissecting esophageal squamous-cell carcinoma ecosystem by single-cell transcriptomic analysis. Nat Commun. 2021;12:5291. - PMC - PubMed
    1. Moody S, Senkin S, Islam SMA. et al. Mutational signatures in esophageal squamous cell carcinoma from eight countries with varying incidence. Nat Genet. 2021;53:1553–63. - PubMed

Publication types