. 2023 Apr 18;26(5):106686.
doi: 10.1016/j.isci.2023.106686. eCollection 2023 May 19.

Genome-wide mRNA profiling in urinary extracellular vesicles reveals stress gene signature for diabetic kidney disease

Affiliations

Genome-wide mRNA profiling in urinary extracellular vesicles reveals stress gene signature for diabetic kidney disease

Om Prakash Dwivedi et al. iScience. .

Abstract

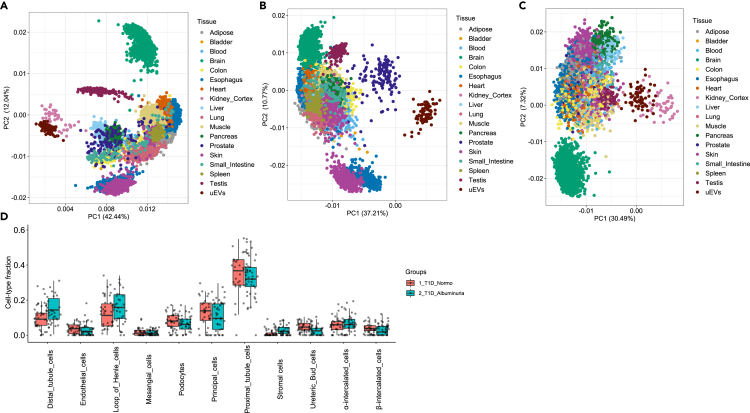
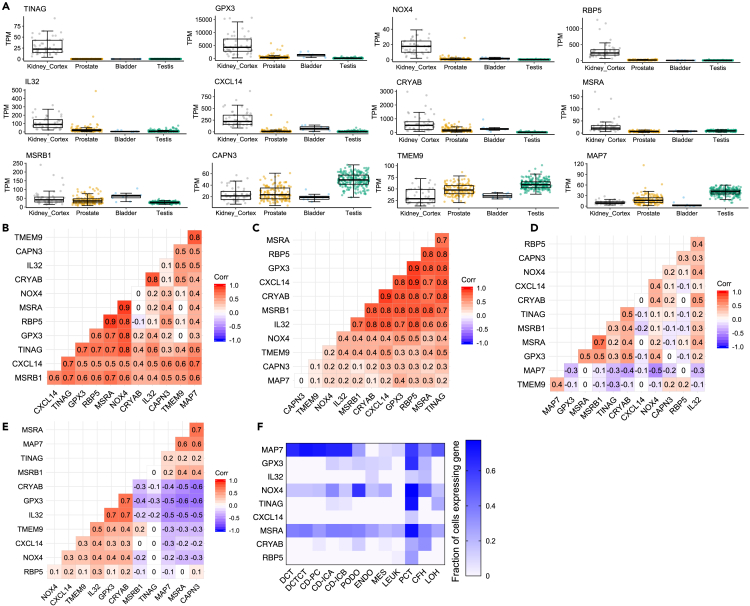
Urinary extracellular vesicles (uEV) are a largely unexplored source of kidney-derived mRNAs with potential to serve as a liquid kidney biopsy. We assessed ∼200 uEV mRNA samples from clinical studies by genome-wide sequencing to discover mechanisms and candidate biomarkers of diabetic kidney disease (DKD) in Type 1 diabetes (T1D) with replication in Type 1 and 2 diabetes. Sequencing reproducibly showed >10,000 mRNAs with similarity to kidney transcriptome. T1D DKD groups showed 13 upregulated genes prevalently expressed in proximal tubules, correlated with hyperglycemia and involved in cellular/oxidative stress homeostasis. We used six of them (GPX3, NOX4, MSRB, MSRA, HRSP12, and CRYAB) to construct a transcriptional "stress score" that reflected long-term decline of kidney function and could even identify normoalbuminuric individuals showing early decline. We thus provide workflow and web resource for studying uEV transcriptomes in clinical urine samples and stress-linked DKD markers as potential early non-invasive biomarkers or drug targets.

Keywords: Biopsy sample; Clinical finding; Disease; Medicine; Specimen.


Conflict of interest statement

L.G. has received research funding from Pfizer Inc, Regeneron Pharmaceuticals, Eli Lilly, and AstraZeneca. P-H.G. has received research grants from Eli Lilly and Roche; is an advisory board member for AbbVie, AstraZeneca, Boehringer Ingelheim, Cebix, Eli Lilly, Jansen, MSD, Novartis, Novo Nordisk, and Sanofi; and has received lecture fees from Boehringer Ingelheim, Eli Lilly, Elo Water, Genzyme, MSD, Novartis, Novo Nordisk, and Sanofi. The funding sources were not involved in the design or conduct of the study.

Figures

None
Graphical abstract
Figure 1
Figure 1
Study design and Urinary extracellular vesicles (uEV) quality control (A) Study design for the next generation sequencing of uEV mRNAs to assess urine collections, quality and reproducibility (technical comparisons), origins of uEV transcripts (uEV on Tissue map), and discovery of candidate non-invasive markers for diabetic kidney disease (DKD marker candidates). (B–D) Transmission electron micrographs showing uEV of typical morphology and variable sizes; filamentous structures compatible with Tamm-Horsfall protein filaments are visible in the in-set B1. (E) Western blotting showing the presence of uEV-enriched markers CD9 and PDX in uEV preparations. (F) Representative electropherograms of RNA isolated from uEV and analyzed with bioanalyzer using Agilent Pico kit. An RNA peak between 25 and 200 nt was detected in all samples and with this characteristic shape passed quality control. (G) Examples showing signs of nucleic acid degradation (arrows) in uEV RNA samples and not passing quality control. 24 h (24h); albumin excretion rate (AER); blood pressure (BP); body-mass index (BMI); estimated glomerular filtration rate (eGFR); waist-to-hip ratio (WHR); Genotype-Tissue Expression (GTEx) project; glycated hemoglobin (HbA1C); Lymph Node Carcinoma of the prostate (LnCaP), macroalbuminuria (Macro); microalbuminuria (Micro); non-diabetic control (Control); normoalbuminuria (Normo); messenger RNA sequencing (mRNAseq); Podocalyxin (PDX), type 1 or type 2 diabetes (T1D, T2D); urinary extracellular vesicles (uEV); principal component analysis (PCA); single-nucleus RNA sequencing (snRNA-seq).
Figure 2
Figure 2
Sequencing of uEV mRNAs showed consistent gene expression distribution and reproducibility across different technical comparisons (A and B) Clustering of all technical replicates (from diabetic and non-diabetic individuals) using uEV expression levels across A-all commonly expressed genes (n = 10,449) and B- kidney enriched genes (n = 233). Technical replicates included 1) aliquots of individual samples (24h urine collection) processed through the uEV mRNA sequencing pipeline twice (R1 and R2, n = 6 donors) or thrice (R1, R2 and R3, n = 2) at different time points and 2) urine samples (24h collection) processed with (_C) and without centrifugation before freezing (n = 4). (C) Clustering based on expression levels of kidney enriched genes in uEV for all technical samples from ON vs. 24h urine collections. Samples from individual donors were collected from the same day (n = 12 donors). Samples S1-S9 were from individuals with T1D and S10-S13 from non-diabetic individuals. The gene expression values (log2CPM) were inverse normally transformed and converted to Z score before analysis for A-C. Clustering analysis (A to C) was performed using Euclidean distance-based method. (D and E) Coefficient of variation (CV%) comparing technical replicates (X axis, n = 2 unique control samples with triplicate measurements) with all T1D samples of discovery cohort (Y axis, n = 72) using all uEV genes (D, n = 9,542- genes expressed in 3 replicates and present in T1D discovery cohort set) and kidney enriched genes (E, n = 211- detected in 3 replicates). The color coding represents the average expression level (low expression = 0-25 percentile, n = 2390 or 47 genes; medium expression = 26-74 percentile, n = 4765 or 113 genes; high expression = 75-100 percentile, n = 2387 or 51). Counts per million (CPM); replicate (R); type 1 diabetes (T1D); urinary extracellular vesicles (uEV).
Figure 3
Figure 3
Genome-wide mRNA profile of uEV showed similarity with the kidney mRNA profile and deconvoluted kidney cell types (A–C) PC analysis using gene expression levels (log2CPM) in uEV from the T1D cohorts (n = 72), and the respective gene expression levels (log2CPM) in 17 human tissues obtained from the GTEx reference database (tissues from men only; Adipose = 692, Bladder = 9, Blood = 426, Brain = 1612, Colon = 475, Esophagus = 866, Heart = 515, Kidney Cortex = 49, Liver = 138, Lung = 327, Muscle = 474, Pancreas = 189, Prostate = 140, Skin = 1088, Small Intestine = 118, Spleen = 132, Testis = 216). (A), all commonly expressed protein coding genes as detected in uEV and GTEx tissues (n = 10,350); (B), a subset of “kidney depleted genes”, i.e. genes normally not expressed in kidney (n = 200 present in uEV+GTEx combined dataset out of 4,631, details in Methods); (C), “specific kidney enriched genes”, a subset of kidney enriched genes (n = 77, as shown in S5) that are reported to be detected in kidney and only in some other human tissues (see STAR Methods). (D) Deconvolution analysis of kidney cell types for the uEV mRNAs (T1D discovery cohort, n = 72) using adult kidney single-nucleus sequencing data as a ref. . The boxplots depict the interquartile range, median and minimum/maximum summary values. Counts per million (CPM); genotype-tissue expression (GTEx); principal component (PC); type 1 diabetes (T1D); urinary extracellular vesicles (uEV).
Figure 4
Figure 4
Upregulation of 13 uEV transcripts in albuminuria and their correlation with clinical parameters in T1D discovery cohort (A) Global differential expression analysis consisting of 10,596 genes and comparing macro- (n = 17) and normoalbuminuric T1D (n = 37) groups of the discovery cohort. Plot depicts the names of 13 differentially expressed genes that remained significant after multiple testing (p ≤ 3.85x10⁻⁶, Bonferroni threshold). (B) The boxplots illustrate the mRNA expression level distribution (sd unit) of 13 differentially expressed genes in the macro- and normoalbuminuric T1D groups (as in A) along with the microalbuminuric T1D group (n = 13). (C) Heatmap depicting the strength of correlation between expression level of the 13 genes in uEV with eight continuous clinical parameters in the T1D individuals (n = 65–67 samples, including 35–37 with normo-, 13 with micro- and 17 with macroalbuminuria). The analysis (Normo vs. Macro) in A was performed based on count data using generalized linear models adjusting for age, body-mass index, diabetes duration and urine collection protocols (overnight and 24 h). In B, the comparisons were performed using one-way ANOVA. The gene expression values (log2CPM) were inverse normally transformed and converted to Z score unit (sd unit). The boxplots depict the interquartile range, median and minimum/maximum summary values. In C, all data were transformed using inverse rank transformation before Spearman’s correlation analysis (two tailed). Fold change (FC); log2 normalized counts per million (log2CPM); macroalbuminuria (Macro); microalbuminuria (Micro); normoalbuminuria (Normo); type 1 diabetes (T1D); urinary extracellular vesicles (uEV).
Figure 5
Figure 5
Resemblance in gene expression signature of the top DKD candidate genes between uEV and human kidney tissue (A) Expression levels (interquartile range, median and minimum/maximum summary values) of the genes-shown to be differentially expressed in uEV from macro-vs. normoalbuminuric patients (12 out of 13 genes depicted)- in male urogenital organs obtained from the GTEx reference database (tissues from men only; kidney-cortex, n = 49; prostate, n = 140; bladder, n = 9; testis, n = 216). (B–E), Pairwise gene expression correlation (Spearman’s correlation analysis) among the differentially expressed genes (n = 12) in male urogenital organs (from GTEx as in A) or uEV (n = 72, both T1D cohorts): B- kidney-cortex; C- uEV; D-prostate; E-testis. (F) Heatmap showing the fraction of specified kidney cells expressing the nine differentially expressed genes. Data is from single cell sequencing of human diabetic kidney and obtained from Wilson et al. The assessed kidney cell types were: PCT, proximal convoluted tubule; CFH, complement factor H; LOH, loop of Henle; DCT, distal convoluted tubule; CT, connecting tubule; CD, collecting duct; PC, principal cell; IC, intercalated cell; PODO, podocyte; ENDO, endothelium; MES, mesangial cell; LEUK, leukocyte. Correlation (Corr.); diabetic kidney disease (DKD); genotype-Tissue Expression (GTEx); transcripts per million (TPM); urinary extracellular vesicles (uEV).
Figure 6
Figure 6
Transcriptomic stress score is associated with albuminuria status in different diabetic cohorts (A) Expression level of the transcriptomic stress score in different albuminuria groups of the T1D discovery cohort. Stress score was constructed based on six differentially expressed uEV mRNAs, among top 13 candidate genes, involved in cellular stress responses (genes GPX3, NOX4, MSRB1, MSRA, HRSP12, and CRYAB). (B–E) Stress score in different albuminuria groups from three different diabetic replication cohorts, B- Replication 1 (T1D female cohort; FinnDiane study), C- Replication 2 (T2D cohort; DIREVA study) and D- Replication 3 (T2D cohort; iBEAt study), and a combined analysis of all three replication cohorts in E. (F) Stress score in normoalbuminuric individuals from all discovery and replication cohorts divided based on medication usage. (G) Stress core in non-diabetic (age; mean ± sem = 43.67 ± 4.86) and diabetic (T1D and T2D) subjects with normoalbuminuria (Table S3). The boxplots depict the interquartile range, median and minimum/maximum summary values. n = numbers as depicted in figure panels; # Mann-Whitney u test; ∗ Kruskal-Wallis test.
Figure 7
Figure 7
Stress score as an early marker for longitudinal decline of kidney function in diabetic individuals (A) The T1D discovery cohort was stratified into quartiles based on uEV stress score. Change of eGFR over 15 sequential visits (mean/year and slope) was analyzed retrospectively from the time of uEV collection (data available for n = 51). (B) Similar analysis in normoalbuminuric individuals of T1D discovery cohort stratified into lowest stress quartile (≤25%) or higher quartiles (>25%). Microalbuminuric group without any stress score stratification is shown as a positive control group of early DKD. (C) Longitudinal HbA1c change in normoalbuminuric individuals of T1D discovery cohort stratified into lowest stress quartile (≤25%) or higher quartiles (>25%). Clinically confirmed micro- and macroalbuminuria groups are shown as positive controls of early and late DKD, respectively. (D) Longitudinal eGFR change in replication cohort 1 (T1D female cohort; FinnDiane study) stratified as in B. (E) Longitudinal eGFR change in replication cohort 2 of DKD patients (T2D cohort; DIREVA study) stratified into the lowest and the respective highest stress score quartile(s) and shown separately for macro- and microalbuminuria groups. (F and G) Association of stress score with F- eGFR slope and G-baseline eGFR (measured at the time of uEV collection) in all samples. (H) association of stress score (sd unit) and other know causal clinical risk markers (in sd unit) with eGFR decline (sd unit change per year) independent of each other and baseline eGFR in all samples. Linear regression analysis after inverse normal transformation. In H, model consisted of stress score, DBP, HbA1C, SBP and eGFR at time of uEV collection. n = numbers as depicted in figure panels. DBP; diastolic blood pressure, eGFR; estimated glomerular filtration rate, HbA1C; hemoglobin A1C, SBP; systolic blood pressure.

References

    1. Lin X., Xu Y., Pan X., Xu J., Ding Y., Sun X., Song X., Ren Y., Shan P.F. Global, regional, and national burden and trend of diabetes in 195 countries and territories: an analysis from 1990 to 2025. Sci. Rep. 2020;10:14790. - PMC - PubMed
    1. Thomas M.C., Brownlee M., Susztak K., Sharma K., Jandeleit-Dahm K.A.M., Zoungas S., Rossing P., Groop P.H., Cooper M.E. Diabetic kidney disease. Nat. Rev. Dis. Prim. 2015;1:15018. - PMC - PubMed
    1. Gonzalez Suarez M.L., Thomas D.B., Barisoni L., Fornoni A. Diabetic nephropathy: is it time yet for routine kidney biopsy? World J. Diabetes. 2013;4:245–255. - PMC - PubMed
    1. Gross J.L., de Azevedo M.J., Silveiro S.P., Canani L.H., Caramori M.L., Zelmanovitz T. Diabetic nephropathy: diagnosis, prevention, and treatment. Diabetes Care. 2005;28:164–176. - PubMed
    1. Selby N.M., Taal M.W. An updated overview of diabetic nephropathy: diagnosis, prognosis, treatment goals and latest guidelines. Diabetes Obes. Metab. 2020;22:3–15. - PubMed