. 2023 Sep 1;145(9):091006.
doi: 10.1115/1.4062490.

Deformation and Durability of Soft Three-Dimensional-Printed Polycarbonate Urethane Porous Membranes for Potential Use in Pelvic Organ Prolapse

Affiliations

Deformation and Durability of Soft Three-Dimensional-Printed Polycarbonate Urethane Porous Membranes for Potential Use in Pelvic Organ Prolapse

Emilio Omar Bachtiar et al. J Biomech Eng. .

Abstract

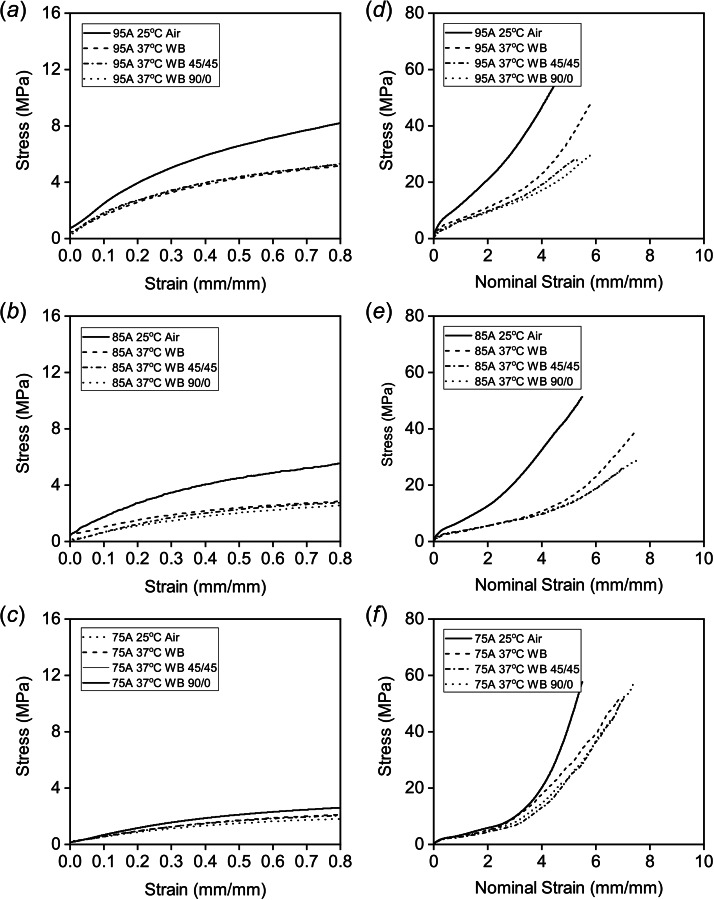
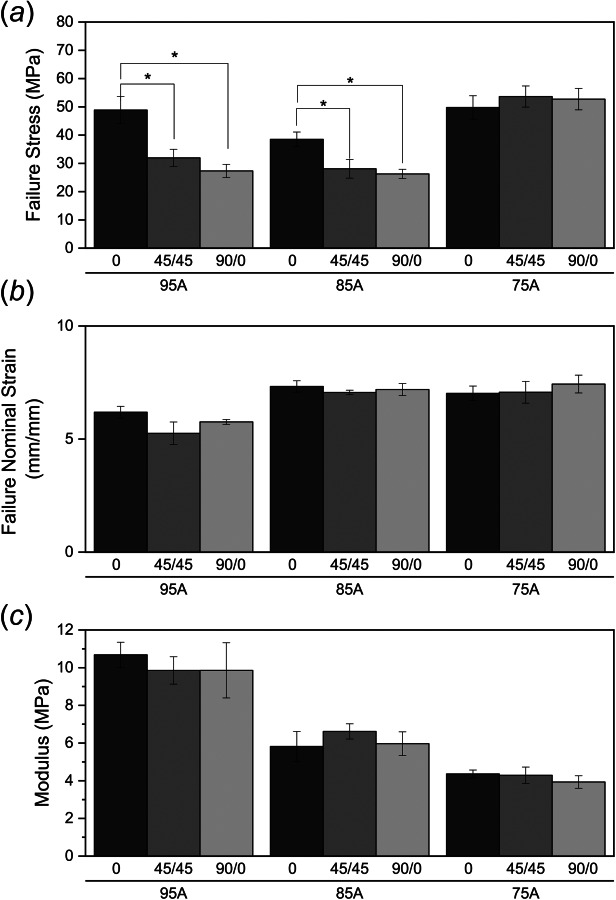
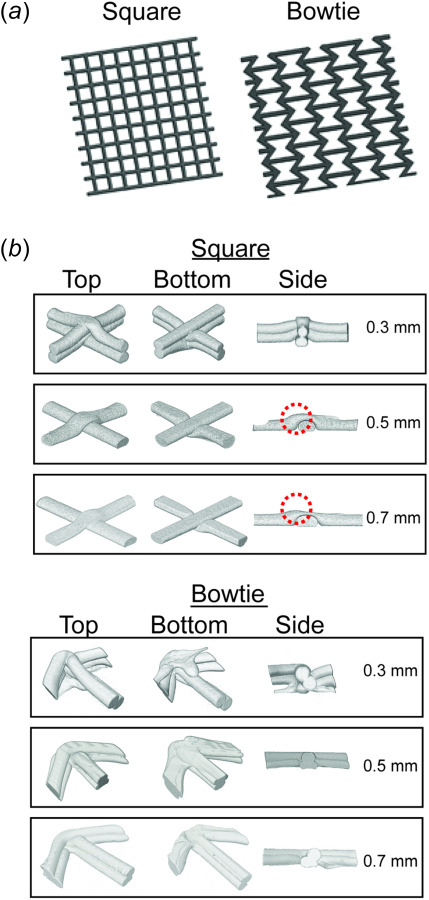
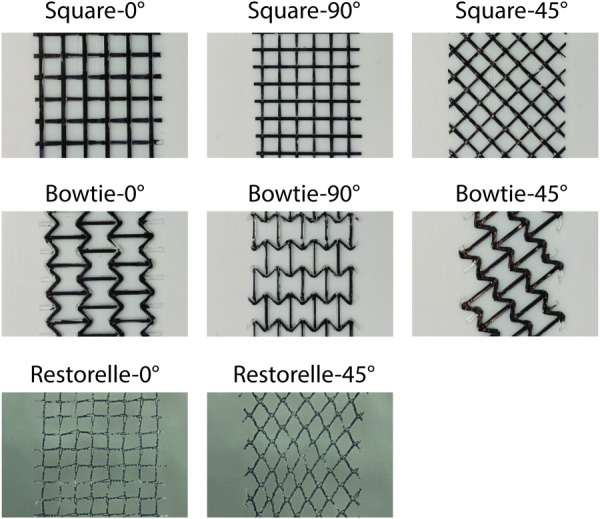
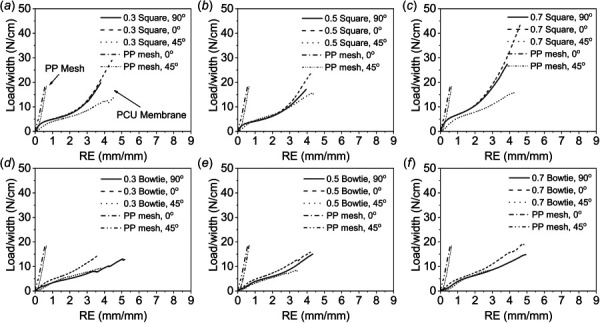
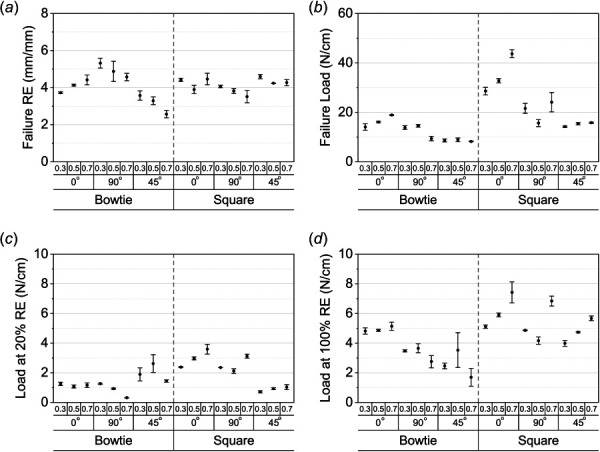
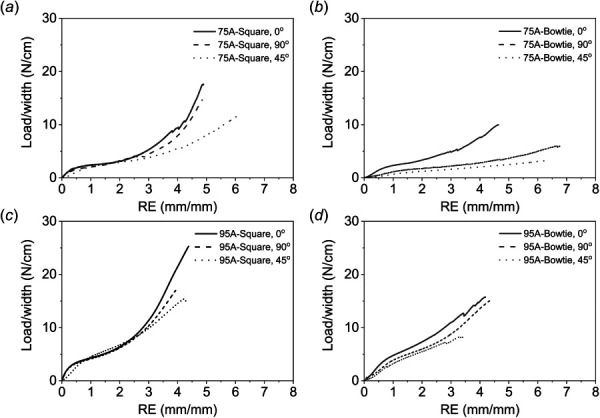
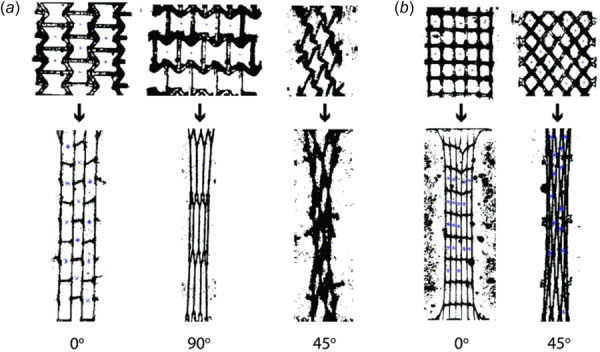
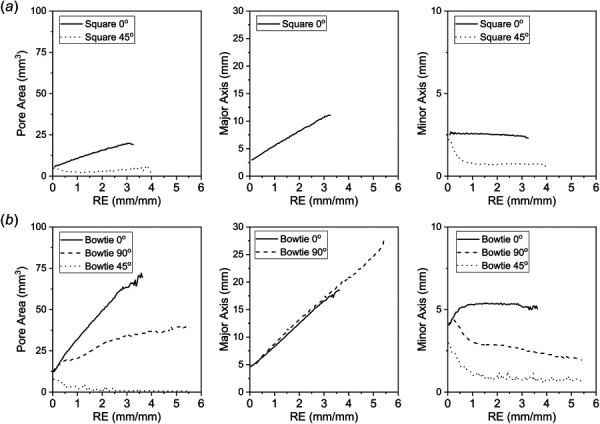
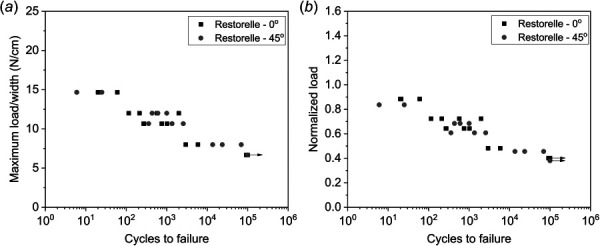
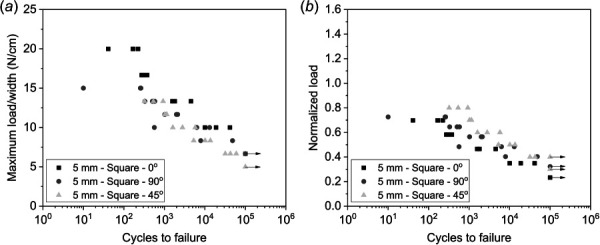
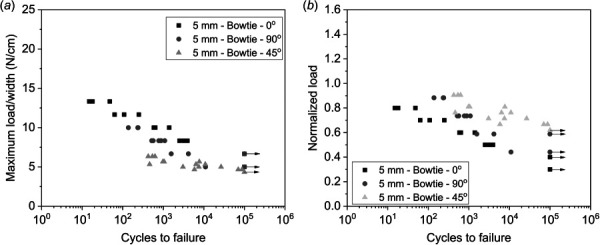
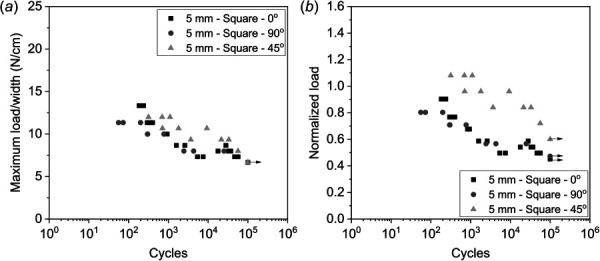
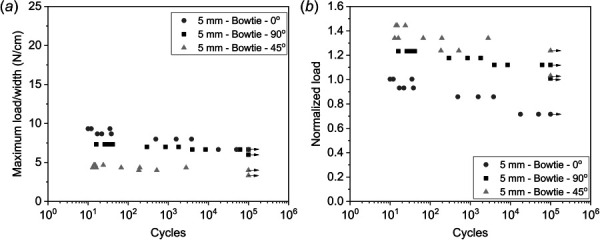
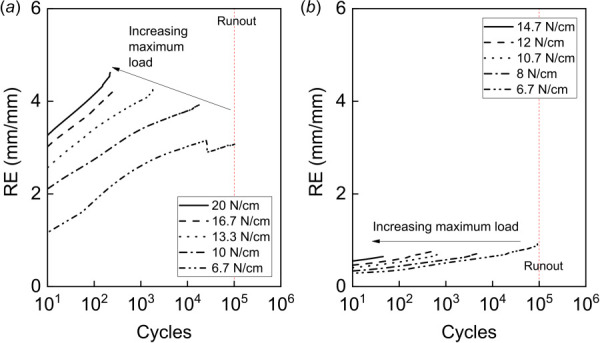
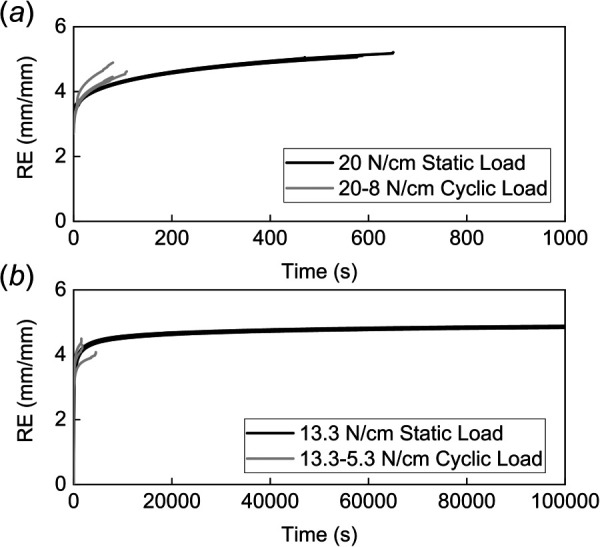
Pelvic organ prolapse (POP) is the herniation of the pelvic organs into the vaginal space, resulting in the feeling of a bulge and organ dysfunction. Treatment of POP often involves repositioning the organs using a polypropylene mesh, which has recently been found to have relatively high rates of complications. Complications have been shown to be related to stiffness mismatches between the vagina and polypropylene, and unstable knit patterns resulting in mesh deformations with mechanical loading. To overcome these limitations, we have three-dimensional (3D)-printed a porous, monofilament membrane composed of relatively soft polycarbonate-urethane (PCU) with a stable geometry. PCU was chosen for its tunable properties as it is comprised of both hard and soft segments. The bulk mechanical properties of PCU were first characterized by testing dogbone samples, demonstrating the dependence of PCU mechanical properties on its measurement environment and the effect of print pathing. The pore dimensions and load-relative elongation response of the 3D-printed PCU membranes under monotonic tensile loading were then characterized. Finally, a fatigue study was performed on the 3D-printed membrane to evaluate durability, showing a similar fatigue resistance with a commercial synthetic mesh and hence its potential as a replacement.


Figures

Monotonic tensile test result of PCU dogbones in air and a 37 °C water bath (WB) with various print raster angles (a–c) Stress–strain curve showing early behavior of PCU dogbones under tensile loading (d–f) Stress-nominal strain curve showing curve up to failure. 45/45 indicates a print raster angle alternating between 45 deg/–45 deg relative to the length of the dogbone. 90/0 indicates a print raster angle alternating between 90 deg/0 deg relative to the length of the dogbone
Fig. 1
Monotonic tensile test result of PCU dogbones in air and a 37 °C water bath (WB) with various print raster angles (ac) Stress–strain curve showing early behavior of PCU dogbones under tensile loading (df) Stress-nominal strain curve showing curve up to failure. 45/45 indicates a print raster angle alternating between 45 deg/–45 deg relative to the length of the dogbone. 90/0 indicates a print raster angle alternating between 90 deg/0 deg relative to the length of the dogbone
Summary of PCU dogbone tensile testing, (*) indicates statistical significance with p < 0.0001 (a) failure stress, (b) failure nominal strain, and (c) modulus
Fig. 2
Summary of PCU dogbone tensile testing, (*) indicates statistical significance with p < 0.0001 (a) failure stress, (b) failure nominal strain, and (c) modulus
(a) CAD rendering of to-be-printed membranes and (b)micro-CT rendering of printed membranes
Fig. 3
(a) CAD rendering of to-be-printed membranes and (b)micro-CT rendering of printed membranes
Loading orientations for PCU membranes and a commercial polypropylene mesh (Restorelle). Membranes and mesh colored black for clarity.
Fig. 4
Loading orientations for PCU membranes and a commercial polypropylene mesh (Restorelle). Membranes and mesh colored black for clarity.
Tensile monotonic load-RE curve of 3D-printed 95A PCU membranes in 90 deg, 0 deg, and 45 deg orientation. Curve for a commercial PP mesh is added as a comparison (a) square 0.3 mm membrane, (b) square 0.5 mm membrane, (c) square 0.7 mm membrane, (d) bowtie 0.3 mm membrane, (e) bowtie 0.5 mm membrane, and (f) bowtie 0.7 mm membrane.
Fig. 5
Tensile monotonic load-RE curve of 3D-printed 95A PCU membranes in 90 deg, 0 deg, and 45 deg orientation. Curve for a commercial PP mesh is added as a comparison (a) square 0.3 mm membrane, (b) square 0.5 mm membrane, (c) square 0.7 mm membrane, (d) bowtie 0.3 mm membrane, (e) bowtie 0.5 mm membrane, and (f) bowtie 0.7 mm membrane.
Box plot summary of membrane structural properties for 95A PCU membranes with varying strut sizes (0.3, 0.5, 0.7 mm) tested in three different orientations (0 deg, 90 deg, 45 deg) (a) failure RE, (b) failure load, (c) load at 20% RE, and (d) load at 100% RE
Fig. 6
Box plot summary of membrane structural properties for 95A PCU membranes with varying strut sizes (0.3, 0.5, 0.7 mm) tested in three different orientations (0 deg, 90 deg, 45 deg) (a) failure RE, (b) failure load, (c) load at 20% RE, and (d) load at 100% RE
Tensile load/width-RE curve for (a) square 75A membrane, (b) bowtie 75A membrane, (c) Square 95A membrane, and (d) bowtie 95A membrane
Fig. 7
Tensile load/width-RE curve for (a) square 75A membrane, (b) bowtie 75A membrane, (c) Square 95A membrane, and (d) bowtie 95A membrane
Change in pore shape over course of monotonic tensile testing (a) bowtie membrane under 90 deg, 0 deg, and 45 deg loading from left to right and (b) square membrane under 0 deg and 45 deg loading from left to right
Fig. 8
Change in pore shape over course of monotonic tensile testing (a) bowtie membrane under 90 deg, 0 deg, and 45 deg loading from left to right and (b) square membrane under 0 deg and 45 deg loading from left to right
Geometrical changes of membrane pore size over course of tensile test (a) square membranes and (b) bowtie membranes
Fig. 9
Geometrical changes of membrane pore size over course of tensile test (a) square membranes and (b) bowtie membranes
S–N plot of Restorelle. Arrows indicate runout at 100,000 cycles: (a) maximum cycle load/width plotted against number of cycles at failure and (b) normalized load plotted against number of cycles at failure.
Fig. 10
S–N plot of Restorelle. Arrows indicate runout at 100,000 cycles: (a) maximum cycle load/width plotted against number of cycles at failure and (b) normalized load plotted against number of cycles at failure.
S–N plot of 95A square membrane. Arrows indicate runout at 100,000 cycles: (a) maximum cycle load/width plotted against number of cycles at failure and (b) normalized load plotted against number of cycles at failure.
Fig. 11
S–N plot of 95A square membrane. Arrows indicate runout at 100,000 cycles: (a) maximum cycle load/width plotted against number of cycles at failure and (b) normalized load plotted against number of cycles at failure.
S–N plot of 95A bowtie membrane. Arrows indicate runout at 100,000 cycles: (a) maximum cycle load/width plotted against number of cycles at failure and (b) normalized load plotted against number of cycles at failure.
Fig. 12
S–N plot of 95A bowtie membrane. Arrows indicate runout at 100,000 cycles: (a) maximum cycle load/width plotted against number of cycles at failure and (b) normalized load plotted against number of cycles at failure.
S-N plot of 75A square membrane. Arrows indicate runout at 100,000 cycles: (a) maximum cycle load/width plotted against number of cycles at failure and (b) normalized load plotted against number of cycles at failure.
Fig. 13
S-N plot of 75A square membrane. Arrows indicate runout at 100,000 cycles: (a) maximum cycle load/width plotted against number of cycles at failure and (b) normalized load plotted against number of cycles at failure.
S-N plot of 75A bowtie membrane. Arrows indicate runout at 100,000 cycles: (a) maximum cycle load/width plotted against number of cycles at failure and (b) normalized load plotted against number of cycles at failure.
Fig. 14
S-N plot of 75A bowtie membrane. Arrows indicate runout at 100,000 cycles: (a) maximum cycle load/width plotted against number of cycles at failure and (b) normalized load plotted against number of cycles at failure.
Evolution of RE during cyclic loading (a) 95A-square-0 deg and (b) Restorelle-0 deg
Fig. 15
Evolution of RE during cyclic loading (a) 95A-square-0 deg and (b) Restorelle-0 deg
RE increase of 95A-square-0 deg under static and cyclic load (a) samples loaded at 20 N/cm static and peak cyclic load and (b) samples loaded at 13.3 N/cm static and peak cyclic load
Fig. 16
RE increase of 95A-square-0 deg under static and cyclic load (a) samples loaded at 20 N/cm static and peak cyclic load and (b) samples loaded at 13.3 N/cm static and peak cyclic load

References

    1. American Urogynecologic, Society, 2019, “ Pelvic Organ Prolapse,” Female Pelvic Med. Reconstr. Surg., 25, pp. 397–408.10.1097/SPV.0000000000000794 - DOI - PubMed
    1. Jelovsek, J. E. , Barber, M. D. , Brubaker, L. , Norton, P. , Gantz, M. , Richter, H. E. , Weidner, A. , Menefee, S. , Schaffer, J. , Pugh, N. , and Meikle, S. , for the NICHD Pelvic Floor Disorders Network, 2018, “ Effect of Uterosacral Ligament Suspension versus Sacrospinous Ligament Fixation With or Without Perioperative Behavioral Therapy for Pelvic Organ Vaginal Prolapse on Surgical Outcomes and Prolapse Symptoms at 5 Years in the OPTIMAL Randomized Clinical Trial,” JAMA, 319(15), pp. 1554–1565.10.1001/jama.2018.2827 - DOI - PMC - PubMed
    1. Chen, C. C. G. , Ridgeway, B. , and Paraiso, M. F. R. , 2007, “ Biologic Grafts and Synthetic Meshes in Pelvic Reconstructive Surgery,” Clin. Obstet. Gynecol., 50(2), pp. 383–411.10.1097/GRF.0b013e31804b184c - DOI - PubMed
    1. Dietz, H. P. , Vancaillie, P. , Svehla, M. , Walsh, W. , Steensma, A. B. , and Vancaillie, T. G. , 2003, “ Mechanical Properties of Urogynecologic Implant Materials,” Int. Urogynecol. J., 14, pp. 239–243.10.1007/s00192-003-1041-8 - DOI - PubMed
    1. Liang, R. , Abramowitch, S. , Knight, K. , Palcsey, S. , Nolfi, A. , Feola, A. , Stein, S. , and Moalli, P. A. , 2013, “ Vaginal Degeneration Following Implantation of Synthetic Mesh With Increased Stiffness,” BJOG Int. J. Obstet. Gynaecol., 120(2), pp. 233–243.10.1111/1471-0528.12085 - DOI - PMC - PubMed

Publication types