. 2023 May 22;19(5):e1010693.
doi: 10.1371/journal.pgen.1010693. eCollection 2023 May.

Transcriptome-wide gene-gene interaction associations elucidate pathways and functional enrichment of complex traits

Affiliations

Transcriptome-wide gene-gene interaction associations elucidate pathways and functional enrichment of complex traits

Luke M Evans et al. PLoS Genet. .

Abstract

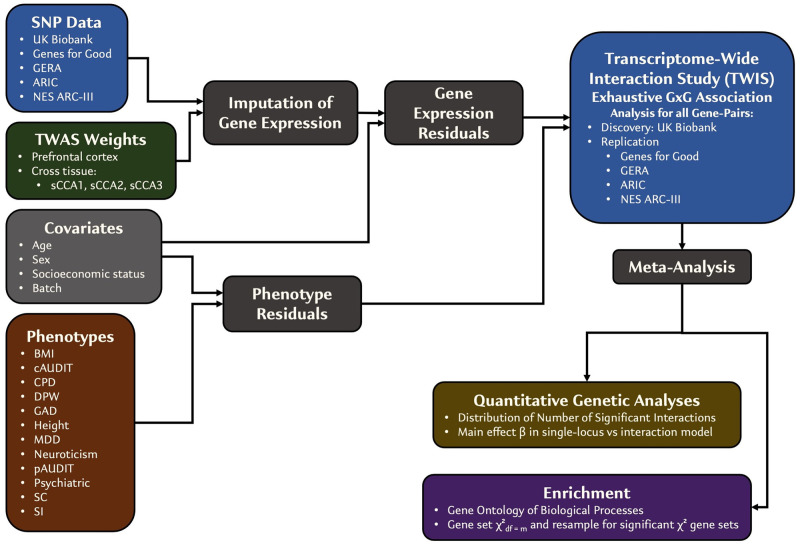
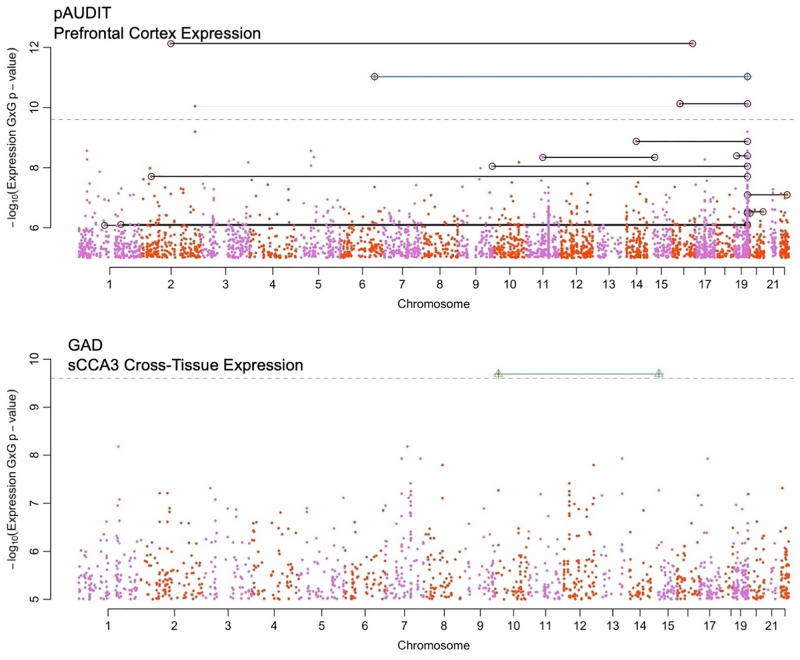
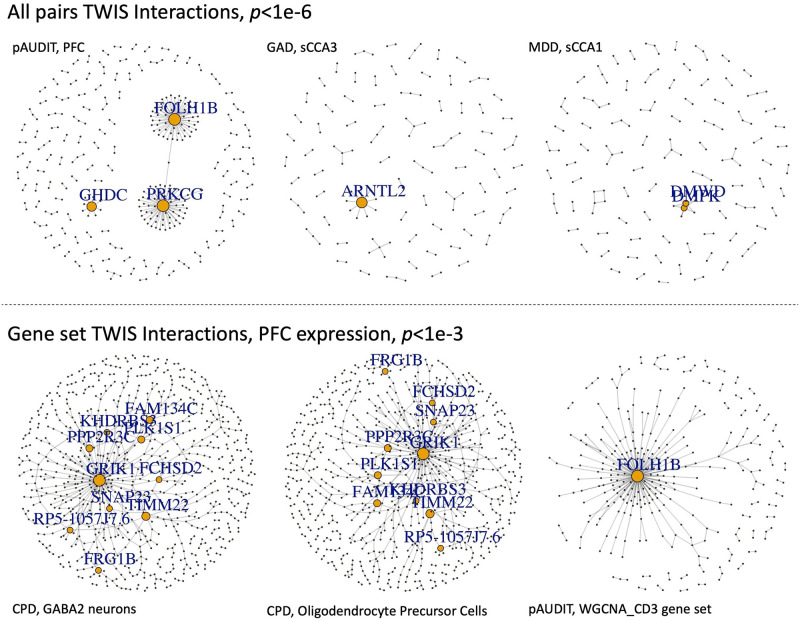
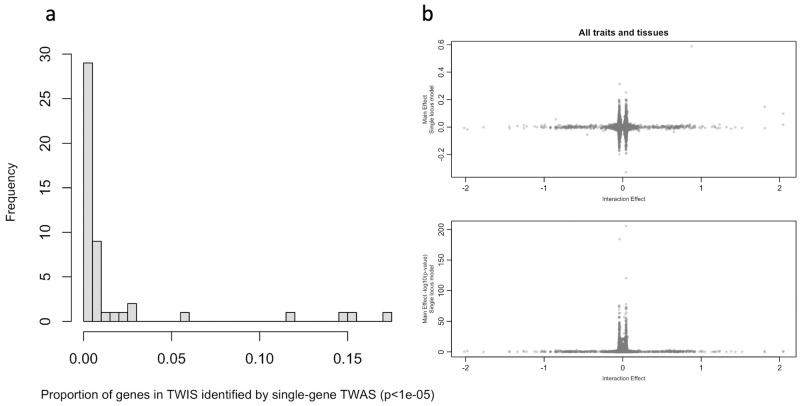
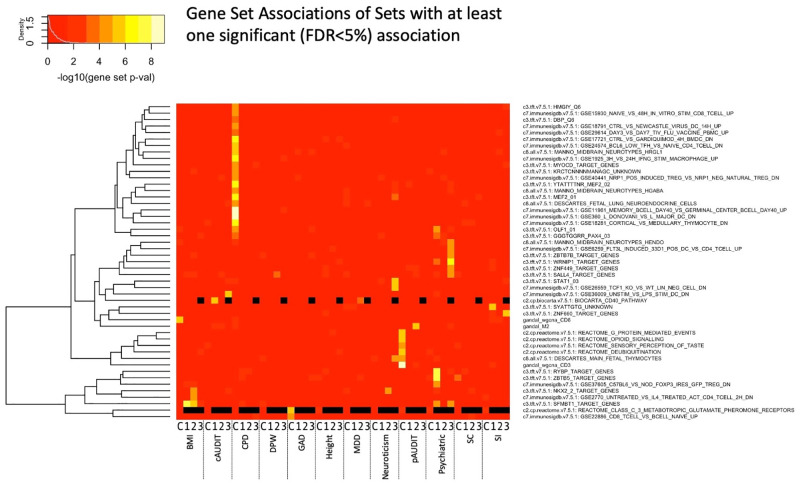
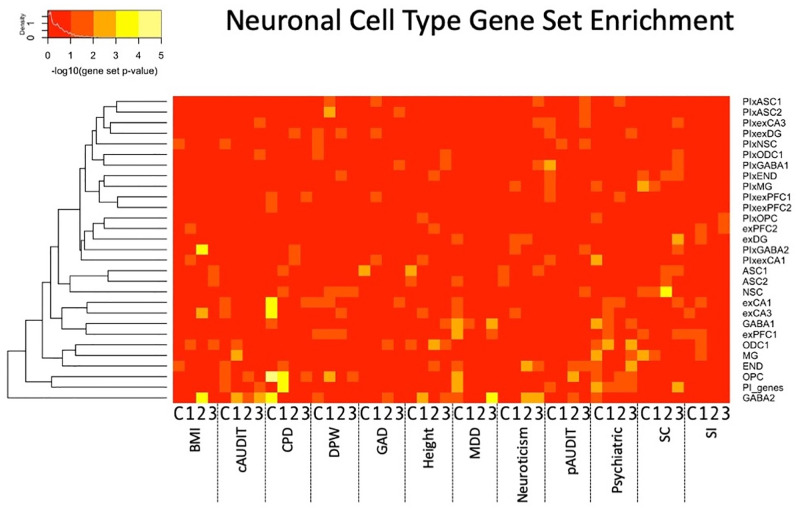
It remains unknown to what extent gene-gene interactions contribute to complex traits. Here, we introduce a new approach using predicted gene expression to perform exhaustive transcriptome-wide interaction studies (TWISs) for multiple traits across all pairs of genes expressed in several tissue types. Using imputed transcriptomes, we simultaneously reduce the computational challenge and improve interpretability and statistical power. We discover (in the UK Biobank) and replicate (in independent cohorts) several interaction associations, and find several hub genes with numerous interactions. We also demonstrate that TWIS can identify novel associated genes because genes with many or strong interactions have smaller single-locus model effect sizes. Finally, we develop a method to test gene set enrichment of TWIS associations (E-TWIS), finding numerous pathways and networks enriched in interaction associations. Epistasis is may be widespread, and our procedure represents a tractable framework for beginning to explore gene interactions and identify novel genomic targets.


Conflict of interest statement

The authors have declared that no competing interests exist.

Figures

Fig 1
Fig 1. Overview of TWIS approach.
Fig 2
Fig 2. Boulder plot of pAUDIT (top) and GAD (bottom) interaction association p-values using imputed transcription.
Shown are the results from the final meta-analysis of all data. In these plots, each interaction test is indicated by two points, located at their physical chromosomal positions. Pairs with significant interactions are connected by lines. Peaks, such as the peak on Chromosome 19 in the top figure, indicate strong interactions with many other genes, i.e., a hub gene (see Fig 3 as well). Black lines connect pairs that surpassed p<5.86e-10 in the discovery cohort (UKB), green and blue lines connect pairs of loci with FDR q<0.05 or nominally significant interaction (p<0.05) in the replication cohort, and gray lines connect pairs of genes with p<2.5e-10 in the final meta-analysis. For clarity, only interaction associations with p<1e-5 are shown. Numerical results of genes reaching significance are presented in Table 1.
Fig 3
Fig 3. Networks of TWIS associations for selected traits and gene expression in specific tissues, either based on all pairs with p<1e-6 from the exhaustive, genome-wide TWIS (top), or within specific gene sets applying a nominal p<1e-3 threshold (bottom).
P-value thresholds were chosen to best visualize clusters. Genes with degree≥5 are labeled, and size of points is proportional to node degree.
Fig 4
Fig 4
(a) Proportion of genes identified within suggestive interaction associations (p≤1e-5) that would have been identified using the same threshold in a single gene TWAS. Data in S3 Table. (b) Relationships of TWIS interaction effect sizes and main effect sizes of the same genes from TWAS (single locus model). Estimates of effects from all genes identified in TWIS included across traits and tissues, but each TWIS-identified gene is included only once per trait and tissue combination, even if a gene interacted with multiple other genes.
Fig 5
Fig 5. Gene set enrichment across all tissues and traits for those sets with at least one significant test (FDR<5%).
Black indicates that the gene set association was not evaluated for that tissue and trait combination. X-axis shows the trait and tissue, where C indicates PFC and 1–3 represent the cross-tissue sparse canonical correlation axes 1–3. Phenotype details are in the S1 Note and S1 Table.
Fig 6
Fig 6. Neuronal cell type [72] gene set interaction association enrichment across all tissues and traits.
X-axis shows the trait and tissue, where C indicates PFC and 1–3 represent the cross-tissue sparse canonical correlation axes 1–3.

References

    1. Price AL, Spencer CC, Donnelly P. Progress and promise in understanding the genetic basis of common diseases. Proc Biol Sci. 2015;282(1821):20151684. Epub 2015/12/25. doi: 10.1098/rspb.2015.1684 . - DOI - PMC - PubMed
    1. Visscher PM, Brown MA, McCarthy MI, Yang J. Five years of GWAS discovery. Am J Hum Genet. 2012;90(1):7–24. Epub 2012/01/17. doi: 10.1016/j.ajhg.2011.11.029 . - DOI - PMC - PubMed
    1. Gusev A, Ko A, Shi H, Bhatia G, Chung W, Penninx BW, et al.. Integrative approaches for large-scale transcriptome-wide association studies. Nat Genet. 2016;48(3):245–52. Epub 2016/02/09. doi: 10.1038/ng.3506 . - DOI - PMC - PubMed
    1. Gusev A, Mancuso N, Won H, Kousi M, Finucane HK, Reshef Y, et al.. Transcriptome-wide association study of schizophrenia and chromatin activity yields mechanistic disease insights. Nat Genet. 2018;50(4):538–48. Epub 2018/04/11. doi: 10.1038/s41588-018-0092-1 . - DOI - PMC - PubMed
    1. Barbeira AN, Dickinson SP, Bonazzola R, Zheng J, Wheeler HE, Torres JM, et al.. Exploring the phenotypic consequences of tissue specific gene expression variation inferred from GWAS summary statistics. Nat Commun. 2018;9(1):1825. Epub 2018/05/10. doi: 10.1038/s41467-018-03621-1 . - DOI - PMC - PubMed

Publication types

MeSH terms