. 2023 May 30;120(22):e2220124120.
doi: 10.1073/pnas.2220124120. Epub 2023 May 22.

Reproductive inequality in humans and other mammals

Cody T Ross  1   2 Paul L Hooper  1   3 Jennifer E Smith  4 Adrian V Jaeggi  5 Eric Alden Smith  6 Sergey Gavrilets  7 Fatema Tuz Zohora  8 John Ziker  9 Dimitris Xygalatas  10 Emily E Wroblewski  11 Brian Wood  2   12 Bruce Winterhalder  13 Kai P Willführ  14 Aiyana K Willard  15 Kara Walker  16 Christopher von Rueden  17 Eckart Voland  18 Claudia Valeggia  19 Bapu Vaitla  20 Samuel Urlacher  21   22 Mary Towner  23 Chun-Yi Sum  24 Lawrence S Sugiyama  25 Karen B Strier  26 Kathrine Starkweather  27 Daniel Major-Smith  28 Mary Shenk  29 Rebecca Sear  30 Edmond Seabright  3 Ryan Schacht  31 Brooke Scelza  12 Shane Scaggs  32 Jonathan Salerno  33 Caissa Revilla-Minaya  2 Daniel Redhead  2 Anne Pusey  34 Benjamin Grant Purzycki  2   35 Eleanor A Power  1   36 Anne Pisor  2   37 Jenni Pettay  38 Susan Perry  12 Abigail E Page  30 Luis Pacheco-Cobos  39 Kathryn Oths  40 Seung-Yun Oh  41 David Nolin  42 Daniel Nettle  43 Cristina Moya  13 Andrea Bamberg Migliano  5 Karl J Mertens  9 Rita A McNamara  44 Richard McElreath  2 Siobhan Mattison  3 Eric Massengill  3 Frank Marlowe  45 Felicia Madimenos  46 Shane Macfarlan  47 Virpi Lummaa  38 Roberto Lizarralde  48 Ruizhe Liu  3 Melissa A Liebert  49 Sheina Lew-Levy  2   50 Paul Leslie  51 Joseph Lanning  52 Karen Kramer  47 Jeremy Koster  2   53 Hillard S Kaplan  54 Bayarsaikhan Jamsranjav  55 A Magdalena Hurtado  56 Kim Hill  56 Barry Hewlett  37 Samuli Helle  38 Thomas Headland  57 Janet Headland  57 Michael Gurven  58 Gianluca Grimalda  59 Russell Greaves  47 Christopher D Golden  20 Irene Godoy  60 Mhairi Gibson  28 Claire El Mouden  61 Mark Dyble  62 Patricia Draper  63 Sean Downey  32 Angelina L DeMarco  47 Helen Elizabeth Davis  64 Stefani Crabtree  1   65 Carmen Cortez  13 Heidi Colleran  2 Emma Cohen  61 Gregory Clark  66 Julia Clark  67 Mark A Caudell  37 Chelsea E Carminito  53 John Bunce  2 Adam Boyette  2 Samuel Bowles  1 Tami Blumenfield  3   68 Bret Beheim  2 Stephen Beckerman  29 Quentin Atkinson  69 Coren Apicella  70 Nurul Alam  8 Monique Borgerhoff Mulder  1   2   13
Affiliations

Reproductive inequality in humans and other mammals

Cody T Ross et al. Proc Natl Acad Sci U S A. .

Abstract

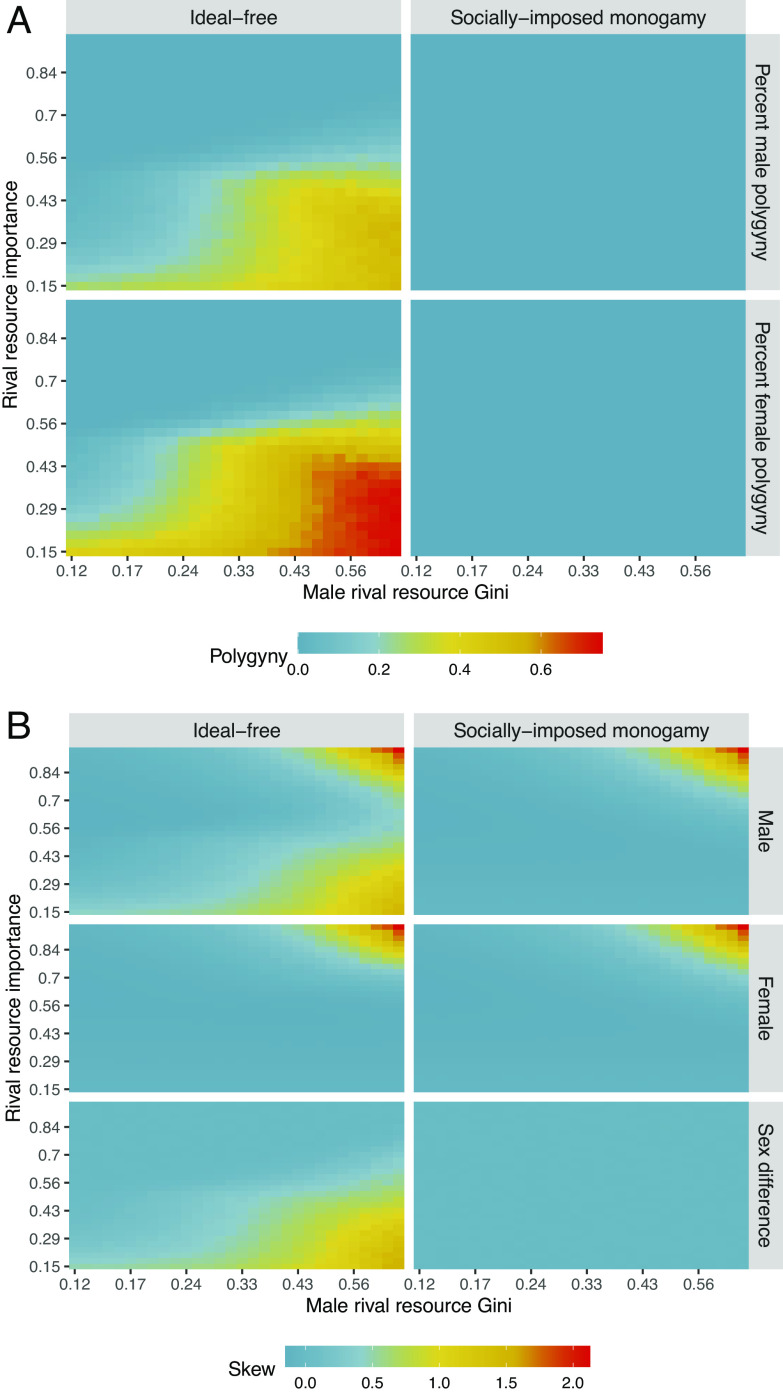
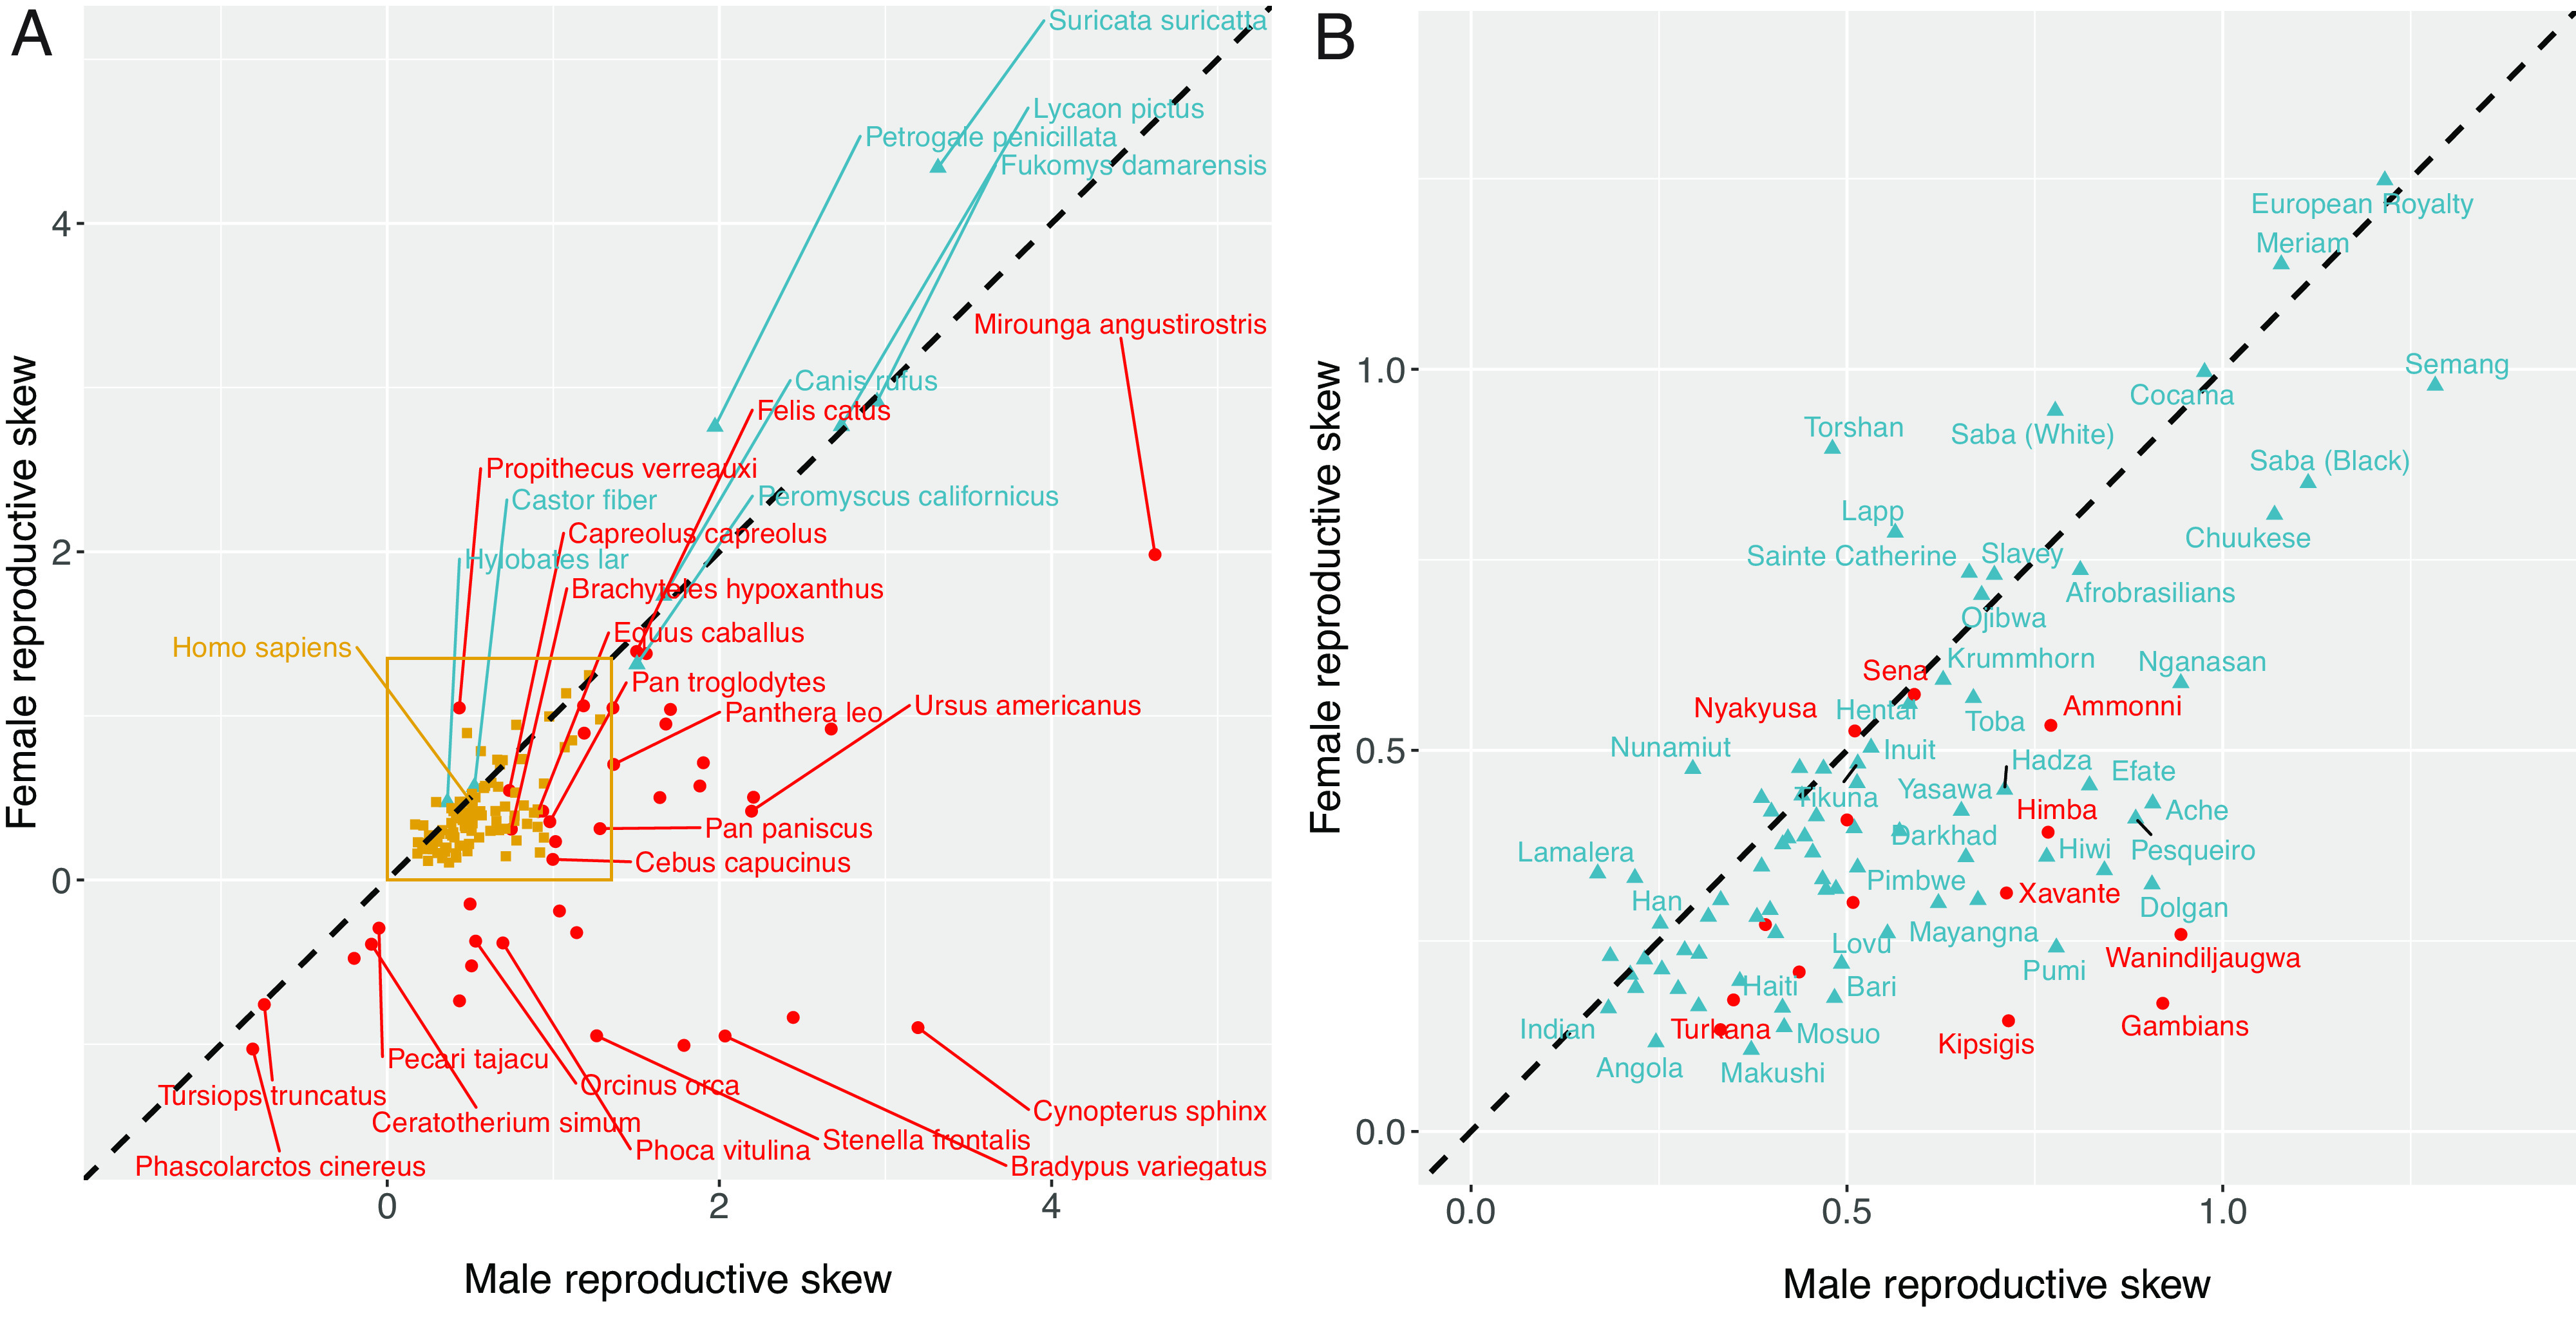
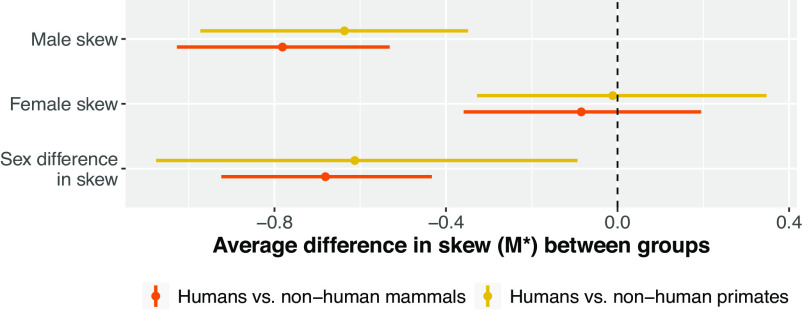
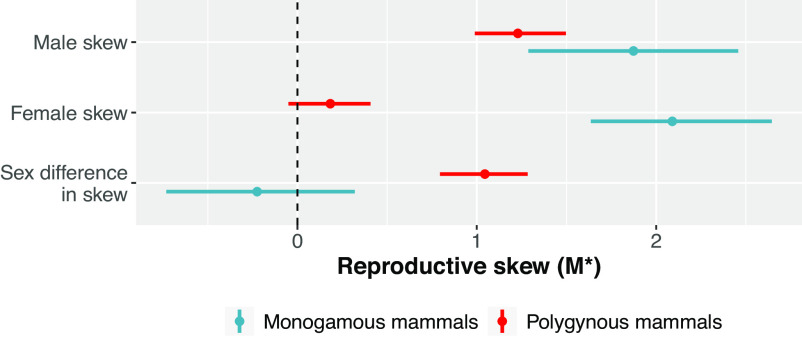
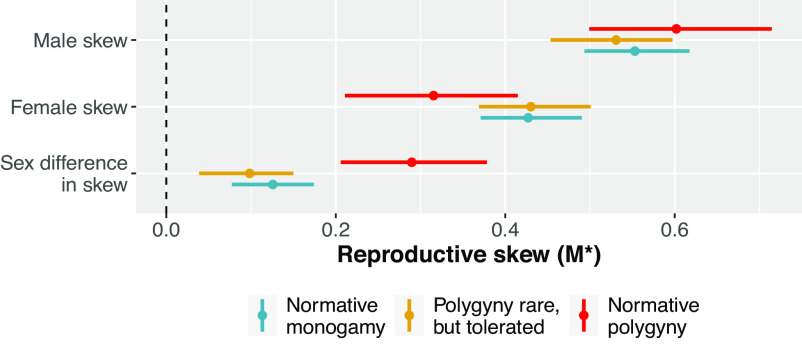
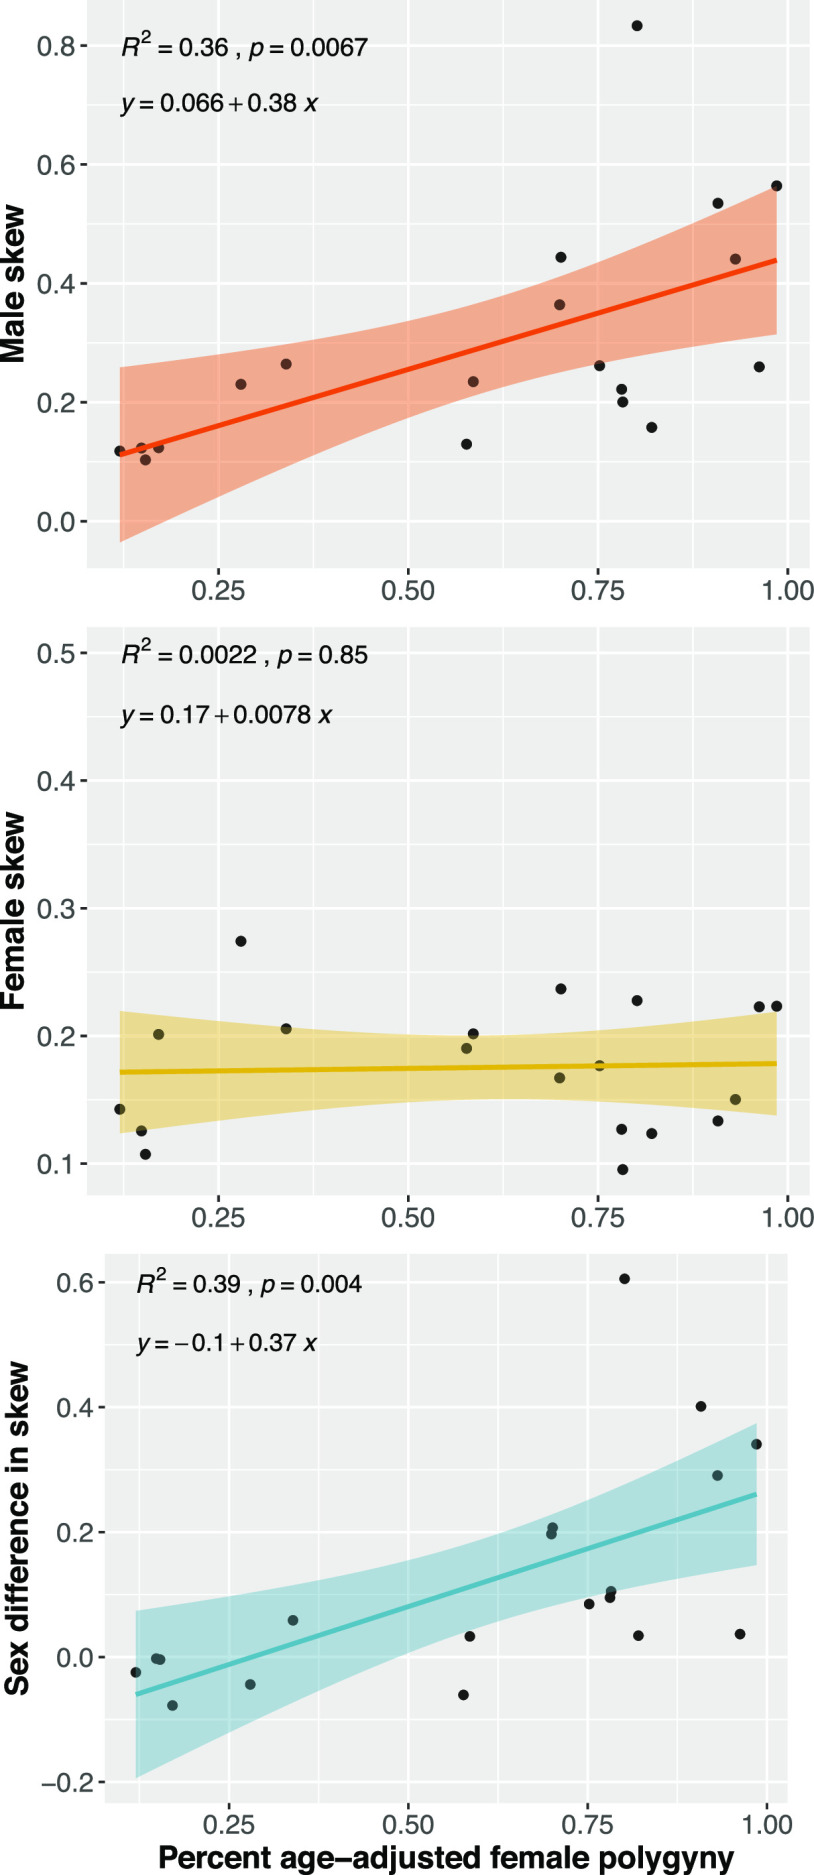
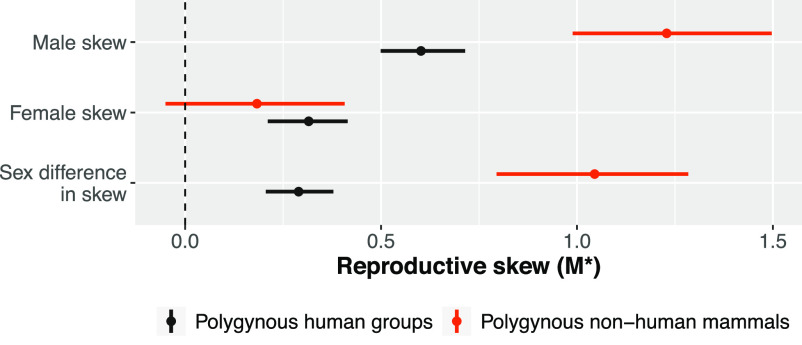
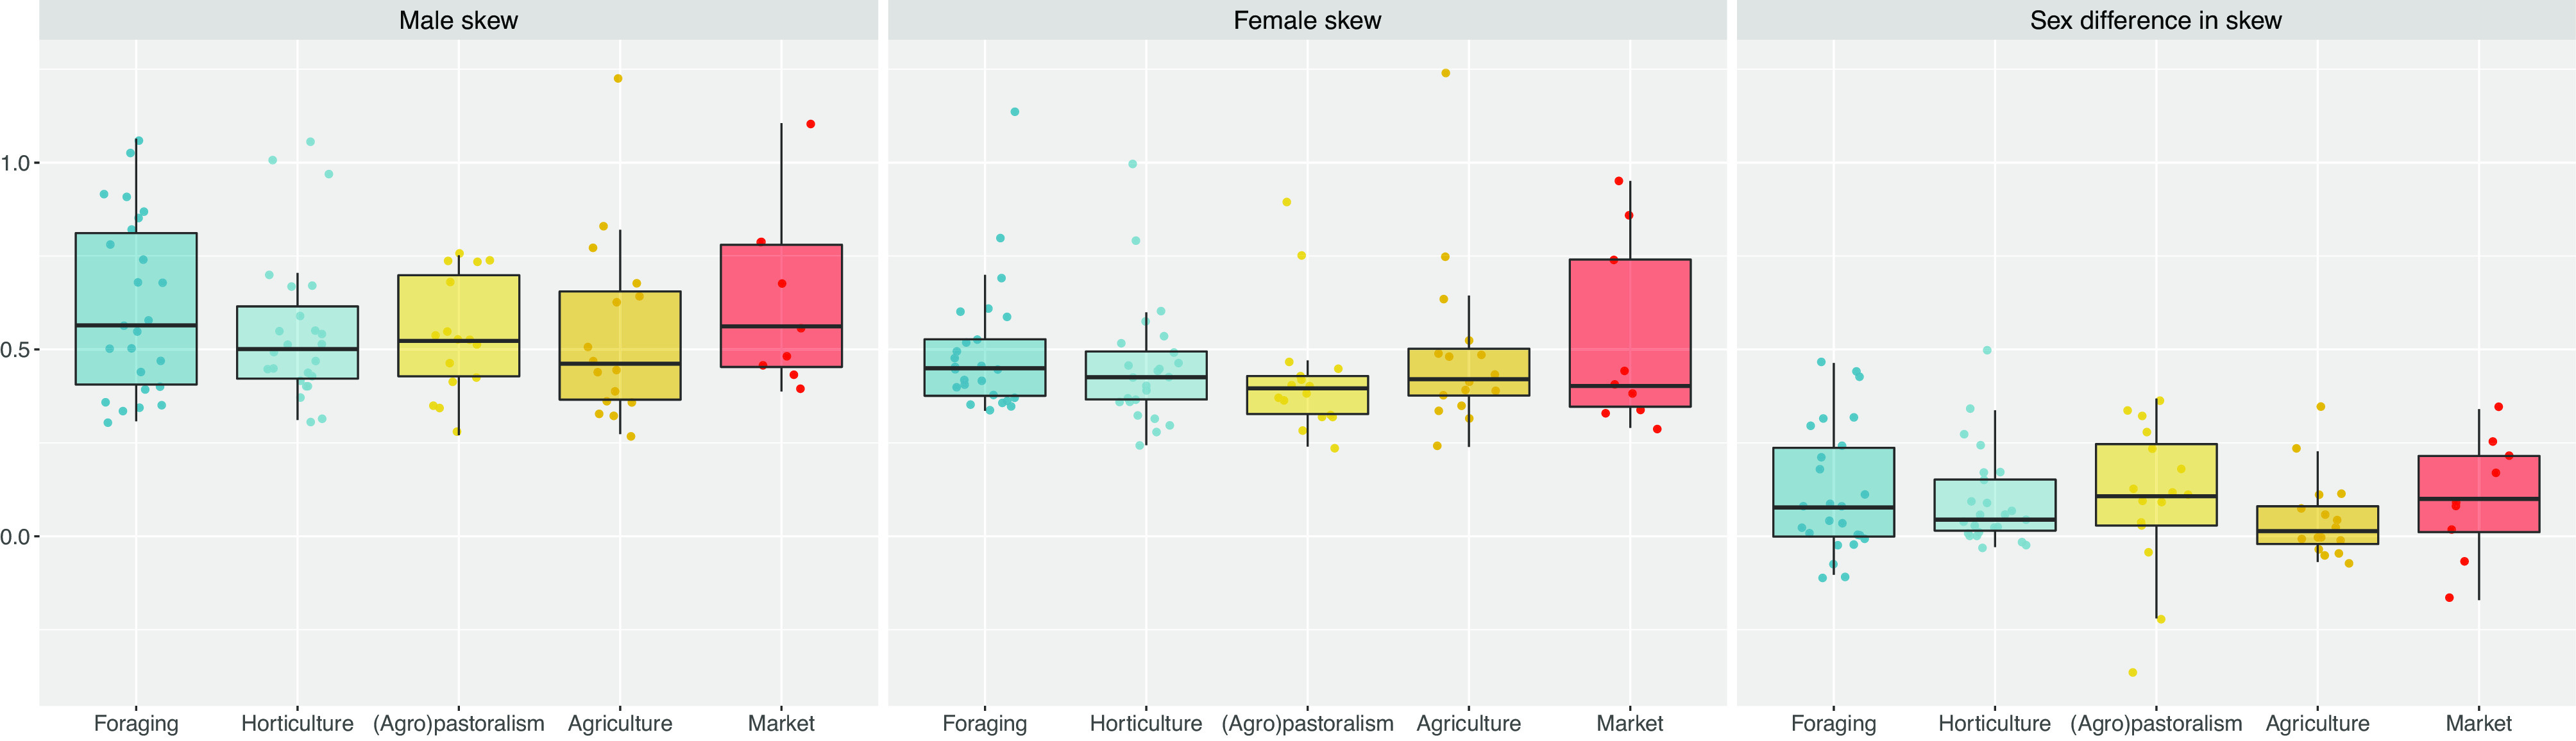
To address claims of human exceptionalism, we determine where humans fit within the greater mammalian distribution of reproductive inequality. We show that humans exhibit lower reproductive skew (i.e., inequality in the number of surviving offspring) among males and smaller sex differences in reproductive skew than most other mammals, while nevertheless falling within the mammalian range. Additionally, female reproductive skew is higher in polygynous human populations than in polygynous nonhumans mammals on average. This patterning of skew can be attributed in part to the prevalence of monogamy in humans compared to the predominance of polygyny in nonhuman mammals, to the limited degree of polygyny in the human societies that practice it, and to the importance of unequally held rival resources to women's fitness. The muted reproductive inequality observed in humans appears to be linked to several unusual characteristics of our species-including high levels of cooperation among males, high dependence on unequally held rival resources, complementarities between maternal and paternal investment, as well as social and legal institutions that enforce monogamous norms.

Keywords: egalitarian syndrome; inequality; mating systems; monogamy; reproductive skew.


Conflict of interest statement

The authors declare no competing interest.

Figures

Fig. 1.
Fig. 1.
Polygyny intensity and reproductive skew as a function of male rival resource inequality, rival resource importance, and mating system norms using the generalized polygyny threshold model introduced by Oh et al. (19). Male rival resource inequality, R, is measured using the Gini coefficient and ranges ∈(0.12, 0.64). Rival resource importance, μ, is measured using the fitness elasticity of rival resources and ranges ∈(0.15, 0.95). Nonrival resources, G, are held constant with a Gini coefficient of 0.12. Nonrival resource importance, γ, is measured using the fitness elasticity of nonrival resources and is given by the equation γ = 1 − μ to ensure constant returns to scale. For further methodological and mathematical details, SI Appendix, S3. (A) Male polygyny (e.g., percentage of married men with more than one wife) and female polygyny (e.g., percentage of women with cowives) as a function of male rival resource inequality, rival resource importance to fitness, and mating system norms. (B) Reproductive skew, M, as a function of male rival resource inequality, rival resource importance to fitness, and mating system norms.
Fig. 2.
Fig. 2.
Raw data on male and female reproductive skew in mammals (Left) and humans (Right). In panel (A), polygynous nonhuman mammal values are plotted with red circles, monogamous nonhuman mammal values are plotted with blue triangles, and human values are plotted with goldenrod squares. In panel (B), polygynous human values are plotted with red circles, and monogamous human values are plotted with blue triangles. In both panels, points on the dashed diagonal line represent groups with equal male and female skew values. Points below the line indicate groups where male skew exceeds female skew, and vice versa for points above the line. Because M values are very high for some species, we visualize the data using the signed square root transform: M=sign(M)|M|. (A) Male and female reproductive skew across species. (B) Male and female reproductive skew across human populations.
Fig. 3.
Fig. 3.
Posterior distributions of the difference in reproductive skew between humans and nonhuman mammals/nonhuman primates. Points represent posterior mean differences, and horizontal bars represent 89% credible regions. The dashed vertical line at zero indicates no difference. Humans stand out from both nonhuman mammals, generally, and nonhuman primates, specifically, in terms of having lower values of average male reproductive skew and lower sex differences in skew. Female reproductive skew, however, appears similar in humans and both nonhuman mammals and nonhuman primates—on average. Sample sizes: N = 90 human populations, N = 49 nonhuman mammal species, N = 12 nonhuman primate species.
Fig. 4.
Fig. 4.
Posterior distributions of reproductive skew values (M*) in nonhuman mammals as a function of mating system. Points represent posterior means, and lines represent 89% credible regions. The dashed vertical line at M* = 0 indicates that reproduction is neither positively skewed, nor more equal than would be expected under a random model. Monogamous nonhuman mammals stand out from polygynous nonhuman mammals, in terms of having significantly higher absolute values of male and female reproductive skew, and significantly lower sex differences in skew. Female reproductive skew, in particular, is strongly damped in polygynous species and elevated in monogamous species. Sample sizes: N = 49 nonhuman mammal species (8 monogamous, 41 polygynous).
Fig. 5.
Fig. 5.
Posterior distributions of reproductive skew values (M*) in humans as a function of marriage system. Points represent posterior means, and lines represent 89% credible regions. The dashed vertical line at M* = 0 indicates that reproduction is neither positively skewed, nor more equal than would be expected by a random model. In general, male reproductive skew appears fairly invariant to marriage system. Female skew appears slightly higher in human populations with socially imposed monogamy (normative monogamy) than populations in which polygyny is widely practiced (normative polygyny). Across all marriage system types, sex differences in skew are reliably different from zero—indicating that male reproduction is slightly more unequal than female reproduction, even where monogamy is imposed (normative monogamy) or frequent (polygyny rare, but tolerated). In contexts where polygyny is common, sex differences in skew are especially high. Sample sizes: N = 90 human populations (43 normative monogamy, 33 polygyny permitted, and 14 normative polygyny).
Fig. 6.
Fig. 6.
A strong positive relationship between male skew (Top frame) and sex differences in skew (Bottom frame), as a function of percent age-adjusted female polygyny in humans. Percent age-adjusted female polygyny is the predicted fraction of women married to men with more than one total wife by age 60 (see ref. , for details). The solid line plots the posterior mean regression, while the shaded area plots the 95% posterior credibility region. The black points give the data. Sample size: N = 19 human populations.
Fig. 7.
Fig. 7.
A different patterning of skew in polygynous human populations and polygynous nonhuman mammals. Points represent posterior means, and lines represent 89% credible regions. The dashed vertical line at M* = 0 indicates that reproduction is neither positively skewed nor more equal than would be expected by a random model. Male reproductive skew in polygynous humans is substantially lower than in polygynous nonhuman mammals: The contrast is −0.59 (89%CI: −0.87, −0.32). Female skew is also higher in polygynous human populations than in polygynous nonhuman mammals: The contrast is 0.2 (89%CI: −0.05, 0.43). Sex differences in skew are therefore much lower in polygynous human populations than in polygynous nonhuman mammals: The contrast is −0.80 (89%CI: −1.03, −0.53). Sample sizes: N = 14 polygynous human populations and N = 41 polygynous nonhuman mammal species.
Fig. 8.
Fig. 8.
The distribution of sex-specific reproductive skew values as a function of subsistence mode in N = 90 human populations. We find that reproductive skew does not vary strongly by subsistence mode.

References

    1. Richerson P. J., Boyd R., Not by Genes Alone: How Culture Transformed Human Evolution (University of Chicago Press, 2008).
    1. C. P. van Schaik, J. M. Burkart, “Cooperative breeding and the evolution of our unique features” in Mind the Gap, P. M. Kappeler, J. B. Silk, Eds. (Springer, 2010), pp. 477–496.
    1. Bowles S., Gintis H., A Cooperative Species (Princeton University Press, 2011).
    1. Bramble D. M., Lieberman D. E., Endurance running and the evolution of Homo. Nature 432, 345–352 (2004). - PubMed
    1. Kaplan H., Hill K., Lancaster J., Hurtado A. M., A theory of human life history evolution. Evol. Anthropol. 9, 156–185 (2000).

Publication types