. 2023 Aug 24;142(8):711-723.
doi: 10.1182/blood.2022019094.

The genomic landscape of acute lymphoblastic leukemia with intrachromosomal amplification of chromosome 21

Affiliations

The genomic landscape of acute lymphoblastic leukemia with intrachromosomal amplification of chromosome 21

Qingsong Gao et al. Blood. .

Abstract

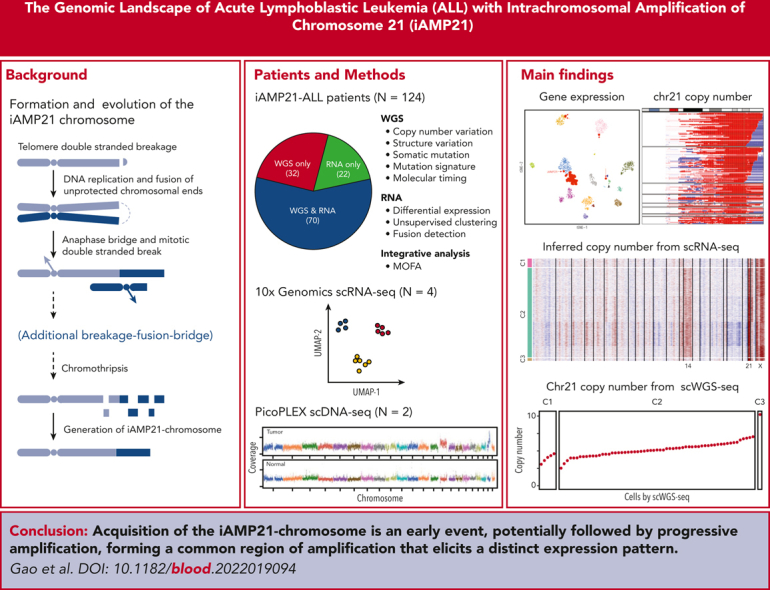
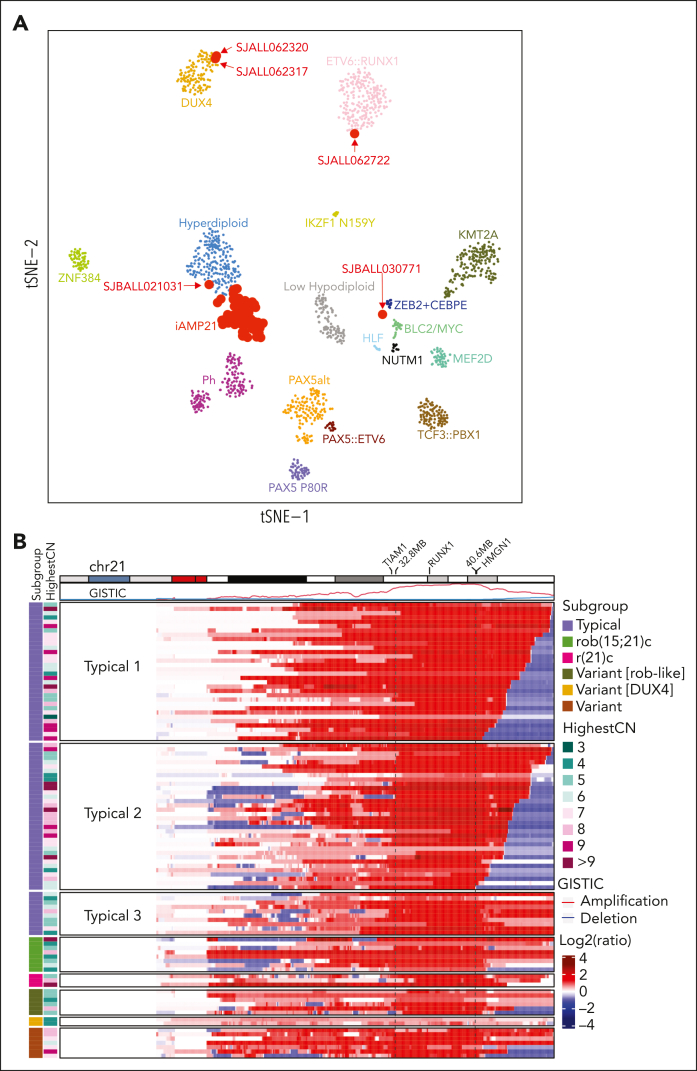
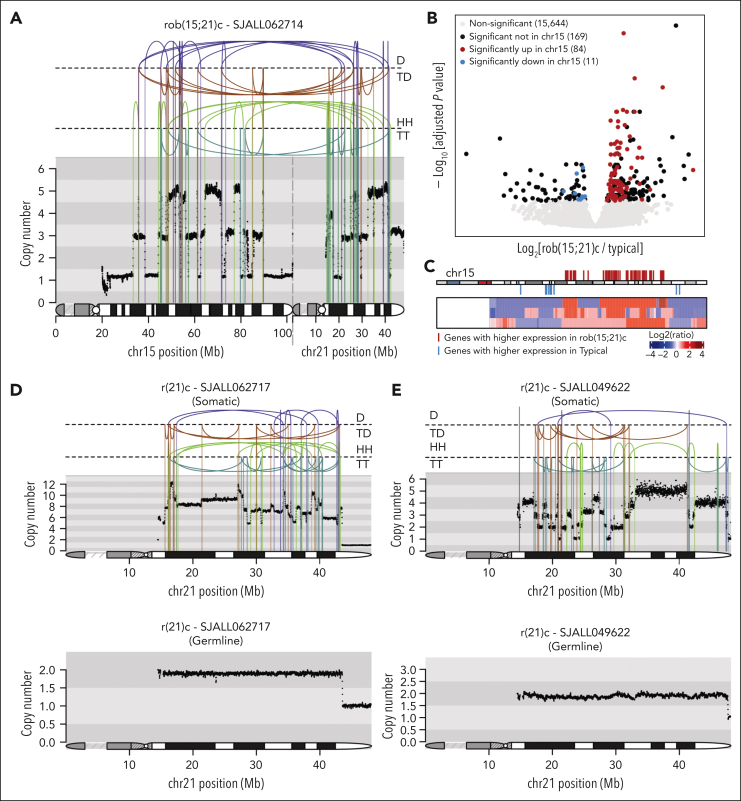
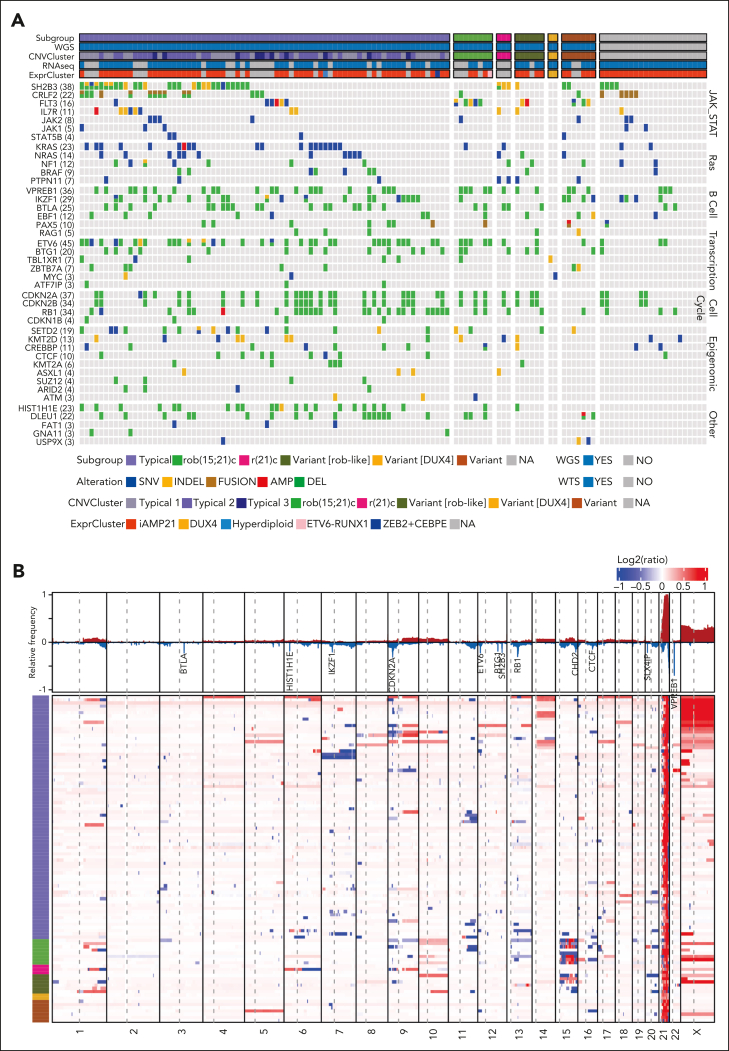
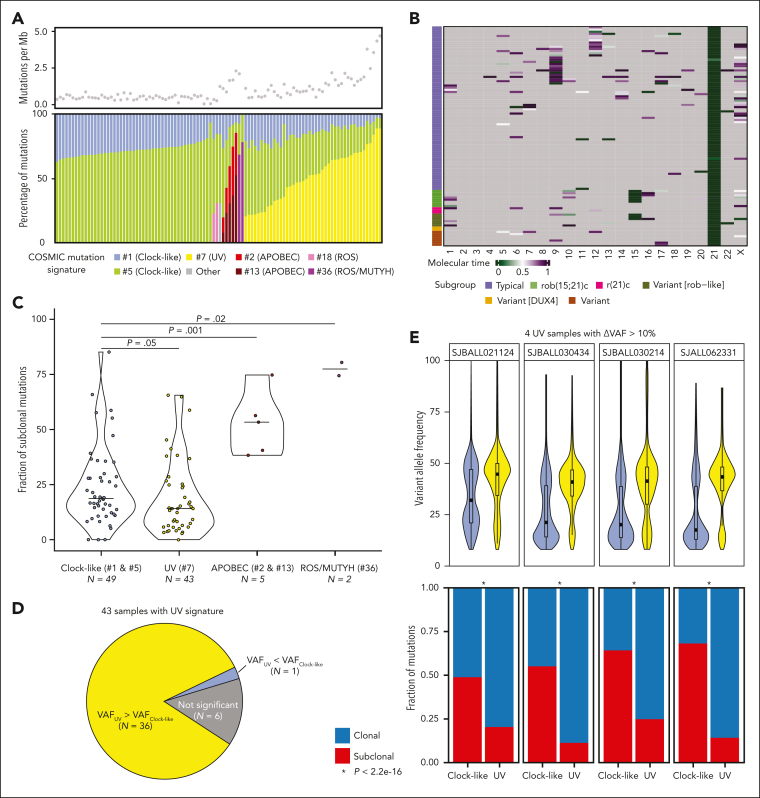
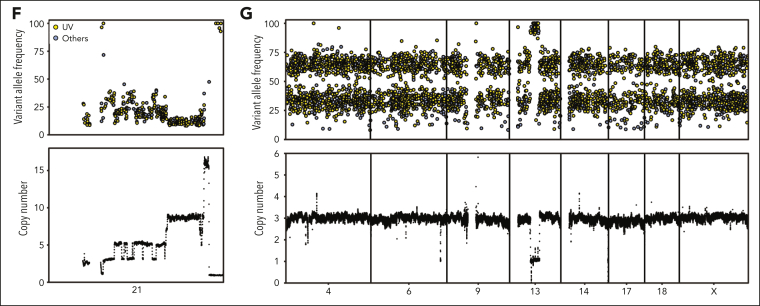
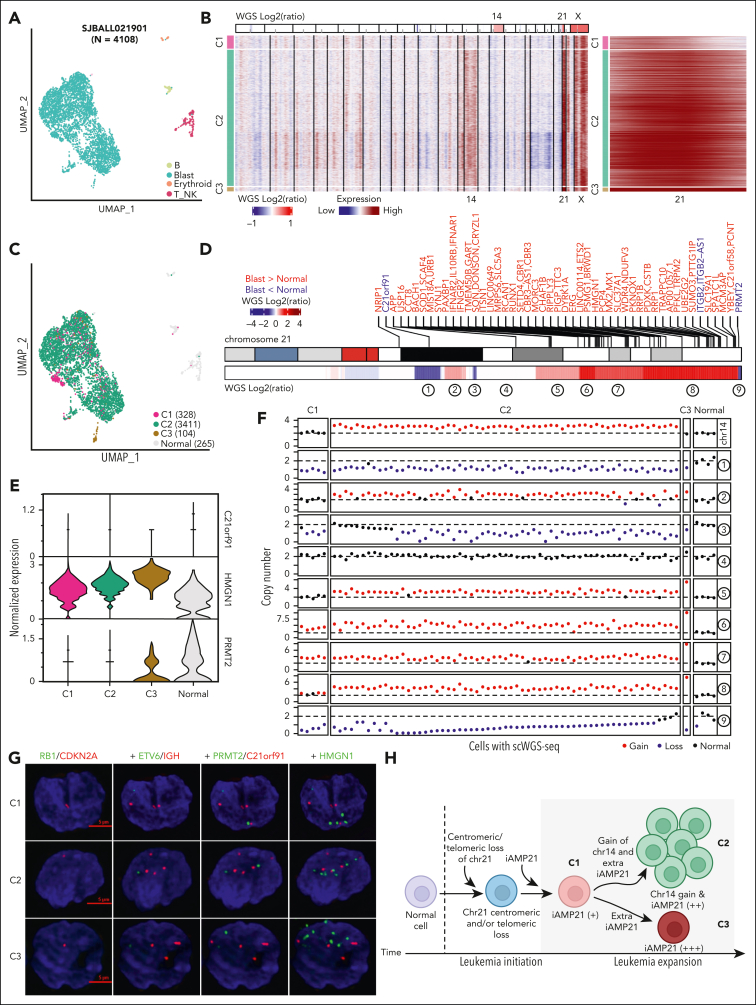
Intrachromosomal amplification of chromosome 21 defines a subtype of high-risk childhood acute lymphoblastic leukemia (iAMP21-ALL) characterized by copy number changes and complex rearrangements of chromosome 21. The genomic basis of iAMP21-ALL and the pathogenic role of the region of amplification of chromosome 21 to leukemogenesis remains incompletely understood. In this study, using integrated whole genome and transcriptome sequencing of 124 patients with iAMP21-ALL, including rare cases arising in the context of constitutional chromosomal aberrations, we identified subgroups of iAMP21-ALL based on the patterns of copy number alteration and structural variation. This large data set enabled formal delineation of a 7.8 Mb common region of amplification harboring 71 genes, 43 of which were differentially expressed compared with non-iAMP21-ALL ones, including multiple genes implicated in the pathogenesis of acute leukemia (CHAF1B, DYRK1A, ERG, HMGN1, and RUNX1). Using multimodal single-cell genomic profiling, including single-cell whole genome sequencing of 2 cases, we documented clonal heterogeneity and genomic evolution, demonstrating that the acquisition of the iAMP21 chromosome is an early event that may undergo progressive amplification during disease ontogeny. We show that UV-mutational signatures and high mutation load are characteristic secondary genetic features. Although the genomic alterations of chromosome 21 are variable, these integrated genomic analyses and demonstration of an extended common minimal region of amplification broaden the definition of iAMP21-ALL for more precise diagnosis using cytogenetic or genomic methods to inform clinical management.


Conflict of interest statement

Conflict-of-interest disclosure: C.G.M. received research funding from Loxo Oncology, Pfizer, and AbbVie; honoraria from Amgen and Illumina; and holds stock in Amgen. M.T.R., D.R.B., Z.K., and T.J. are employees of Illumina Inc, a public company that develops and markets systems for genetic analysis. The remaining authors declare no competing financial interests.

Figures

None
Graphical abstract
Figure 1.
Figure 1.
Clustering pattern based on gene expression and chromosome 21 copy number variation of iAMP21-ALL. (A) t-distributed stochastic neighbor embedding plot showing gene expression profiling of 1493 B-ALL samples, including 92 iAMP21-ALL samples. Each dot represents a sample. The top 1000 most variable genes (on the basis of median absolute deviation) were selected and processed by the t-distributed stochastic neighbor embedding algorithm with a perplexity score of 30. Eighty-seven cases clustered together, forming an iAMP21-ALL cluster. One carrier of rob(15;21)c with a tetraploid clone clustered with the ETV6::RUNX1 cases (SJALL062722), 1 typical case clustered with the ZEB2 plus CEBPE group (SJBALL030771), and 1 typical case with gains of chromosomes 14 and 21 clustered with high hyperdiploidy (SJBALL021031), whereas 2 cases were located within the DUX4 cluster. (B) Heatmap showing DNA copy number profiles of chromosome 21 derived from WGS data of 102 cases. The log2 ratio of copy number was calculated based on the tumor and germ line samples for each case, with red and blue showing copy number amplification/gain and deletion, respectively. Each row represents a sample. The ideogram for chromosome 21 as well as GISTIC scores for copy number amplification and deletion is shown across the top. Subgroup information and the number of copies in the most highly amplified region (HighestCN) are shown on the left. The highlighted region between the 2 dashed lines represents the common region of gain derived from GISTIC analysis including all patients (32.8-40.6 Mb, between TIAM1 and HMGN1). RUNX1 is located within this common region. Typical 1 cases (n = 32) exhibit the deletion of the chromosome 21 sub-telomeric region without juxta-centromeric deletions. The size of the sub-telomeric deletions ranged from 0.1 Mb to 6.9 Mb. Typical 2 cases (n = 34) exhibit the deletion of both sub-telomeric and juxta-centromeric regions of chromosome 21. Typical 3 cases (n = 10) exhibit deletions of only juxta-centromeric regions.
Figure 2.
Figure 2.
Copy number and gene expression profiles for rob(15;21)c and r(21)c iAMP21-ALL cases. (A) Example of the copy number and rearrangement profile of the der(15;21) chromosome for patient SJALL062714 with rob(15;21)c. Copy number is indicated on the y-axis, and the chromosome 15 and 21 ideograms are shown along the bottom of the plot to indicate breakpoint location. Rearrangements are separated based on their orientation: (B) Volcano plot comparing gene expression pattern between rob(15;21)c and typical subgroups. Only those cases in the main iAMP21-ALL cluster of Figure 1B with matched WGS and WTS were used in this analysis. Two hundred sixty-four genes showed significant differences (adjusted P value < .05), including 95 (36%) on chromosome 15 (84 and 11 upregulated and downregulated, respectively in rob(15;21)c compared with typical groups). (C) Heatmap showing the copy-number profile of chromosome 15 for 3 rob(15;21)c cases with matched WGS and WTS. Log2 ratios of copy number calculated based on the tumor and germ line samples for each case were used, with red and blue showing copy number amplification/gain and deletion, respectively. Each row represents a sample. The ideogram for chromosome 15 is shown on the top of the heatmap. Genes with significantly higher and lower expression in rob(15;21)c compared with those in typical cases are shown in red and blue, respectively, and listed in supplemental Table 8. (D-E) Rearrangement and copy number patterns of 2 cases with r(21)c: SJALL062717 (D) and SJALL049622 (E). Somatic and germ line profiles are shown at the top and bottom, respectively. Rearrangements are separated based on their orientation. D, deletion; HH, head-to-head inverted; TD, tandem duplication; TT, tail-to-tail inverted.
Figure 3.
Figure 3.
Genomic profile of iAMP21-ALL. (A) Oncoprint of focal genomic changes in iAMP21-ALL. Sequence mutations were detected among WGS, WES, and WTS data. Copy number variations were detected using WGS and SNP array data. Internal tandem duplication and gene fusions were detected using WTS data. Variations in common pathways, including JAK-STAT signaling, Ras signaling, B-cell differentiation, transcriptional regulation, cell cycle/apoptosis, epigenomic, and PI3K-AKT signaling ubiquitination, are shown. Subgroup, data availability, and cluster location based on WTS data (ExprCluster) (Figure 1C) are shown across the top of the heatmap. (B) Heatmap showing genome-wide copy number profiles for 102 cases with high quality WGS. Log2 ratios of copy number calculated based on the tumor and germ line samples for each case were used, with red and blue indicating copy number amplification/gain and deletion, respectively. Each row represents a sample. The subgroup information is shown on the left. The relative frequencies for copy number amplification (red) and copy number deletion (blue) across all the cases are shown at the top. The genes with a high frequency of focal deletion are highlighted.
Figure 4.
Figure 4.
Mutation signature and molecular time of somatic mutations in iAMP21-ALL. (A) (Top) Scatterplot showing the number of mutations per Mb. (Bottom) Barplot showing faction of mutations in different COSMIC mutational signatures for each patient. Clock-like signatures (#1 and #5) are present in all the patients, 43 cases have UV signature mutations (#7), 5 cases have APOBEC signatures (#2 and #13), 2 cases have ROS/MUTYH signatures (#36), and 2 have ROS signatures (#18), both of which have DUX4-rearrangements. (B) Heatmap showing the molecular timing of copy number gains and CN-LOH. Chromothripsis of chromosomes 21 and 15 tend to occur early, whereas other variations have inconsistent patterns. (C) Violin plot showing the fraction of subclonal mutations across the samples with different mutation signatures. The fraction of subclonal mutations in the samples with UV-mutational signatures are significantly lower than that the samples with only a clock-like signature (P = .05), whereas the samples with APOBEC or ROS/MUTYH signatures are significantly higher (P = .001 and .02, respectively, two-sided Wilcoxon rank-sum test). (D) Pie chart showing 36 of 43 samples with UV-mutational signatures have significantly higher VAF for UV signature mutations than clock-like signature mutations. (E) (Top) Violin plot showing that 4 samples with UV-mutational signatures have VAF difference >10% between the UV signature and clock-like signature mutations. (Bottom) Barplot showing that for all 4 samples there are significantly higher fractions of clonal mutations in the UV signature than the clock-like signature. (F) Scatterplot showing VAF distribution for somatic mutations on chromosome 21 colored by mutation signatures (top) and the copy number profile (bottom) in patient SJALL062328. UV-induced mutations on chromosome 21 (n = 259) were not represented on the amplified allele (>9 copies), demonstrating that they occurred after iAMP21 chromosome formation. (G) Scatterplot showing VAF distribution for somatic mutations on chromosomes 4, 6, 9, 13, 14, 17, 18, and X colored based on mutation signatures (top) and their copy number profiles (bottom) in patient SJALL062328. The VAF was indicative of mutations arising on 1 of 3 and 2 of 3 alleles represented on the trisomic chromosomes, indicating that the mutations preceded chromosomal gain.
Figure 4.
Figure 4.
Mutation signature and molecular time of somatic mutations in iAMP21-ALL. (A) (Top) Scatterplot showing the number of mutations per Mb. (Bottom) Barplot showing faction of mutations in different COSMIC mutational signatures for each patient. Clock-like signatures (#1 and #5) are present in all the patients, 43 cases have UV signature mutations (#7), 5 cases have APOBEC signatures (#2 and #13), 2 cases have ROS/MUTYH signatures (#36), and 2 have ROS signatures (#18), both of which have DUX4-rearrangements. (B) Heatmap showing the molecular timing of copy number gains and CN-LOH. Chromothripsis of chromosomes 21 and 15 tend to occur early, whereas other variations have inconsistent patterns. (C) Violin plot showing the fraction of subclonal mutations across the samples with different mutation signatures. The fraction of subclonal mutations in the samples with UV-mutational signatures are significantly lower than that the samples with only a clock-like signature (P = .05), whereas the samples with APOBEC or ROS/MUTYH signatures are significantly higher (P = .001 and .02, respectively, two-sided Wilcoxon rank-sum test). (D) Pie chart showing 36 of 43 samples with UV-mutational signatures have significantly higher VAF for UV signature mutations than clock-like signature mutations. (E) (Top) Violin plot showing that 4 samples with UV-mutational signatures have VAF difference >10% between the UV signature and clock-like signature mutations. (Bottom) Barplot showing that for all 4 samples there are significantly higher fractions of clonal mutations in the UV signature than the clock-like signature. (F) Scatterplot showing VAF distribution for somatic mutations on chromosome 21 colored by mutation signatures (top) and the copy number profile (bottom) in patient SJALL062328. UV-induced mutations on chromosome 21 (n = 259) were not represented on the amplified allele (>9 copies), demonstrating that they occurred after iAMP21 chromosome formation. (G) Scatterplot showing VAF distribution for somatic mutations on chromosomes 4, 6, 9, 13, 14, 17, 18, and X colored based on mutation signatures (top) and their copy number profiles (bottom) in patient SJALL062328. The VAF was indicative of mutations arising on 1 of 3 and 2 of 3 alleles represented on the trisomic chromosomes, indicating that the mutations preceded chromosomal gain.
Figure 5.
Figure 5.
Clonal evolution of iAMP21-ALL using scRNA-seq. (A) Uniform manifold approximation and projection (UMAP) representation of the scRNA-seq data set from patient SJBALL021901. Clusters of cells are colored based on the cell types. (B) scRNA-seq derived copy number profiles for blast cells in patient SJBALL021901. Copy number profiles from WGS are shown (top); chromosomes with copy number gains are labeled. Three clusters were observed via scRNA-seq: C1 has the lowest copy number of chromosome 21 and no copy number gain of chromosome 14. C2 has an intermediate copy number gain of chromosome 21 together with copy number gain of chromosome 14. C3 has the highest copy number of chromosome 21 with no copy number gain of chromosome 14. Chromosome 21 is shown (right). (C) UMAP representation of the scRNA-seq data for SJBALL021901 colored based on the 3 copy number clusters. Healthy cells are shown in gray. (D) Heatmap showing copy number profiles of chromosome 21 derived from WGS data of SJBALL021901. Differentially expressed genes between blasts and healthy cells based on scRNA-seq are labeled on the top in red and blue for genes with higher and lower expression in blasts, respectively. Nine segments with varying copy number patterns are labeled at the bottom. (E) Violin plot showing the expression profile of 3 selected genes across different copy number clusters and healthy cells in SJBALL021901. (F) Scatterplot showing copy numbers of chromosome 14 and the 9 segments on chromosome 21, as illustrated in panel D, for 70 cells with single-cell WGS in SJBALL021901. These cells were assigned to different clusters based on their copy number patterns. (G) DNA FISH image of 3 representative cells from different copy number clusters of SJBALL021901. Seven probes were used in total, paired in 4 sequential hybridizations with imaging after every hybridization. The first hybridization is RB1 (green) and CDKN2A (red), the second is ETV6 (green) and IGH (red), the third is PRMT2 (green) and C21orf91 (red), and the fourth is HMGN1 (green). The scales (5 μm) are shown in red. (H) Schematic representation of the clonal evolution model in sample SJBALL021901. C1 is an early clone with a centromeric and/or telomeric loss and lower copy number gain of the iAMP21 chromosome, followed by 2 evolutionary tracks: (1) gain of chromosome 14 and further amplification of the iAMP21 chromosome, resulting in the generation of the predominant clone C2 and (2) further amplification of the iAMP21 chromosome without the gain of chromosome 14 in C3.

Comment in

References

    1. Moorman AV, Ensor HM, Richards SM, et al. Prognostic effect of chromosomal abnormalities in childhood B-cell precursor acute lymphoblastic leukaemia: results from the UK Medical Research Council ALL97/99 randomised trial. Lancet Oncol. 2010;11(5):429–438. - PubMed
    1. Hunger SP, Mullighan CG. Redefining ALL classification: toward detecting high-risk ALL and implementing precision medicine. Blood. 2015;125(26):3977–3987. - PMC - PubMed
    1. Hamadeh L, Enshaei A, Schwab C, et al. Validation of the United Kingdom copy-number alteration classifier in 3239 children with B-cell precursor ALL. Blood Adv. 2019;3(2):148–157. - PMC - PubMed
    1. Enshaei A, O'Connor D, Bartram J, et al. A validated novel continuous prognostic index to deliver stratified medicine in pediatric acute lymphoblastic leukemia. Blood. 2020;135(17):1438–1446. - PubMed
    1. Mullighan CG, Su X, Zhang J, et al. Deletion of IKZF1 and prognosis in acute lymphoblastic leukemia. N Engl J Med. 2009;360(5):470–480. - PMC - PubMed

Publication types

Substances