. 2023 May;11(5):e006649.
doi: 10.1136/jitc-2022-006649.

Intrinsic suppression of type I interferon production underlies the therapeutic efficacy of IL-15-producing natural killer cells in B-cell acute lymphoblastic leukemia

Affiliations

Intrinsic suppression of type I interferon production underlies the therapeutic efficacy of IL-15-producing natural killer cells in B-cell acute lymphoblastic leukemia

Anil Kumar et al. J Immunother Cancer. 2023 May.

Abstract

Background: Type I interferons (IFN-Is), secreted by hematopoietic cells, drive immune surveillance of solid tumors. However, the mechanisms of suppression of IFN-I-driven immune responses in hematopoietic malignancies including B-cell acute lymphoblastic leukemia (B-ALL) are unknown.

Methods: Using high-dimensional cytometry, we delineate the defects in IFN-I production and IFN-I-driven immune responses in high-grade primary human and mouse B-ALLs. We develop natural killer (NK) cells as therapies to counter the intrinsic suppression of IFN-I production in B-ALL.

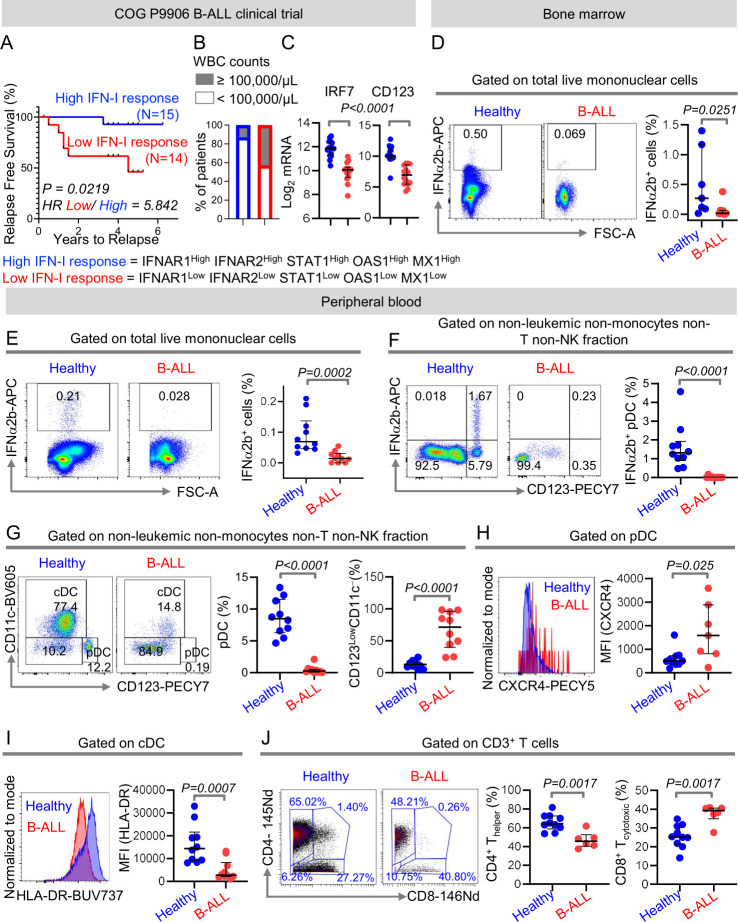
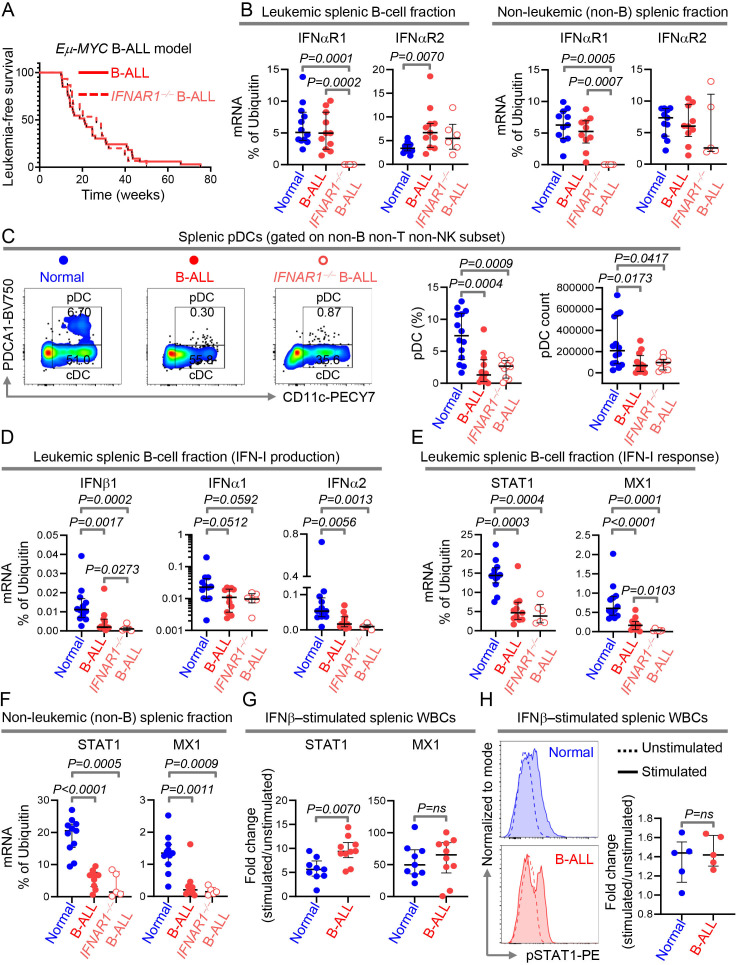
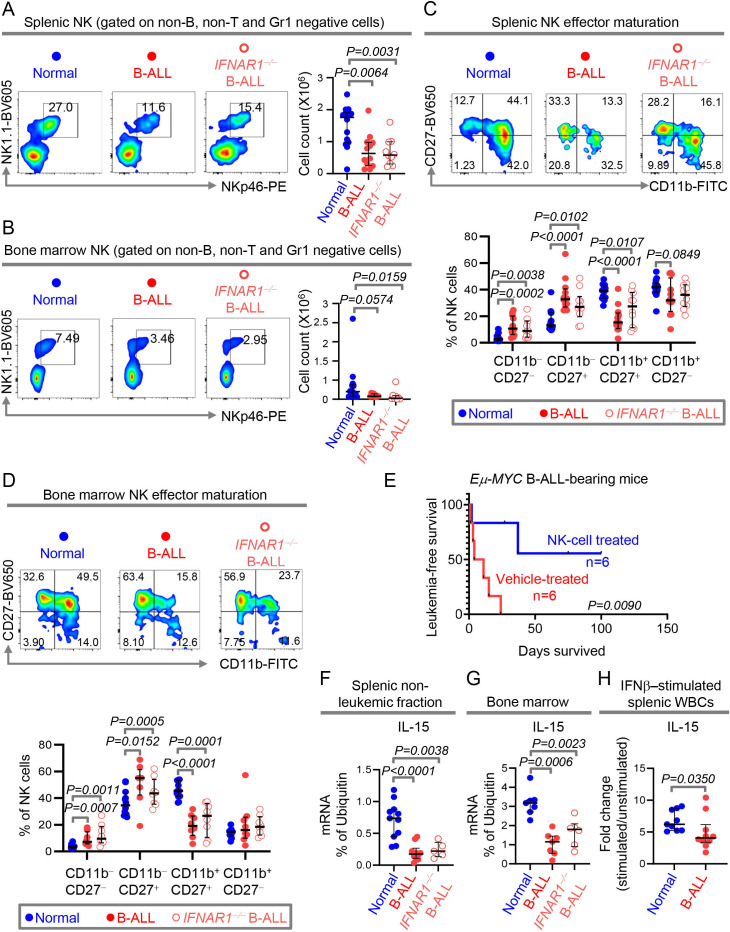
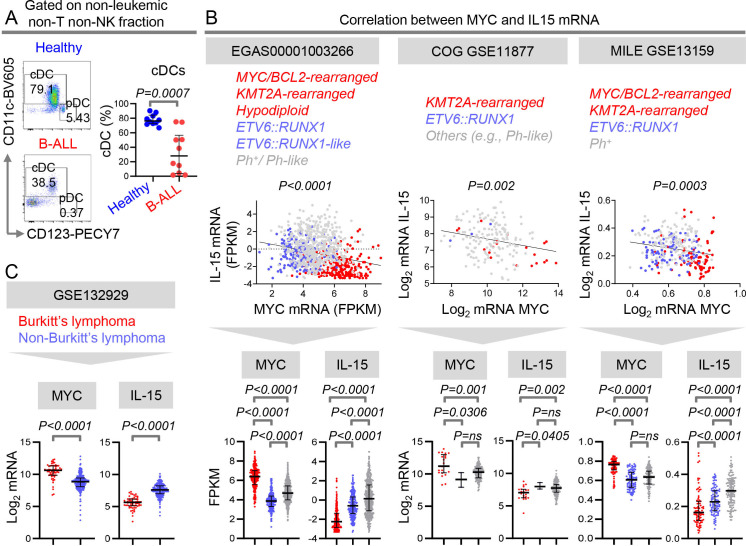
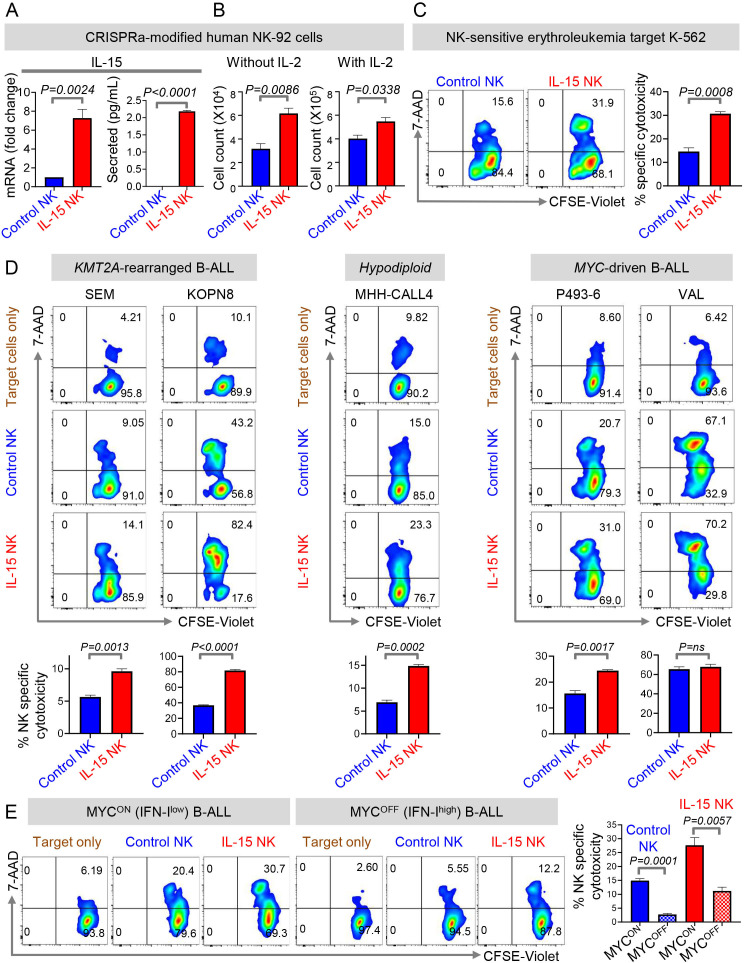
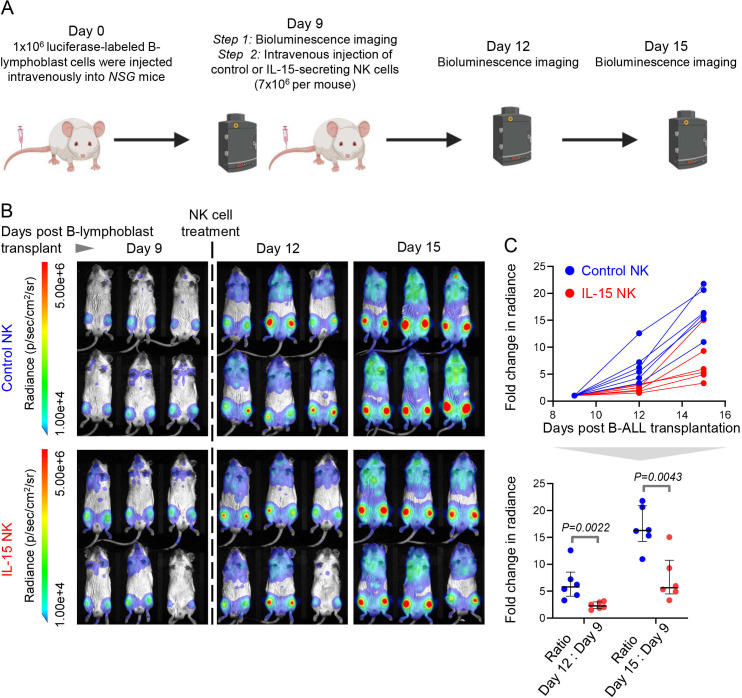
Results: We find that high expression of IFN-I signaling genes predicts favorable clinical outcome in patients with B-ALL, underscoring the importance of the IFN-I pathway in this malignancy. We show that human and mouse B-ALL microenvironments harbor an intrinsic defect in paracrine (plasmacytoid dendritic cell) and/or autocrine (B-cell) IFN-I production and IFN-I-driven immune responses. Reduced IFN-I production is sufficient for suppressing the immune system and promoting leukemia development in mice prone to MYC-driven B-ALL. Among anti-leukemia immune subsets, suppression of IFN-I production most markedly lowers the transcription of IL-15 and reduces NK-cell number and effector maturation in B-ALL microenvironments. Adoptive transfer of healthy NK cells significantly prolongs survival of overt ALL-bearing transgenic mice. Administration of IFN-Is to B-ALL-prone mice reduces leukemia progression and increases the frequencies of total NK and NK-cell effectors in circulation. Ex vivo treatment of malignant and non-malignant immune cells in primary mouse B-ALL microenvironments with IFN-Is fully restores proximal IFN-I signaling and partially restores IL-15 production. In B-ALL patients, the suppression of IL-15 is the most severe in difficult-to-treat subtypes with MYC overexpression. MYC overexpression promotes sensitivity of B-ALL to NK cell-mediated killing. To counter the suppressed IFN-I-induced IL-15 production in MYChigh human B-ALL, we CRISPRa-engineered a novel human NK-cell line that secretes IL-15. CRISPRa IL-15-secreting human NK cells kill high-grade human B-ALL in vitro and block leukemia progression in vivo more effectively than NK cells that do not produce IL-15.

Conclusion: We find that restoration of the intrinsically suppressed IFN-I production in B-ALL underlies the therapeutic efficacy of IL-15-producing NK cells and that such NK cells represent an attractive therapeutic solution for the problem of drugging MYC in high-grade B-ALL.

Keywords: cytokines; hematologic neoplasms; immune evation; immunologic surveillance; killer cells, natural.


Conflict of interest statement

Competing interests: The work described in this study is covered by pending US and PCT patent applications assigned to City of Hope and/or Stanford University with inventors SS, AK, ATK, CW-C, SJL, CD and HTM. MAC and JY are cofounders of CytoImmune Therapeutics.

Figures

Figure 1
Figure 1
Intrinsic suppression of IFN-I production and response in B-ALL predicts poor clinical outcome. (A)Comparison of relapse-free survival probabilities of COG P9906 B-ALL patients separated into two groups that is, IFNAR1HighIFNAR2HighSTAT1HighOAS1HighMX1High (‘High IFN-I Response’, n=15) and IFNAR1LowIFNAR2LowSTAT1LowOAS1LowMX1Low (‘Low IFN-I Response’ n=14) based on the median transcript expression of these genes. (B)Stacked bar charts comparing the proportions of COG P9906 B-ALL patients with WBC counts ≥100,000/μL or WBC counts <100,000/μL within the ‘High IFN-I Response’ and ‘Low IFN-I Response’ cohorts. (C)Comparison of IRF7 and CD123 transcript levels within the ‘High IFN-I Response’ and ‘Low IFN-I Response’ cohorts. (D–F)Comparison of IFNα2b+ cells in class C CpG ODN-stimulated total BMMCs (D), total PBMCs (E), and within the HLA-DR+ non-B, non-monocytes, non-T, and non-NK immune cell fraction of PBMCs (F)between B-ALL patients (n=7 BMMC, n=10 PMBC) and healthy donors (n=7 BMMC, n=10 PMBC) by flow cytometry. (G)Comparison of peripheral blood pDC frequencies within the HLA-DR+ non-B, non-monocytes, non-T, and non-NK immune cell fractions between B-ALL patients (n=10) and healthy donors (n=10) by flow cytometry. (H)Median fluorescence intensity (MFI) of CXCR4 expression on peripheral blood pDCs of B-ALL patients (n=7) and healthy donors (n=10) by flow cytometry. (I)MFI of HLA-DR expression on peripheral blood cDC of B-ALL patients (n=10) and healthy donors (n=10). (J)Analysis of frequencies of CD4+ and CD8+ T cells within non-leukemic pan T-cell fraction of B-ALL patients (n=6) and healthy donors (n=10) using mass cytometry. For all flow cytometry experiments, one representative histogram or dot plot from each group is shown. Survival was calculated by Kaplan-Meier method and p value calculated by log-rank test. All other comparisons between any two groups were conducted using Mann-Whitney U test. Exact p values are provided whenever significant. B-ALL, B-cell acute lymphoblastic leukemia; BMMC, bone marrow mononuclear cell; cDC, conventional dendritic cell; PBMC, peripheral blood mononuclear cell; pDC, plasmacytoid DC; WBC, white blood cell.
Figure 2
Figure 2
Intrinsic suppression of IFN-I production is sufficient to drive overt B-cell leukemogenesis. (A)Comparison of leukemia‐free survival between IFNAR1+/+ B-ALL-bearing (n=33) and IFNAR1−/− B-ALL-bearing (n=15) Eμ-Myc mice. (B)Quantitation of IFNαR1 and IFNαR2 transcript expression by qPCR in MACS sorted splenic B- and non-B cell fraction of wildtype (normal, B cell fraction, n=12; non-B cell fraction, n=11), IFNAR1+/+ Eμ-Myc B-ALL-bearing (B cell fraction, n=11; non-B cell fraction, n=10) and IFNAR1−/− Eμ-Myc B-ALL-bearing (B cell fraction, n=6; non-B cell fraction, n=5) mice. (C)Comparison of splenic pDC numbers and representative flow cytometry plots of normal (n=14), IFNAR1+/+ Eμ-Myc B-ALL-bearing (n=12) and IFNAR1−/− Eμ-Myc B-ALL-bearing (n=10) mice. (D–F)Quantitation of transcripts of IFNβ1, IFNα1 and IFNα2 in splenic B cells (D), and STAT1 and MX1 in splenic B- and non-B cell fractions (E, F)by qPCR. (G)Fold change in induction of STAT1 and MX1 transcripts after IFNβ stimulation in splenic WBCs of normal (n=9) and IFNAR1+/+ Eμ-Myc B-ALL-bearing (n=10) mice. (H)Histogram overlays and scatter plot showing the MFI and fold increase in MFI after IFNβ stimulation in splenic WBC from normal (n=5) and IFNAR1+/+ Eμ-Myc B-ALL-bearing mice (n=5). Ubiquitin (UB) was used as housekeeping gene in qPCR. For all flow cytometry experiments, one representative dot plot from each group is shown. Survival was calculated by Kaplan-Meier method and p value calculated by log-rank test. All other comparisons between any two groups were conducted using Mann-Whitney U test. Exact p values are provided whenever significant (<0.05) or trending to significance (0.05<p<0.1). B-ALL, B-cell acute lymphoblastic leukemia; MFI, median fluorescence intensity; pDC, plasmacytoid dendritic cell; WBCs, white blood cells.
Figure 3
Figure 3
Reduced IFN-I production in B-ALL is sufficient to suppress IL-15 and systemically impair NK surveillance. (A, B)Comparison of NK cell counts and representative plots of NK frequencies within the non-B, non-T and Gr1 negative cell fractions of the spleen (A)and bone marrow (B)of normal (spleen, n=14; bone marrow, n=12), IFNAR1+/+ Eμ-Myc B-ALL-bearing (spleen, n=12; bone marrow, n=8) and IFNAR1−/− Eμ-Myc B-ALL-bearing (spleen, n=10; bone marrow, n=8) mice. (C, D)Comparison of frequencies of NK subsets within the four-stage NK-cell effector maturation pathway in spleen (C)and bone marrow (D)of normal (spleen, n=14; bone marrow, n=12), IFNAR1+/+ Eμ-Myc B-ALL-bearing (spleen, n=12; bone marrow, n=8) and IFNAR1−/− Eμ-Myc B-ALL-bearing (spleen, n=10; bone marrow, n=8) mice. (E)Comparison of leukemia‐free survival between Eμ-Myc B-ALL-bearing mice treated with vehicle control or with syngeneic NK cells (n=6, each group). (F–H)Quantitation of IL-15 transcript expression by qPCR in MACS sorted splenic non-B cell fraction (F)and total bone marrow (G)of wildtype (normal, spleen, n=11; bone marrow, n=7), IFNAR1+/+ Eμ-Myc B-ALL-bearing (spleen, n=10; bone marrow, n=7) and IFNAR1−/− Eμ-Myc B-ALL-bearing (spleen, n=5; bone marrow, n=6) mice. (H)Fold change in induction of IL-15 transcript in IFNβ-stimulated splenic WBCs of normal (n=9) and IFNAR1+/+ Eμ-Myc B-ALL-bearing (n=10) mice. Ubiquitin (UB) was used as housekeeping gene in qPCR. For all flow cytometry experiments, one representative dot plot from each group is shown. All other pairwise comparisons between any two groups were conducted using Mann-Whitney U test. Exact p values are provided whenever significant (<0.05) or trending to significance (0.05<p<0.1). B-ALL, B-cell acute lymphoblastic leukemia; NK, natural killer; WBCs, white blood cells.
Figure 4
Figure 4
Expression of IL-15 inversely correlates with MYC expression in human B-cell malignancies. (A)Comparison of peripheral blood cDC frequencies within the HLA-DR+ non-B, non-T, and non-NK immune cell fraction of B-ALL patients (n=10) and healthy donors (n=10) by flow cytometry. (B)Linear regression analyzing the correlation between MYC and IL-15 transcript expression and plots of MYC and IL-15 mRNA expression in B-ALL patients with three major subtypes of leukemia from three independent data sets: EGAS00001003266 (ETV6::RUNX1 (n=187); ETV6::RUNX1-like (n=42); Ph/Ph-like (n=482), MYC-BCL2-driven /KMT2A-rearranged /Hypodiploid (n=237); 672 children and 240 adults, 36 unknown), the COG P9906 GSE11877 (ETV6::RUNX1 (n=3); others including Ph-like (n=155); KMT2A-rearranged (n=21); all pediatric) and in MILE GSE13159 (MYC driven+MLL (n=83); ETV6::RUNX1 (n=94); Ph+ (n=122)) data sets. (C)Comparison of transcript levels of MYC and IL-15 in classical MYC-driven Burkitt’s lymphoma/leukemia and non-MYC-driven B-cell lymphoma types from GSE132929: (Burkitt’s lymphoma (n=59) and non-Burkitt’s lymphoma (n=231). Non-MYC-driven (non-Burkitt’s) lymphomas include diffuse large B-cell lymphoma (n=95), follicular lymphoma (n=65), unspecified high-grade B-cell lymphoma (n=4), mantle cell lymphoma (n=43), double hit lymphoma (n=1), and marginal zone lymphoma (n=23)). B-ALL, B-cell acute lymphoblastic leukemia; cDC, conventional dendritic cell; NK, natural killer.
Figure 5
Figure 5
CRISPRa-engineered IL-15 secreting NK cells eradicate MYC-overexpressing B-ALLs in vitro. (A)Fold change in IL-15 transcript levels by qPCR in dCas9-VP64-GFP+ NK-92 cells transduced with control sgRNA-RFP (Control NK) or IL-15 sgRNA-RFP (IL-15 NK) and levels of secreted IL-15 by ELISA in culture supernatant of control NK and IL-15 NK cells stimulated with PMA and Ionomycin for 24 hours. (B)Cell counts of control and IL-15 NK cells cultured in the presence and absence of rhIL-2 (100 U/mL) for 96 hours. (C, D)Specific cytotoxicity of control and IL-15 NK cells by flow cytometry using (C)K562, (D)SEM (KMT2A-rearranged), KOPN8 (KMT2A-rearranged), MHH-CALL4 (hypodiploid, CRLF2-rearranged), P493-6, and VAL as target cell lines. Effector: target=10:1. (E)Specific cytotoxicity of control and IL-15 NK cells by flow cytometry against MYC-overexpressing (MYCON) and MYC-inactivated (MYCOFF) P493-6 cells. MYC was inactivated by treatment of P493-6 cells with 0.2 µg/mL of doxycycline for 24 hours. p=0.0108, control (MYCON) vs IL-15 NK (MYCON); p=0.0037, control (MYCOFF) vs IL-15 NK (MYCOFF). All experiments were conducted in three technical and three biological replicates. One representative of three biological replicates of each experiment is shown. Comparisons between any two groups were conducted using Student’s t-test (A–E).Exact p values are provided whenever significant (<0.05) or trending to significance (0.05<p<0.1). B-ALL, B-cell acute lymphoblastic leukemia; NK, natural killer; ns, not significant.
Figure 6
Figure 6
CRISPRa-engineered IL-15-secreting NK cells slow down progression of MYC-overexpressing B-ALL in vivo. (A)Experimental design for comparing the in vivo therapeutic efficacies of CRISPRa-engineered IL-15 producing and control NK cells in a luciferase-labeled human cell line-derived xenograft (CDX) of MYC-driven B-cell malignancy (P493-6). Schematic was created using BioRender.com. (B)Bioluminescence imaging of leukemia progression in NOD-SCID IL2Rγ −/− (NSG) CDX recipients before (day 9 post-CDX transplantation) and after treatment with control and IL-15 NK cells (days 12 and 15 post-CDX transplantation) (n=6 mice each in control NK and IL-15 NK arms). (C)Quantification of fold change in full body bioluminescence (photons/sec/cm2/sr) on days 12 and 15 post B-lymphoblast transplantation in control-NK (n=6) and IL-15-NK- treated (n=6) CDX recipients. P values were calculated by Mann-Whitney U test. Exact significant p values (<0.05) are provided. B-ALL, B-cell acute lymphoblastic leukemia; NK, natural killer.

References

    1. Terwilliger T, Abdul-Hay M. Acute lymphoblastic leukemia: a comprehensive review and 2017 update. Blood Cancer J 2017;7:e577. 10.1038/bcj.2017.53 - DOI - PMC - PubMed
    1. Aggarwal S. Targeted cancer therapies. Nat Rev Drug Discov 2010;9:427–8. 10.1038/nrd3186 - DOI - PubMed
    1. Kruger S, Ilmer M, Kobold S, et al. . Advances in cancer immunotherapy 2019 – latest trends. J Exp Clin Cancer Res 2019;38:1–11. 10.1186/s13046-019-1266-0 - DOI - PMC - PubMed
    1. Gu Z, Churchman ML, Roberts KG, et al. . PAX5-driven subtypes of B-progenitor acute lymphoblastic leukemia. Nat Genet 2019;51:296–307. 10.1038/s41588-018-0315-5 - DOI - PMC - PubMed
    1. Zitvogel L, Apetoh L, Ghiringhelli F, et al. . Immunological aspects of cancer chemotherapy. Nat Rev Immunol 2008;8:59–73. 10.1038/nri2216 - DOI - PubMed

Publication types

LinkOut - more resources