. 2023 May 22;6(8):e202201706.
doi: 10.26508/lsa.202201706. Print 2023 Aug.

Origin and segregation of the human germline

Affiliations

Origin and segregation of the human germline

Aracely Castillo-Venzor et al. Life Sci Alliance. .

Abstract

Human germline-soma segregation occurs during weeks 2-3 in gastrulating embryos. Although direct studies are hindered, here, we investigate the dynamics of human primordial germ cell (PGCs) specification using in vitro models with temporally resolved single-cell transcriptomics and in-depth characterisation using in vivo datasets from human and nonhuman primates, including a 3D marmoset reference atlas. We elucidate the molecular signature for the transient gain of competence for germ cell fate during peri-implantation epiblast development. Furthermore, we show that both the PGCs and amnion arise from transcriptionally similar TFAP2A-positive progenitors at the posterior end of the embryo. Notably, genetic loss of function experiments shows that TFAP2A is crucial for initiating the PGC fate without detectably affecting the amnion and is subsequently replaced by TFAP2C as an essential component of the genetic network for PGC fate. Accordingly, amniotic cells continue to emerge from the progenitors in the posterior epiblast, but importantly, this is also a source of nascent PGCs.


Conflict of interest statement

WWC Tang is currently employed by Adrestia Therapeutics Ltd. The other authors declare that they have no conflict of interest.

Figures
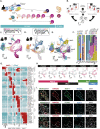
Figure 1.
Figure 1.. A highly resolved roadmap of PGC development and gastrulation.
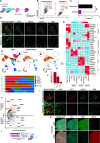
(A) Experimental design for highly resolved RNA sequencing (10X) of our established PGCLC model, alongside PGCLC-competent populations, and in vivo and in vitro reference cell types. PSC, pluripotent stem cells; PreME, pre-mesendoderm (transient PGCLC-competent cells); ME, mesendoderm; 4i, four-inhibitor, self-renewing PGCLC-competent cells; DE, definitive endoderm; PGC, week 7 human gonadal PGCs; EB, embryoid body. (B) A schematic for the integration of our data alongside other human in vitro models and primate gastrulation datasets used to generate a roadmap of PGC and early human development. (C) Integrated data representation of our samples as a UMAP projection highlighted by collection time and sample type. (D) Integrated representation of the aligned human CS7 gastrula data, highlighted by cell type plotted atop our data (in grey). (E) Louvain clustering of the integrated dataset identified 19 clusters and highlighted four key terminal lineages. (F) Quantification of the composition of transient and terminal lineages associated with individual samples. (G) Heatmaps of pseudo-bulk expression for key markers show that the embryoid body diversifies into mesoderm-like cells (MeLCs), definitive endoderm-like cells (DELCs), primordial germ cell-like cells (PGCLC), and amnion-like cells (AmLCs). (H) A minimal combination of key expression markers can be used to identify cell fates, with TFAP2C+/NANOS3+/SOX17+ representing PGCLCs; SOX17+/FOXA2+ endoderm fate, TFAP2A/HAND1+ mesoderm, and TFAP2A+/HAND1 amnion fates. (I) Immunofluorescence of d4 EBs confirms expression patterns at the protein level, and the identity of PGCLCs, MeLCs, AmLCs, and DELCs.
Figure S1.
Figure S1.. Integrative analysis and annotation of gastrulation and primordial germ cell datasets.
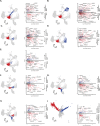
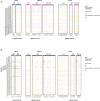
(A) Dataset after UMAP dimensionality reduction. Louvain clustering identified 16 populations. (B, C) Pseudo-bulk comparison of individual clusters with existing datasets shows a high degree of correlation with embryonic lineages and amnion but less so, with extraembryonic tissues and preimplantation samples. (D, E, F, G, H, I, J) The preliminary correlation suggests an integrative alignment with several gastrulation and germ cell datasets used to create a PGC and gastrulation roadmap, with (D, E, F, G, H, I, J) showing aligned samples from the individual datasets. (K) Estimation of doublet cells. Doublets, pink dots; singlets, blue dots. (L) UMAP showing the expression of MESP1 and FOXF1. Abbreviations: YS Mes, yolk sac mesoderm; EmDisc, embryonic disc; nAmLC, nascent amnion-like cell; VCT, villi cytotrophoblast.
Figure S2.
Figure S2.. Differential expression analysis of selected cell types.
(A, B, C, D, E) Volcano plots showing differential expression between PSLC and early (A) and late MeLC (B), early (C), and late AmLC (D), and DELC (E). (F, G, H, I) Volcano plots compare progenitors for early and late amnion or PGCLC populations (F, G, H, I).
Figure 2.
Figure 2.. PGCLC-competent populations form a continuum of states.
(A, B) Aligned UMAP representations of pluripotent and PGCLC-competent populations, alongside (B) human in vivo samples show that PSCs align best to pluripotent epiblast cells, whereas competent (PreME and 4i) align to both epiblast-like and primitive streak-like populations. (C, D) Clustering of competent and non-competent cells and quantification (D) identified six main populations that identify a PSC-associate cluster (PAC1) predominantly associated with the PSC samples, a mesendoderm-associated cluster primarily found within ME samples, and several overlapping putative competence-associated clusters (CAC1, 2, 3, and 4) found mainly in either 4i or PreME samples. (E, F, G) In 3D (E) and 2D (F) diffusion map representations, samples sit along a continuum of overlapping states with competent populations predominantly in the middle along DC3 (G). (H) Violin plots of putative competence genes related to WNT and BMP signalling reveal a heterogeneous signalling response.
Figure S3.
Figure S3.. Differential expression and ligand-receptor interaction in competent and non-competent populations.
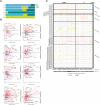
(A) A bar plot depicting the fraction of cells from individual conditions that fall into each subcluster revealing a PSC-associate cluster, four putative competence-associated clusters (CAC1, 2, 3, and 4) or a mesendoderm-associated cluster. (B) Comparison of expression in the competent-dominant groups (CAC1, 2, 3, and 4) with PSC-associate cluster or mesendoderm-associated cluster identifies several putative regulators of competence. (C) Dot plot of interaction enrichment between relevant ligands and cognate receptors in identified subclusters in PSCs and in 4i and PreME conditions.
Figure 3.
Figure 3.. Spatial mapping of embryoid bodies to gastrulating marmoset embryos reveals a posterior bias.
(A) Spatially resolved marmoset embryos at CS6 with the embryonic disc in yellow, amnion in green, PGCs in pink, and stalk in blue. Extraembryonic tissues are depicted in grey. (B) Expression analysis in the marmoset reference embryo at Carnegie Stage 6 shows that the anterior embryonic disc is SOX2 positive and posterior regions are TBXT positive. Specified PGCs show similar expression patterns to humans, with SOX17/NANOS3 expression, and amnion showing partial GABRP/VTCN1 expression. (C) After the alignment of datasets visualised here as a UMAP, mapping of human in vitro cells to the marmoset reference embryo was achieved using KNN-based methods in PC space, with PSCs mapping best to the anterior embryonic disc. (D) Competent populations show a distinct posterior bias, with PGCLCs showing strong localisation to the posterior-most marmoset PGC region and AmLCs mapping to the amnion.
Figure 4.
Figure 4.. Resolving the dynamics of bifurcations in embryoid bodies.
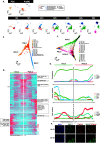
(A) Visualisation of our data separated by sample time with cells annotated by transfer of labels from the human CS7 gastrula (Tyser et al, 2021); PS, primitive streak; PGC, primordial germ cell. Label transfer suggests embryoid bodies (EBs) develop first through a primitive streak-like stage, with some residual or emergent epiblast-like cells, and early emergence of both mesoderm-like cells and primordial germ cell-like cells, followed by amnion-like cells. (B) Diffusion map representation of specific clusters reveals the bifurcation of mesoderm from the PS-like progenitors, with the remaining PS-like cells destined for other lineages. Because of the limited number of cells, samples from the CS7 human gastrula are depicted as larger data points to aid visualisation. (C) A diffusion map representation of AmLC and PGCLCs shows bifurcation from common progenitor populations, with a sustained association until 48 h. Superimposition of cells from the CS7 gastrula labelled as PS, amnion or PGCs shows an early alignment of human PGCs to PGCLCs. (D) A heatmap representing differentially expressed genes between AmLC and PGCLC ordered by pseudotime. (E) Line plot representations of essential genes ordered by pseudotime show early up-regulation of TFAP2A in both PGCLC and AmLCs, which is sustained in AmLC. (F) IF shows TFAP2A in early PGCLCs at 48 h (SOX17/TFAP2A double-positive) is lost by 96 h.
Figure S4.
Figure S4.. Expression of signalling pathways show early loss of NODAL with later BMP/WNT signalling arising from mesoderm and amnion.
Extracellular matrix molecules are also expressed in mesoderm.
Figure S5.
Figure S5.. Cross-dataset differential expression analysis identifies conserved markers of PGC-specification across diverse in vitro models.
(A, B, C, D) Cross-comparison of differentially expressed genes between PGCLCs and PSCs (A) reveals conserved markers across datasets and highlights the robust, conserved SOX17/PRDM1/TFAP2A-centric network in microfluidic amnioids (B), micropatterned gastruloids (C), and embryoid bodies (D).
Figure S6.
Figure S6.. Enrichment of ligand–receptor interactions for individual samples.
(A, B) Dot plot for showing interaction enrichment of relevant ligands in identified cell types (PlC, DELC, PSLC, eMeLC, aMeLC, nAmLC, eAmLC, lAmLC, ePGCLC, lPGCLC) with cognate receptors in PS, ePGCLC, and lPGCLC (A) and nAmLC, eAmLC, and lAmLC (B). Abbreviations: PlC, pluripotent-like cell; PSLC, primitive streak; ePGCLC, early PGCLC; lPGCLC, late PGCLC; nAmLC, nascent amnion-like cell; eAmLC, early amnion-like cell; lAmLC, late amnion-like cell; eMeLCs, early mesoderm-like cells; aMeLCs, advanced mesoderm-like cells.
Figure S7.
Figure S7.. Waddington OT and pretemporal ordering highlight signalling dynamics in mesoderm-like cells (MeLC) and definitive endoderm-like (DELC) cells.
(A, B) Waddington-OT was performed to infer lineages within the EBs. (C) Inferred WOT lineages are shown projected onto aligned UMAP representation. (D) The correlation of gene expression between WOT-inferred lineages and cluster-based lineages shows a high degree of correspondence. (E) Heatmap of gene expression in mesodermal lineages arranged by pseudotime. (F, G) Line plot representation of key genes arranged by pseudotime shows the progression of mesoderm markers over time, with early up-regulation of EOMES/T/MESP1, and later, of GATA6/PDGFRA. (H) Heatmap of endodermal lineages arranged by pseudotime. (I) Line plots of endoderm cells arranged by pseudotime show up-regulation of SOX17/FOXA2 with concurrent down-regulation of POU5F1.
Figure 5.
Figure 5.. TFAP2A is a regulator of PGCLC fate.
(A) Experimental design for testing the role of TFAP2A in PGC specification using TFAP2A knockout line. (B, C) FACS plots and quantification based on IF-labelled PDPN expression reveal a decrease in the % of PGCLCs induced in TFAP2A KO EBs compared with WT parental control. (D) Immunofluorescence shows co-expression for SOX17, TFAP2A, and TFAP2C in d4 EB. (E) Aligned UMAPs and bar plot quantification for the reference atlas versus H9 parental control and H9 TFAP2A KO further corroborate the drastic reduction in the numbers of PGCLCs in the knockout line. These results further suggest the emergence of a new SOX2+ population that occurs after 18 h and aligns with pluripotent stem cells in the reference atlas (D4 SOX2+). (F) Fraction of cells positive for SOX17 expression at the 18 h time point in reference atlas, parental control, and TFAP2A KO cells. (G) Row-normalised gene expression demonstrates consistent expression in AmLC and MeLC in the TFAP2A KO line. D4 SOX2+ cells show the expression of pluripotency genes. (H) Volcano plot for differentially expressed genes between the d4 SOX2+ cluster in TFAP2A KO versus PGCLCs in parental control. (I) Immunofluorescence of d4 parental EBs shows OCT4 NANOG double-positive cells (PGCLCs) but not in TFAP2A KO EBs; instead, there are OCT4, NANOG, and SOX2 triple-positive cells. (J) An inducible system to test the role of TFAP2A overexpression on SOX2 expression in PSCs. (K) Immunofluorescence for OCT4, SOX2, TFAP2A in PSCs after TFAP2A induction.
Figure S8.
Figure S8.. Knockout of SOX2 results in changes at the transcriptional and cell composition levels in embryoid bodies during PGCLC specification.
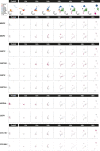
(A) Immunofluorescence shows PGCLC (SOX17/OCT4+), endoderm and (SOX17/FOXA2+) in TFAP2A KO d4 embryoid bodies. (B) Scatter plots of NANOS3 versus PDPN levels in the single-cell data show a lack of double-positive cells, indicating an absence of PGCLCs in the TFAP2A KO. (C) UMAP and the accompanying violin plot showing SOX2 expression for the atlas, parental control, and TFAP2A KO lines. (D) Pseudo-bulk cross-correlation heatmap of individual cell lineages between the reference dataset, parental line, and TFAP2A KO lines show consistent behaviour in specified MeLC and AmLC lineages across all three lines, with PGCLCs showing consistent behaviour between the reference line and parental line. (E) Immunofluorescence shows the presence of amnion (GATA3+) and mesoderm cells (HAND1+) in TFAP2A KO d4 embryoid bodies. (F) Volcano plot for differentially expressed genes between the d4 SOX2+ cluster in TFAP2A KO versus PSCs (in parental control). (G) A model of the transcription factor network necessary for human PGCLC specification.
Figure S9.
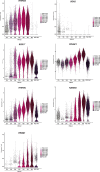
Figure S9.. Violin plots showing the expression of key PGCLC markers along the PGCLC trajectory.
Figure 6.
Figure 6.. A schematic for the origin of PGCs in humans.
PGCs are specified from a population of TFAP2A-positive progenitors at the posterior end of the embryonic disc. PGCs in the amnion specified at an earlier stage might contribute to the founder PGC pool if they can migrate against the flow of nascent amnion expansion.

Similar articles

Cited by

References

    1. Alberio R, Kobayashi T, Surani MA (2021) Conserved features of non-primate bilaminar disc embryos and the germline. Stem Cell Rep 16: 1078–1092. 10.1016/j.stemcr.2021.03.011 - DOI - PMC - PubMed
    1. Angerer P, Haghverdi L, Büttner M, Theis FJ, Marr C, Buettner F (2016) Destiny: Diffusion maps for large-scale single-cell data in R. Bioinformatics 32: 1241–1243. 10.1093/bioinformatics/btv715 - DOI - PubMed
    1. Bergmann S, Penfold CA, Slatery E, Siriwardena D, Drummer C, Clark S, Strawbridge SE, Kishimoto K, Vickers A, Tewary M, et al. (2022) Spatial profiling of early primate gastrulation in utero. Nature 609: 136–143. 10.1038/s41586-022-04953-1 - DOI - PMC - PubMed
    1. Bryja J, Konečný A (2003) Fast sex identification in wild mammals using PCR amplification of the Sry gene. Folia Zool Brno 52: 269–274.
    1. Bullen P, Wilson DI, Strachan T, Lindsay S, Wilson DI (1997) Molecular genetics of early human development The Carnegie Staging of Human Embryos: A Practical Guide. Bios: 265.

Publication types

LinkOut - more resources