. 2023 May 22;14(1):2929.
doi: 10.1038/s41467-023-38573-8.

Molecular basis of differential HLA class I-restricted T cell recognition of a highly networked HIV peptide

Affiliations

Molecular basis of differential HLA class I-restricted T cell recognition of a highly networked HIV peptide

Xiaolong Li et al. Nat Commun. .

Abstract

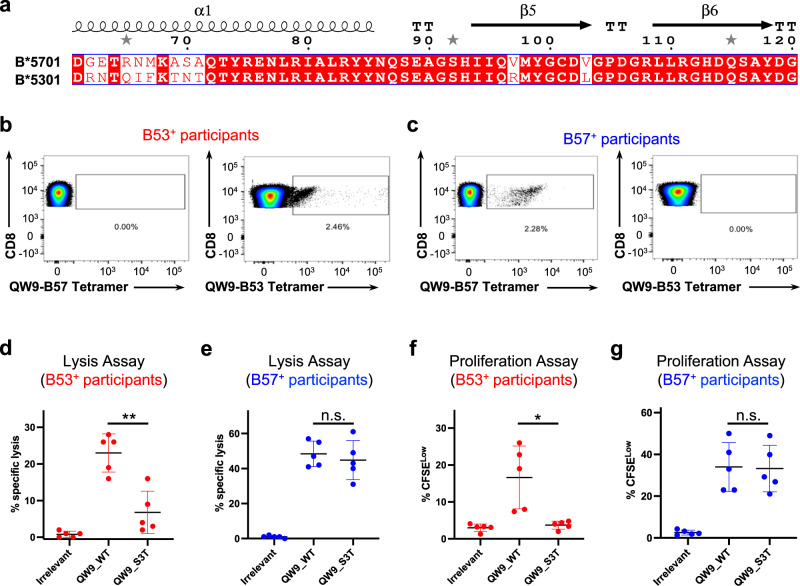
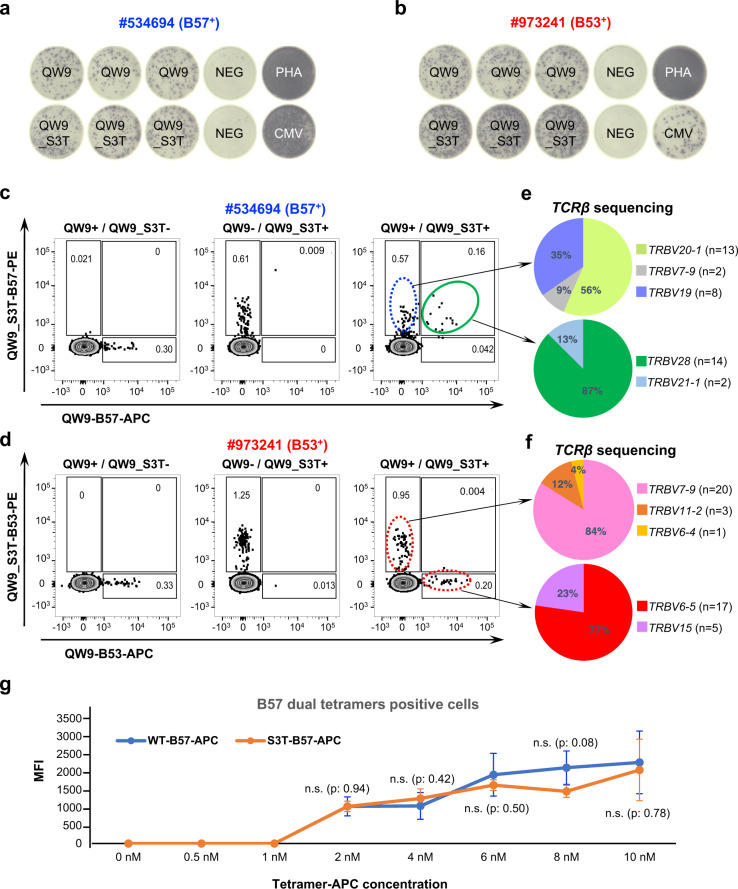
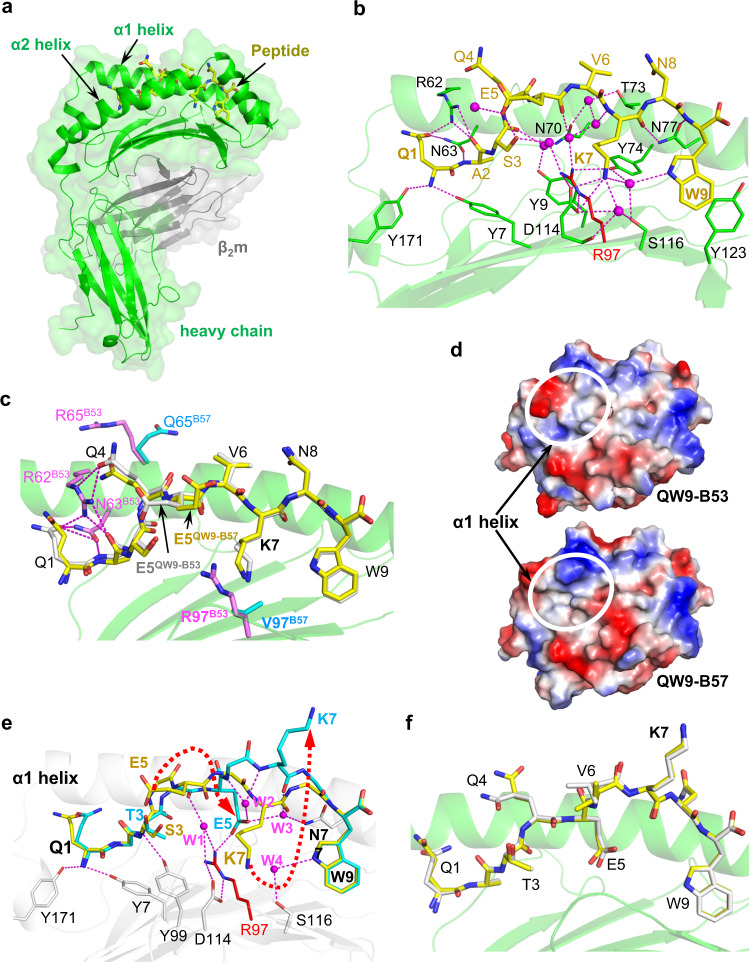
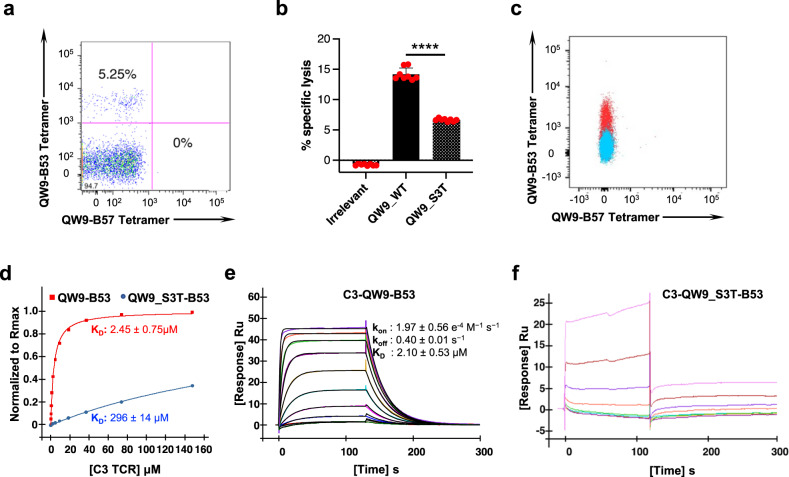
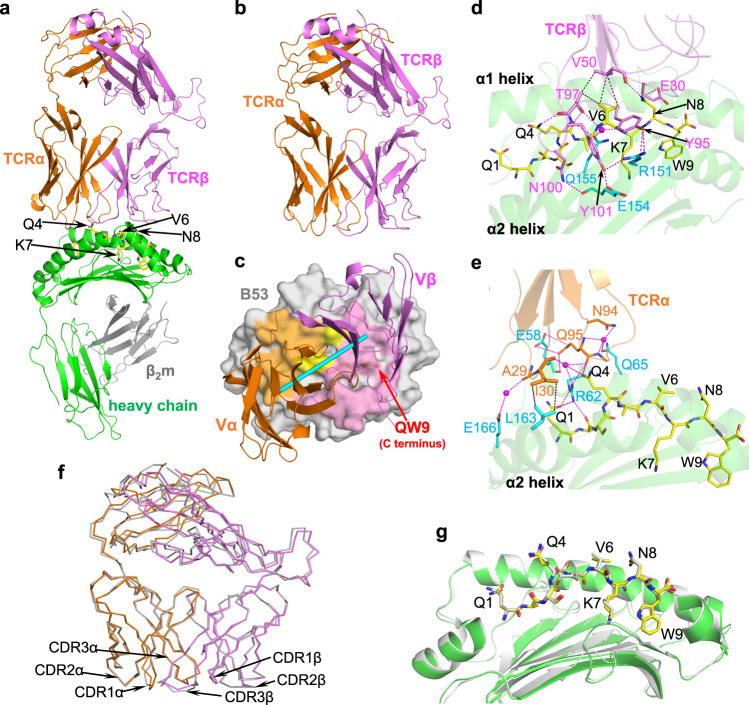
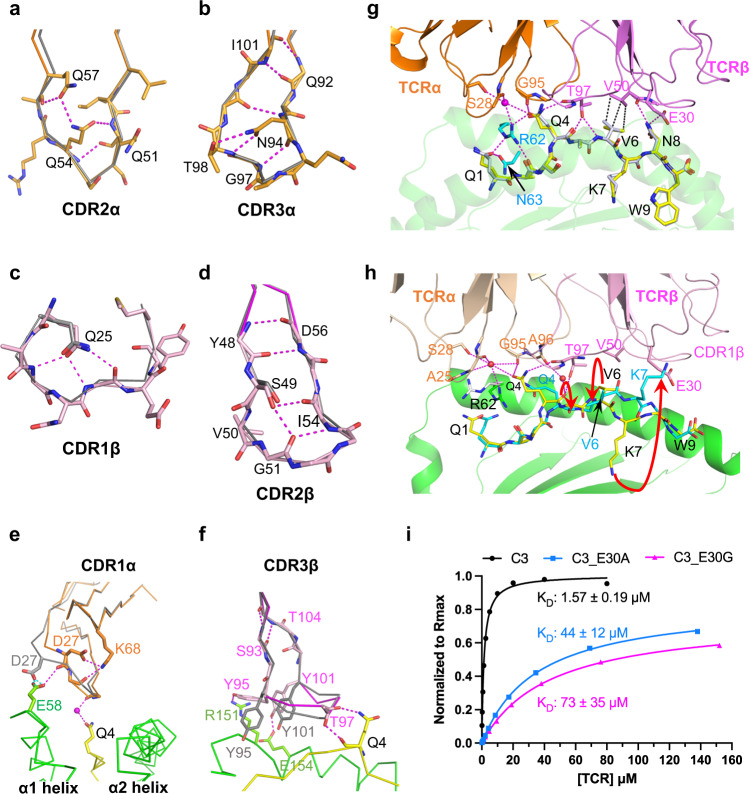
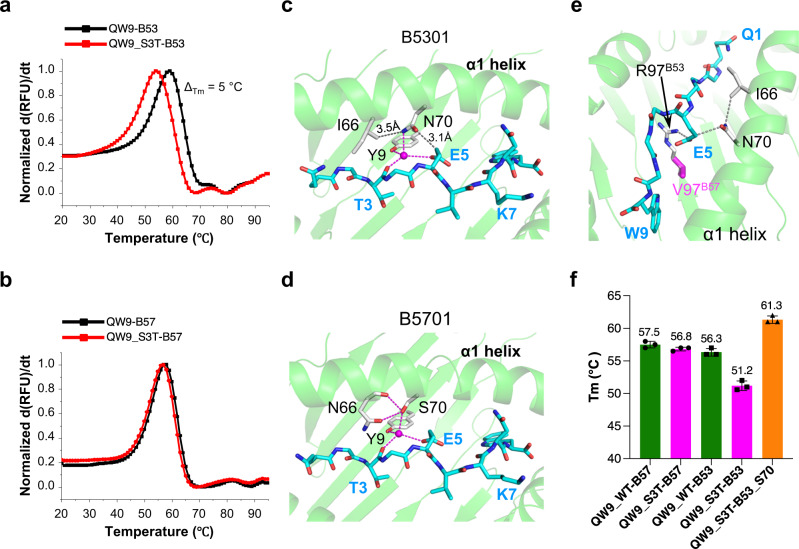
Cytotoxic-T-lymphocyte (CTL) mediated control of HIV-1 is enhanced by targeting highly networked epitopes in complex with human-leukocyte-antigen-class-I (HLA-I). However, the extent to which the presenting HLA allele contributes to this process is unknown. Here we examine the CTL response to QW9, a highly networked epitope presented by the disease-protective HLA-B57 and disease-neutral HLA-B53. Despite robust targeting of QW9 in persons expressing either allele, T cell receptor (TCR) cross-recognition of the naturally occurring variant QW9_S3T is consistently reduced when presented by HLA-B53 but not by HLA-B57. Crystal structures show substantial conformational changes from QW9-HLA to QW9_S3T-HLA by both alleles. The TCR-QW9-B53 ternary complex structure manifests how the QW9-B53 can elicit effective CTLs and suggests sterically hindered cross-recognition by QW9_S3T-B53. We observe populations of cross-reactive TCRs for B57, but not B53 and also find greater peptide-HLA stability for B57 in comparison to B53. These data demonstrate differential impacts of HLAs on TCR cross-recognition and antigen presentation of a naturally arising variant, with important implications for vaccine design.


Conflict of interest statement

The authors declare no competing interests.

Figures

Fig. 1
Fig. 1. Differential HLA-restricted immune recognition of a highly networked viral peptide.
a Sequence alignment for antigen binding domains of B53 and B57 (amino acid residues 60–120). The secondary structures are labeled at the top of the aligned sequences. b, c Flow cytometry plots of representative examples of QW9-HLA-tetramer-positive cells in HIV-infected persons expressing either B*5301 or B*5701. Each sample is dual stained with QW9-B53-APC and QW9-B57-PE tetramers. Systems were gated on CD3 + CD8+ live lymphocyte singlet cells. dg Each data point represents a single person (Red, B*5301 persons; Blue: B*5701 persons) and each experiment contains n = 5 biologically independent samples. d, e Summarized data assessing specific lysis of target cells by QW9-HLA-specific T cell lines in a standard 6 h chromium release assay at effector cell/target cell ratios of 1:1. Autologous EBV-transformed BCLs pulsed with the QW9 and QW9_S3T peptides were used as target cells (P-values: panel d, 0.0028; panel e, 0.5408). f, g Quantification of antigen-specific cell proliferation (CFSELow cells). Cells were simulated for 6 days with either irrelevant peptides, the QW9 peptide, or the QW9_S3T mutant, and CD8+ CFSE low cells counted (P-values: f, 0.0227; g, 0.8200). dg Two-tailed paired t test and 95% confidence interval were used for P-values calculation, n.s. p > 0.05, *p ≤ 0.05, **p ≤ 0.01, ***p ≤ 0.001. The red or blue Error bars represent SD, and the black bars at the center represent the mean values.
Fig. 2
Fig. 2. Differential cross-reactivity of QW9-specific CTLs in B53+ and B57+ individuals.
a, b B57+ and B53+ individuals having responses to both QW9 and QW9_S3T, examined by ELISpot assay. NEG: no peptide (negative control); PHA: Phytohaemagglutinin (positive control); CMV: cytomegalovirus peptides (positive control). c, d Tetramer-specific CTL quantitation by flow cytometry. Columns left to right show QW9 tetramer, QW9_S3T tetramer, and dual tetramer staining. Rows depict individual participants expressing B57 or B53, as indicated. Dual QW9+/QW9_S3T+ tetramer staining population from a B57+ individual is highlighted in the green circle. e, f TCRβ gene usage in each CTL subset analyzed from single-cell TCR sequencing. N represents the number of cells in each clonotype. g Median Fluorescence Intensity (MFI) of QW9_B57-APC (blue curve) and QW9_S3T-B57-APC (orange curve) tetramer staining of cross-reactive, dual tetramer-positive T cells across a range of tetramer concentrations. The error bars represent standard deviation, duplicate number: n = 3. The difference of MFI between the QW9_B57-APC and QW9_S3T-B57-APC-stained cells at each concentration was labeled. Two-tailed unpaired t test and 95% confidence interval were used for P-values calculation (n.s: p > 0.05).
Fig. 3
Fig. 3. Crystal structures of QW9 and QW9_S3T complexed with B53 and B57.
a Overview of the QW9-B53 structure. The green and gray ribbons represent B53 heavy and light chains, respectively, with a transparent surface as the background. The QW9 peptide is shown as a yellow stick. b The detailed interaction between B53 and QW9. For clarity, the α2 helix of B53 is removed. Water molecules: magenta spheres; hydrogen bonds: magenta broken lines. B53 is represented as a green ribbon and QW9 as a yellow stick. Specific residues from B53 are shown as green, except for residue 97 which is shown as a red stick. c Superimposition of QW9-B57 onto QW9-B53. (Silver stick: QW9B53; yellow stick: QW9B57; magenta sticks: B53 residues; cyan sticks: B57 residues; magenta broken lines: hydrogen bonds). d Top view representation of the electrostatic potential surface of QW9-B53 and QW9-B57. Significant differences between QW9-B53 and QW9-B57 are highlighted by white circles. e Overlay of QW9_S3TB53 (cyan stick) onto QW9B53 (yellow stick) in the context of the same B53 (white ribbon). Only key hydrogen bonds (magenta broken lines) and water molecules (magenta spheres) involved in the interaction between QW9_S3T and B53 are shown. f Superimposition of QW9_S3T-B57 onto QW9_S3T-B53 (silver stick: QW9_S3TB53; yellow stick: QW9_S3TB57).
Fig. 4
Fig. 4. QW9-specific, B53-restricted CTL isolation and functional examination.
a PBMCs from a B53+ individual (viral load <50 RNA copies/mL, CD4 count = 1003, antiretroviral therapy-naive) were stimulated with QW9 peptide for 6 days and stained with an QW9-B53 tetramer. Expanded cells were subjected to single-cell FACS sorting by using QW9-B53 tetramers. b QW9-B53 specific CD8+ T cell, Clone 3, were expanded and tested for lysis of autologous B cells loaded with irrelevant, QW9 and QW9_S3T at an effector cell/target cell ratio of 1:1. Each peptide was tested with 8 technical replicates. Two-tailed unpaired t test and 95% confidence interval were used for P-value calculation, ****p ≤ 0.0001. The Error bars represent SD. c The C3 TCR was cloned into a lentivirus and used to transduce a TCR null Jurkat cell line. C3 TCR expression was confirmed by flow cytometry as evidenced by binding to QW9-B53-APC tetramer staining (red cloud) in comparison to mock transduced cells (blue cloud). X-axis: QW9-B57-PE conjugate, Y-axis: QW9-B53-APC conjugate. d Representative steady state SPR measurements for C3 interacting with QW9-B53 and QW9_S3T-B53. C3 TCR flowed through a QW9-B53 and QW9_S3T-B53 coated chip (the red curve represents QW9-B53, and the blue curve represents QW9_S3T-B53; duplicate number, n = 2). e, f Representative kinetic state SPR measurements for C3 interacting with QW9-B53 (panel e) and QW9_S3T-B53 (panel f) at 25 °C. 10 serial dilutions of concentrated TCR were injected at 50 μl/min throughout the experiment, with a contact time of 120 s and a dissociation time of 300 s (duplicate number, n = 2). Each binding response was fit to a 1:1 binding model, and the kinetic parameters were calculated using the BiaEval software, with kon, koff and the Rmax fit globally.
Fig. 5
Fig. 5. Crystal structures of C3-QW9-B53 and C3.
a, b Crystal structures of the ternary C3-QW9-B53 complex and the apo C3 TCR. TCRα and TCRβ chains of C3 are represented in orange and purple, respectively. The B53 heavy chain (green), light chain (gray), and peptide (yellow stick) are the same as in Fig. 2a, The exposed residues of QW9 for C3 recognition and the buried K7 of QW9 are labeled with arrows. c C3 TCR-binding footprint on QW9-B53 surface (gray). The TCRα footprint is light orange; the TCRβ footprint is light magenta. The cyan pole (defined as a line linking the centers of mass of Vα and Vβ domains) shows the C3 docking angle relative to the antigenic peptide. The yellow region represents shared contact residues of QW9-B53 by both TCRα and TCRβ. d, e The detailed interactions between TCRβ (light magenta ribbon) and QW9-B53 (green ribbon) and between TCRα (light orange ribbon) and QW9-B53 (green ribbon) are shown. QW9 is shown as a yellow stick. Residues involved in the interaction are also shown as sticks (TCRα: orange; TCRβ: magenta; B53: cyan). The magenta broken lines represent the hydrogen bonds, while the black broken lines represent hydrophobic contacts. f Structural alignment of the apo C3 (gray for both chains) and the complexed C3C3-QW9-B53 (TCRα: orange; TCRβ: magenta). g Structural alignment of the apo QW9-B53 (gray stick-gray ribbon) and the complexed QW9-B53C3-QW9-B53 (yellow stick-green ribbon).
Fig. 6
Fig. 6. Conformational characteristics of C3-CDR loops.
ad Internal hydrogen bonds pre-configure conformation of CDR loops (CDR2α, CDR3α, CDR1β, and CDR2β) for ligand binding. Shown are superimposed loops of apo C3 (gray) and the complexed C3C3-QW9-B53 (CDRα: orange; CDRβ: magenta). The hydrogen bonds are drawn as broken lines. e, f Conformational changes of CDR1α and CDR3β upon QW9-B53 binding. CDR1α and CDR3β loops before binding are shown in gray, and after binding in orange and magenta, respectively. QW9 is shown as a yellow stick, and B53 is illustrated as the green skeleton. g Superimposition of the apo QW9-B53 and C3-QW9-B53 complex depicts the engagement between TCR and peptide. QW9 from the apo QW9-B53 and C3-QW9-B53 complex are shown as silver and yellow sticks, respectively. The magenta broken lines represent hydrogen bonds, while the black broken lines represent hydrophobic contacts. h Overlay of QW9_S3T-B53 onto the C3-QW9-B53 complex. Cyan and yellow sticks depict QW9_S3T and QW9C3-QW9-B53, respectively. Red arrows indicate the conformational changes from wild-type QW9 to the QW9_S3T mutant. i Representative steady state SPR measurements for C3 and C3 mutants interacting with QW9-B53. QW9-B53 was coated on the chip, and refolded TCRs served as the analyte flowed over the chip surface. (Black curve represents wild-type C3; Cyan curve represents C3_E30A; Megenta curve represents C3_E30G; duplicate number, n = 2).
Fig. 7
Fig. 7. Structure and thermal stability of B53 and B57 presenting QW9 and its mutant.
a, b Representative normalized first derivative analysis and associated fit for differential scanning fluorimetry data for B53 (a) and B57 (b) presenting either QW9 or QW9_S3T peptide. c, d, Pairwise analysis for QW9_S3T (cyan sticks) for B53 (c) versus B57 (d). Residues from B53 or B57 are represented as sliver sticks. Hydrogen bonds are drawn as magenta dashed lines. Contacts between hydrophilic and hydrophobic groups are drawn as gray dashed lines. e Sandwich packing model of E5QW9_S3T in QW9_S3T-B53. f Summary of melting temperature (Tm) for QW9 and QW9_S3T bound to wild-type and mutated B53s. The averaged Tm of each tested protein is labeled on the column (Error bars represent SD; duplicate number, n = 3).

References

    1. Collins DR, Gaiha GD, Walker BD. CD8(+) T cells in HIV control, cure and prevention. Nat. Rev. Immunol. 2020;20:471–482. doi: 10.1038/s41577-020-0274-9. - DOI - PMC - PubMed
    1. Harvey WT, et al. SARS-CoV-2 variants, spike mutations and immune escape. Nat. Rev. Microbiol. 2021;19:409–424. doi: 10.1038/s41579-021-00573-0. - DOI - PMC - PubMed
    1. Fellay J, et al. A whole-genome association study of major determinants for host control of HIV-1. Science. 2007;317:944–947. doi: 10.1126/science.1143767. - DOI - PMC - PubMed
    1. Pereyra F, et al. The major genetic determinants of HIV-1 control affect HLA class I peptide presentation. Science. 2010;330:1551–1557. doi: 10.1126/science.1195271. - DOI - PMC - PubMed
    1. Gaiha GD, et al. Structural topology defines protective CD8(+) T cell epitopes in the HIV proteome. Science. 2019;364:480–484. doi: 10.1126/science.aav5095. - DOI - PMC - PubMed

Publication types