. 2023 May 22;14(1):2917.
doi: 10.1038/s41467-023-38489-3.

Anion redox as a means to derive layered manganese oxychalcogenides with exotic intergrowth structures

Affiliations

Anion redox as a means to derive layered manganese oxychalcogenides with exotic intergrowth structures

Shunsuke Sasaki et al. Nat Commun. .

Abstract

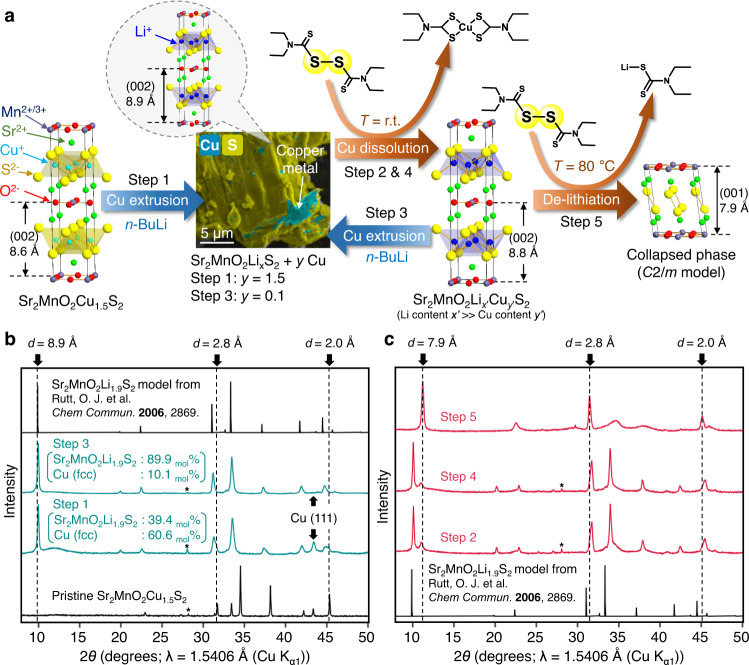
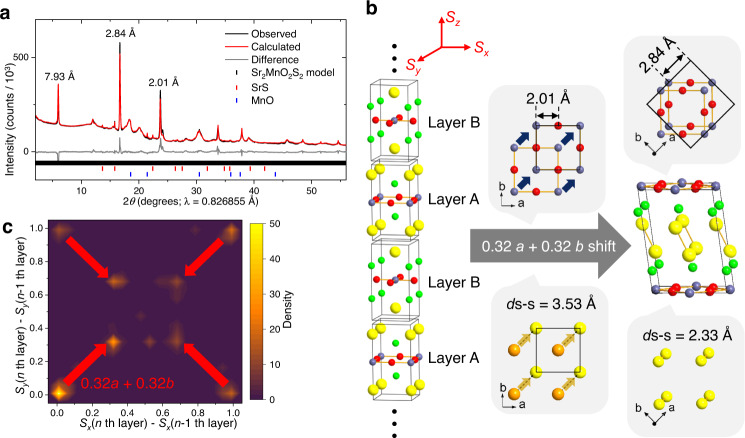
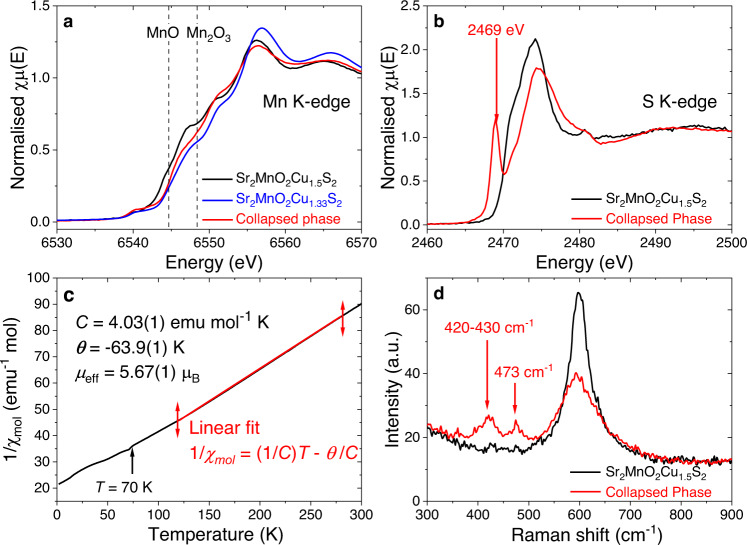
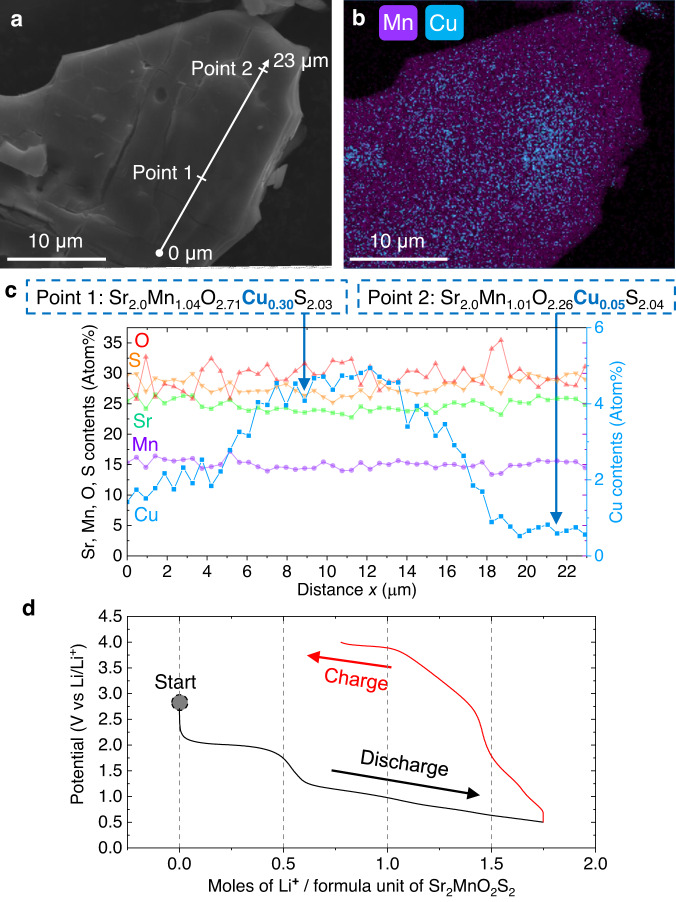
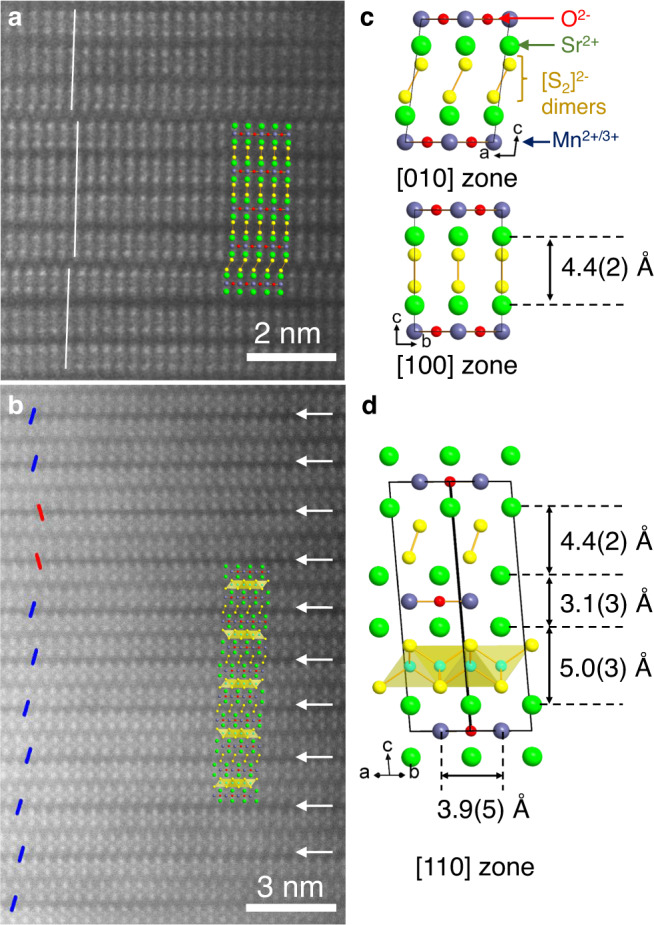
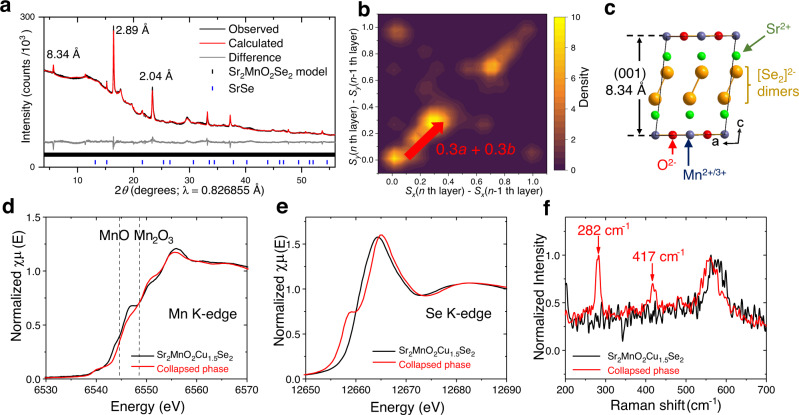
Topochemistry enables step-by-step conversions of solid-state materials often leading to metastable structures that retain initial structural motifs. Recent advances in this field revealed many examples where relatively bulky anionic constituents were actively involved in redox reactions during (de)intercalation processes. Such reactions are often accompanied by anion-anion bond formation, which heralds possibilities to design novel structure types disparate from known precursors, in a controlled manner. Here we present the multistep conversion of layered oxychalcogenides Sr2MnO2Cu1.5Ch2 (Ch = S, Se) into Cu-deintercalated phases where antifluorite type [Cu1.5Ch2]2.5- slabs collapsed into two-dimensional arrays of chalcogen dimers. The collapse of the chalcogenide layers on deintercalation led to various stacking types of Sr2MnO2Ch2 slabs, which formed polychalcogenide structures unattainable by conventional high-temperature syntheses. Anion-redox topochemistry is demonstrated to be of interest not only for electrochemical applications but also as a means to design complex layered architectures.


Conflict of interest statement

The authors declare that none of them have any competing financial, personal or professional relationships with individuals or institutions that could be perceived to directly undermine the objectivity, integrity, and value of the work in this article, or could be seen as having an influence on the judgments and actions of the authors with regard to objective data presentation, analysis, and interpretation.

Figures

Fig. 1
Fig. 1. Topochemistry leading to collapse of interlayer spacing between Sr2MnO2S2 slabs.
a Synthetic scheme displaying the main reaction at each step and required reagents. Elemental Cu content y in the mixture Sr2MnO2LixS2 + y Cu was quantified by Rietveld refinement. The SEM image of the Step1 product is overlaid with the EDX mapping of Cu (cyan) and S (yellow). b Laboratory powder XRD patterns of Sr2MnO2Cu1.5S2 and its products after first (Step 1) and second (Step 3) treatments with n-BuLi at 50 °C. The molar ratio between the oxysulfide and copper was estimated by Rietveld refinements using the Sr2MnO2Li1.9S2 model reported by Rutt et al., whose theoretical pattern is also displayed for comparison. c Laboratory powder XRD patterns after first (Step 2) and second (Step 4) treatments with disulfiram as well as after the final treatment at 80 °C (Step 5). Rietveld refinements were performed to account for the sharp peaks in Step 2 and 4 products, fixing the atomic parameters to the Sr2MnO2Li1.9S2 structure model. They gave a = b = 4.00 Å, c = 17.62 Å, which was slightly smaller than a = b = 4.03 Å, c = 17.83 Å refined for the Step 1 product Sr2MnO2Li1.9S2 + 1.5 Cu. * = Si 111 reflection.
Fig. 2
Fig. 2. Rietveld refinement and structure modelling of the collapsed phase.
a Rietveld fit to powder PXRD data (I11, Diamond) of the final product of Fig. 1a. Data (black), fit (red); Rwp = 5.74%, χ2 = 17.1. See Methods section for details. b The structural model used for the refinement. Its unit cell (a = b = 4.030 Å, c = 792.3 Å) was defined by one hundred Sr2MnO2S2 slabs stacked in a body-centred manner. Sliding of each layer in xyz directions (Sx, Sy, Sz) was parametrised and refined as fractional values of unit cell parameters. The shift (Sx, Sy) = (0.32, 0.32) suggested by the refinement redefined the original I4/mmm cell of the parent phase (middle) into the new C2/m cell (right, see Supplementary Table 1 for its structure parameters), c 2D kernel plot representing occurrence of (Sx, Sy) values refined for sliding of each Sr2MnO2S2 layer (See also Supplementary Fig. 8).
Fig. 3
Fig. 3. Experimental evidence of sulphur oxidation and disulphide bond formation.
a, b XANES spectra at the Mn K-edge (a) and S K-edge (b) measured for pristine Sr2MnO2Cu1.5S2 (black), Sr2MnO2Cu1.33S2 (blue, reproduced from the data published in ref. ), and the collapsed phase (red). Dotted lines represent the absorption edges of reference standards MnO and Mn2O3, which correspond to the lowest-energy maxima on the d(χμ(E))/dE plot (See ref. for their spectra). c Inverse molar susceptibility 1/χmol of the collapsed phase plotted against temperature (2 K ≤ T ≤ 300 K). Magnetisation (emu) was measured at the applied field H = 100 Oe after zero field cooling (ZFC) and converted into 1/χmol (emu-1 mol Oe) supposing the tentative formula Sr2MnO2S2 (molar mass = 326.31). The linear region (120 K ≤ T ≤ 280 K) of the obtained 1/χmolT plot was fitted by Curie–Weiss law 1/χmol = (T/C) (θ/C), where C and θ represented the Curie and Weiss constants, respectively. See Supplementary Fig. 17 for other magnetic data. d Raman spectra of Sr2MnO2Cu1.5S2 (black) and the collapsed phase (red). The measurement was performed under air with excitation wavelength λex = 532 nm. See Supplementary Fig. 19 for the spectra measured at λex = 785 nm.
Fig. 4
Fig. 4. Characterisation of residual Cu and Li in the collapsed phase.
a Secondary electron (SE) image of Sample 2 (bulk composition estimated by ICP-MS: Sr2.00(2)Mn1.07(2)O2Cu0.24(0)Li0.23(1)S2) and b its EDX mapping overlaying signals from Mn Kα1 and Cu Kα1 lines. EDX mappings of other elements are found in Supplementary Fig. 21. c Sr, Mn, O, Cu and S contents plotted over the 23 μm line section shown in Fig. 4a. To obtain better precision than these line-scan data, single-point EDX spectra were acquired separately at the positions corresponding to x = 8.9 (Point 1) and 21.5 μm (Point 2) of the line section. d Voltage vs specific capacity plot for a half cell constructed with Sample 1 (bulk composition estimated by ICP-MS: Sr2.00(2)Mn1.07(2)O2Cu0.35(0)Li0.13(0)S2) as the positive electrode and Li metal as the anode, cycled at a C/10 rate.
Fig. 5
Fig. 5. High-angle annular dark-field (HAADF) scanning transmission electron microscopy (STEM) images of Sample 1 (Sr2MnO2Cu0.35Li0.13S2).
a Close-up view displaying intergrowth of [100] and [010] zones of the collapsed phase (See Supplementary Fig. 23 for the whole image). The structure of the C2/m model (Fig. 2b) was overlaid for comparison. b Close-up view of the domain where the collapsed-type layers intergrow with the parent-type layers. White arrows highlight darker and thinner strips that represent the metal-free layers of disulphide ions. Between the collapsed-type layers, Sr2MnO2 slabs shift either left or right (highlighted by red or blue lines, respectively). The overlaid image depicts the tentative structure model of the intergrowth domain, where structural parameters within the respective intergrowing slabs are fixed to those of the C2/m model and Sr2MnO2Cu1.5S2. See Supplementary Fig. 24 for details. c, d Structural parameters obtained from the convoluted intensity profile (Supplementary Fig. 25) of Fig. 5a, b. The distances between planes of Sr2+ ions are shown.
Fig. 6
Fig. 6. 7Li NMR spectra before and after lithiation.
a 7Li NMR spectrum recorded for the collapsed oxysulfide phase (Sample 1) and b after its electrochemical lithiation (i.e. after discharge down to 0.5 V (vs. Li/Li+) corresponding to the intercalation of 1.75 equivalents of Li; see Fig. 4d) and c after chemical lithiation (i.e. after addition of 1.5 equivalents of n-BuLi; see Supplementary Fig. 22). Each spectrum was deconvolved (black line: observed, red line: fit) into Gaussian or Lorentzian peaks and their hyperfine shifts were interpreted in terms of the Li local structure as well as the Mn2+/Mn3+ ratio. Sidebands of the peak at 0 ppm (due to diamagnetic impurities) are labelled with a asterisk (*). See Supplementary Fig. 26 for the whole spectra. d Three possible local environments around Li. Black thick lines highlight connectivity between Li and four nearby Mn2+/3+ cations. Mn2+/3+ cations are either sandwiched symmetrically by S2− anions at apexes of tetrahedra, or asymmetrically by S2− apexes and S2 dimers. In the latter case, charge transfer from S2 dimers to Mn leads to stronger Mn-S-7Li interactions.
Fig. 7
Fig. 7. Collapsed manganese oxyselenide and oxidation of its selenide anions.
a Rietveld fit to powder synchrotron PXRD data (I11, Diamond) of the collapsed oxyselenide derived from Sr2MnO2Cu1.5Se2. Rwp = 1.40%, χ2 = 4.7. The same method described in Fig. 2b was used for the refinement. b 2D kernel plot representing the occurrence of (Sx, Sy) values refined for sliding of each Sr2MnO2Se2 layer. See Supplementary Fig. 29 for details. c The collapsed Sr2MnO2Se2 model derived by the most frequent shift (Sx, Sy) = (0.3, 0.3). d, e XANES spectra at Mn K-edge (d) and Se K-edge (e) were measured for the pristine Sr2MnO2Cu1.5Se2 (black) and its collapsed phase (red). Dotted lines represent the absorption edges of reference standards MnO and Mn2O3. f Raman spectra of Sr2MnO2Cu1.5Se2 (black) and its collapsed phase (red). The measurement was performed under air with excitation wavelength λex = 532 nm.

References

    1. Jansen M. A concept for synthesis planning in solid-state chemistry. Angew. Chem. Int. Ed. 2002;41:3746–3766. doi: 10.1002/1521-3773(20021018)41:20<3746::AID-ANIE3746>3.0.CO;2-2. - DOI - PubMed
    1. Goodenough JB, Park K-S. The Li-ion rechargeable battery: a perspective. J. Am. Chem. Soc. 2013;135:1167–1176. doi: 10.1021/ja3091438. - DOI - PubMed
    1. Li D, et al. Superconductivity in an infinite-layer nickelate. Nature. 2019;572:624–627. doi: 10.1038/s41586-019-1496-5. - DOI - PubMed
    1. Kreiner M, Segawa K, Ren Z, Sasaki S, Ando Y. Bulk superconducting phase with a full energy gap in the doped topological insulator CuxBi2Se3. Phys. Rev. Lett. 2011;106:127004. doi: 10.1103/PhysRevLett.106.127004. - DOI - PubMed
    1. Rouxel J. Anion–cation redox competition and the formation of new compounds in highly covalent systems. Chem. Eur. J. 1996;2:1053–1059. doi: 10.1002/chem.19960020904. - DOI