. 2023 May 22;14(1):2825.
doi: 10.1038/s41467-023-38462-0.

Nonthermal acceleration of protein hydration by sub-terahertz irradiation

Affiliations

Nonthermal acceleration of protein hydration by sub-terahertz irradiation

Jun-Ichi Sugiyama et al. Nat Commun. .

Abstract

The collective intermolecular dynamics of protein and water molecules, which overlap in the sub-terahertz (THz) frequency region, are relevant for expressing protein functions but remain largely unknown. This study used dielectric relaxation (DR) measurements to investigate how externally applied sub-THz electromagnetic fields perturb the rapid collective dynamics and influence the considerably slower chemical processes in protein-water systems. We analyzed an aqueous lysozyme solution, whose hydration is not thermally equilibrated. By detecting time-lapse differences in microwave DR, we demonstrated that sub-THz irradiation gradually decreases the dielectric permittivity of the lysozyme solution by reducing the orientational polarization of water molecules. Comprehensive analysis combining THz and nuclear magnetic resonance spectroscopies suggested that the gradual decrease in the dielectric permittivity is not induced by heating but is due to a slow shift toward the hydrophobic hydration structure in lysozyme. Our findings can be used to investigate hydration-mediated protein functions based on sub-THz irradiation.


Conflict of interest statement

The authors declare no competing interests.

Figures
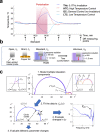
Fig. 1
Fig. 1. Dielectric spectroscopic measurements and analysis.
a Time courses of the measurements of lysozyme solutions subjected to different perturbations. Temperatures measured in real time are represented on the vertical axis. The period of each perturbation caused by 0.1 THz irradiation (THz) or conduction heating/cooling (HTC/LTC) is indicated by red shading. b Method of time-lapse measurement. Initially, the complex dielectric permittivity of the Unknown sample was determined via Open, Short, and Standard calibration of the probe surface according to Eq. (7). c Relaxation analysis for the polydisperse liquid. The as-obtained spectra of the real and imaginary parts of complex permittivity were analyzed based on the Nyquist plot. In the multiple relaxation components consisting of lysozyme solution (top: β, δ1, δ2, γ1 and γ2), we analyzed the single Debye relaxation function of εγ1*ω to calculate the dielectric parameters (εγ1s, εγ1, and f1) and the shifts (Δr, deformed display) from the Debye relaxation model (bottom). The peak of Δr is indicated by PΔr.
Fig. 2
Fig. 2. Changes in dielectric parameters during 0.1 THz irradiation.
a The 9.1 wt% lysozyme solution. b Pure water. The means ± standard deviations of five measurements are shown. HTC and GC values are indicated by dashed lines. The 0.1-THz-induced decrease in εγ1 is indicated by an arrow. εγ1 represents the high-frequency limit of slow water relaxation, εγ1s represents the static slow water relaxation, and fcγ1 represents the slow water relaxation frequency.
Fig. 3
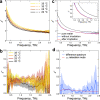
Fig. 3. Dielectric spectral analysis for the imaginary part of THz-TDS measurements.
a Solid lines represent spectra of water in the 28.6 wt% lysozyme solution at different temperatures. The spectra for dehydrated lysozyme were subtracted from the raw spectra and were normalized by the fraction of water (=0.714). Dashed lines represent the corresponding spectra of pure water. b Subtracting the spectra of pure water (dashed lines of panel a) from those of water contained in the lysozyme solution (solid lines of panel a) gives spectra for lysozyme-interacting water. c Spectra for the lysozyme solution after 0.1 THz irradiation, the control sample without irradiation, and pure water at 25 °C. An enlarged view is shown in the inset. d Difference spectrum of the irradiated sample subtracted from non-irradiated control. The red line represents γ2 (fast water) relaxation mode given by εγ2ω = Δεγ2ωτ/(1 + 2τ2), where τ = 0.265 ps, and Δεγ2 is arbitrary. All data are shown as means of four measurements. The measurement errors indicated by shading are given as follows. a σ/0.714 and σ for water in the lysozyme solution and pure water, respectively, where σ is the standard deviation of the four measurements. c σ. b, d σA2+σB2, where σA and σB are standard deviations for each original spectrum before subtracting.
Fig. 4
Fig. 4. Changes in peak of the Δr signal (PΔr).
a Increase in PΔr (indicated by arrows) was accelerated following 0.1 THz irradiation (THz). The mean values of five measurements and moving average curves are shown. HTC, high-temperature control; GC, general control; LTC, low-temperature control. b Temporal change of the peak height of PΔr after irradiation or heating. PΔr is given by subtracting the baseline, which is defined as the mean of Δr (deviation of measured values from the Debye model) at each 1-GHz region on both sides of the peak. Results for high (9.1 wt%) and low (2.9 wt%) concentrations of lysozyme solutions are shown.
Fig. 5
Fig. 5. Relation between peak of the Δr signal (PΔr) and complex permittivity (ε*).
a Difference complex dielectric spectra before (t = 18 min) and after the perturbation (t = 60 min). The data for 2.9 wt% lysozyme sample are shown as a representative. Low (L: 0.3–3 GHz) and high (H: 3–6.5 GHz) frequency regions and peak heights (Pε and Pε: ~ 7 and ~8 GHz for the real and imaginary parts, respectively) are indicated by arrows. The real and imaginary peak heights were obtained by subtracting the means of ε and ε″ in 4–5 GHz as the background, respectively. Data are shown with a moving average curve of the mean of five measurements ± errors given by σA2+σB2 (For detail, see the legend of Fig. 3d). If there is no change in the spectra at the two time points, the spectra is on the dashed line. b Correlations of the frequency-averaged value of P (P¯) with those of L (L¯, for real part, left) or LH (L¯H¯, for imaginary part, right). The four plots for 0.1 THz irradiation (THz), heating (HTC), and control (GC) are derived from DR measurements performed with 2.9 wt% and 9.1 wt% lysozyme solutions, producing difference spectra of εt=60min*εt=18min* and εt=50min*εt=18min* at each concentration. The linear fitting of the data (dashed line) with a correlation coefficient R is shown.
Fig. 6
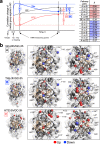
Fig. 6. NMR spectral analysis of lysozyme.
a Lysozyme proceeds to different pathways of conformational change after experiencing 0.1 THz irradiation (THz, blue) or temperature rise up to 31 °C (HTC, red). These pathways are shown schematically with respect to the GC pathway (gray). In the case of positive (or negative) correlation, the arrows are oriented in the same (or opposite) direction. The time-integrated 1H-13C heteronuclear single quantum coherence spectra of lysozyme samples were obtained at 25 °C at 3–4 h (open circle) and 24–25 h (filled circle) after dissolution in water, from which methyl-group-derived signals were used for the analysis. A correlation coefficient R for any pair of two pathways is shown. b Structural Mapping. The tertiary lysozyme structure (left) as well as that focused on the hydrophobic cavity with 60° rotation (right) are shown (PDB accession code: 3EXD). The peptide backbone is also shown as a ribbon in a semi-transparent surface representation. The residue consisting of the hydrophobic cavity is colored ochre. For the methyl group to be analyzed, the carbon atom is indicated by a sphere and amino acid residue is indicated by a stick. The residues were mapped in the lysozyme structure when (IGC24h/IGC3h)1>SD (red) or 1(IGC24h/IGC3h)>SD (blue), in the case of pathway A (top), where I is the signal intensity (peak height) normalized to correct for the effect of differences in lysozyme concentration among samples and SD is the standard deviation of the ratio of analyzed methyl signals. The same applies to pathways B (middle) and C (bottom).
Fig. 7
Fig. 7. Predicted sub-THz irradiation effect on hydration to heterogeneous protein surface.
Schematic illustration of hydration state 2 h after the lysozyme encounters liquid water (a), and that 24 h after the encounter or after sub-THz irradiation (b). Water molecules dominated by strong ion–dipole and ion–ion interactions (blue shading) generate H-bond-broken water molecules in the outer hydration layer (red shading) and prevent water entry into the hydrophobic cavity, where water molecules originally might have existed in isolation. Because of the acidic pH (~3.4), the positive charge of lysozyme can attract hydroxyl ions, and the bulk water contains sub-mM hydronium ions. The sub-THz excitation of the H-bond-broken (fast) water dynamics accelerates the reaction from state A to B to form hydrophobic hydration (ochre shading), leading to the increase in the number of H-bonds throughout the hydration layer.

References

    1. Schirò G, Weik M. Role of hydration water in the onset of protein structural dynamics. J. Phys. Condens. Matter. 2019;31:463002. doi: 10.1088/1361-648X/ab388a. - DOI - PubMed
    1. Laage D, Elsaesser T, Hynes JT. Water dynamics in the hydration shells of biomolecules. Chem. Rev. 2017;117:10694–10725. doi: 10.1021/acs.chemrev.6b00765. - DOI - PMC - PubMed
    1. Rupley JA, Careri G. Protein hydration and function. Adv. Protein Chem. 1991;41:37–172. doi: 10.1016/S0065-3233(08)60197-7. - DOI - PubMed
    1. Bellissent-Funel MC, et al. Water determines the structure and dynamics of proteins. Chem. Rev. 2016;116:7673–7697. doi: 10.1021/acs.chemrev.5b00664. - DOI - PMC - PubMed
    1. Biedermannová L, Schneider B. Hydration of proteins and nucleic acids: advances in experiment and theory. A review. Biochim. Biophys. Acta. 2016;1860:1821–1835. doi: 10.1016/j.bbagen.2016.05.036. - DOI - PubMed

Publication types