. 2023 May 22;14(1):2920.
doi: 10.1038/s41467-023-38720-1.

Structures of human SGLT in the occluded state reveal conformational changes during sugar transport

Affiliations

Structures of human SGLT in the occluded state reveal conformational changes during sugar transport

Wenhao Cui et al. Nat Commun. .

Abstract

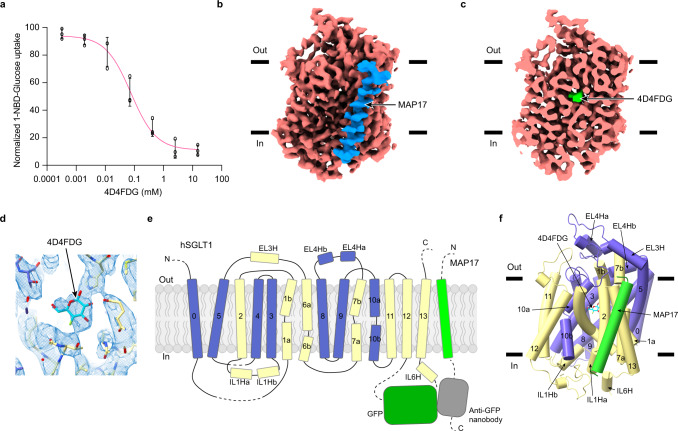
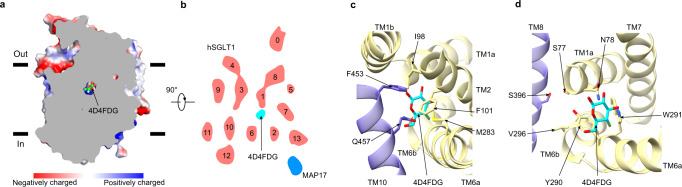
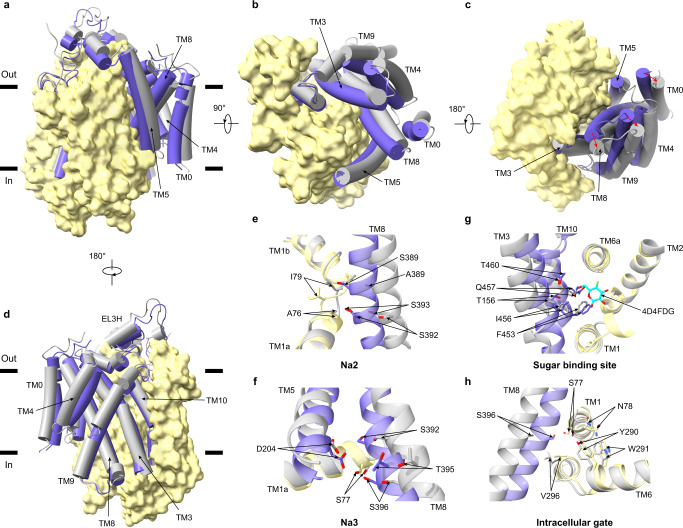
Sodium-Glucose Cotransporters (SGLT) mediate the uphill uptake of extracellular sugars and play fundamental roles in sugar metabolism. Although their structures in inward-open and outward-open conformations are emerging from structural studies, the trajectory of how SGLTs transit from the outward-facing to the inward-facing conformation remains unknown. Here, we present the cryo-EM structures of human SGLT1 and SGLT2 in the substrate-bound state. Both structures show an occluded conformation, with not only the extracellular gate but also the intracellular gate tightly sealed. The sugar substrate are caged inside a cavity surrounded by TM1, TM2, TM3, TM6, TM7, and TM10. Further structural analysis reveals the conformational changes associated with the binding and release of substrates. These structures fill a gap in our understanding of the structural mechanisms of SGLT transporters.


Conflict of interest statement

The authors declare no competing interests.

Figures

Fig. 1
Fig. 1. Cryo-EM structure of human SGLT1-MAP17 complex.
a The inhibition curve of the hSGLT1-MAP17 complex by 4D4FDG in the 1-NBD-glucose uptake assay (data are shown as means ± standard deviations; n = 3 biologically independent experiments). The 1-NBD-glucose uptake was normalized to the uptake of hSGLT1GFP-MAP17nb. Source data are provided as a Source Data file. b Cryo-EM density map of the hSGLT1GFP-MAP17nb complex. hSGLT1 is colored in red. MAP17 is colored in blue. The density of the detergent micelles has been omitted for clarity. c The cut-open view of the hSGLT1GFP-MAP17nb complex shows the binding site of 4D4FDG substrate inside hSGLT1. 4D4FDG is colored in green. The hSGLT1 is colored the same as in (b). d The electron density of 4D4FDG and nearby residues. e Topology of the hSGLT1-MAP17 complex. The unsolved regions are shown as dashed lines. The moving region of hSGLT1 is colored in blue and the less-mobile region is colored in yellow. f The hSGLT1-MAP17 complex in cartoon representation, colored the same as in (e). Helices are shown as cylinders. 4D4FDG is shown as sticks.
Fig. 2
Fig. 2. The closed intracellular gate and extracellular gate in the occluded state.
a The estimated surface potential of the hSGLT1-MAP17 complex. 4D4FDG is shown as spheres. b Top view of the cross-section of the transmembrane domain of the hSGLT1-MAP17 complex cryo-EM map, colored the same as in Fig. 1b. The map was low-pass filtered at 7 Å for representation. The numbers of transmembrane helices are labeled above each helix. c Residues forming the extracellular gate. d Residues forming the intracellular gate. 4D4FDG and gating residues are shown as sticks.
Fig. 3
Fig. 3. Structural changes from the outward-open to the occluded conformation.
a Superposition of hSGLT1outward-open (grey, PDB ID: 7WMV) and hSGLT1occluded (colored). The less-mobile region is shown as a yellow surface, and the moving region is shown as cartoons. Helices are shown as cylinders. b The top view of hSGLT1, the movements of helices are shown as red arrows. c The bottom view of hSGLT1. d The 180° rotation of (a). e The movements of residues at the extracellular gate, the color is the same as (a). The movements of residues are indicated as red arrows.  f Structural comparison of the Na2 site, the color is the same as (a). g Structural comparison at the sugar substrate-binding site, the color is the same as (a). h  Structural comparison of the Na3 site, the color is the same as (a).
Fig. 4
Fig. 4. Structural changes from the occluded conformation to the inward-open conformation.
a Superposition of hSGLT1inward-open (grey, PDB ID:7SLA) and hSGLT1occluded (colored). The less-mobile region is shown as a yellow surface, the moving region is shown as cartoons. Helices are shown as cylinders. b The top view of hSGLT1, the movements of helices are shown as red arrows. c The bottom view of hSGLT1. d The 180° rotation of (a). e The movements of residues at the Na2 site, the color is the same as (a). f The movements of residues at the Na3 site, the color is the same as (a). g The movements of residues at the substrate-binding site, the color is the same as (a). h The movements of residues at the intracellular gate, the color is the same as (a).
Fig. 5
Fig. 5. The MAP17 facilitates surface expression of hSGLT2.
a Superposition of TM13 and MAP17 of hSGLT2inward-open (orange) and hSGLT2occluded (purple). b Superposition of TM13 and MAP17 of hSGLT2outward-open (green) and hSGLT2occluded (purple). c Superposition of TM13 and MAP17 of hSGLT1outward-open (blue) and hSGLT1occluded (pink). d Surface expression of wild-type hSGLT2 as determined by antibody mAb90 binding, data are normalized to hSGLT2-MAP17. (Data are shown as means ± standard deviations; n = 3 biologically independent experiments.) e 1-NBD-glucose uptake of wild-type hSGLT1 and hSGLT2, data are normalized to hSGLT2-MAP17. (Data are shown as means ± standard deviations; n = 3 biologically independent experiments.) Source data are provided as a Source Data file.
Fig. 6
Fig. 6. Working model of sugar transport by SGLT.
SGLT1 embedded in the membrane is shown as cartoons. Two gating helices are shown as yellow cylinders. Four helices in the moving region are shown as blue cylinders. Sugar substrates were shown as hexagons, and sodium ions are shown as green spheres.

References

    1. Wright EM, Loo DD, Hirayama BA. Biology of human sodium glucose transporters. Physiol. Rev. 2011;91:733–794. doi: 10.1152/physrev.00055.2009. - DOI - PubMed
    1. Gyimesi G, Pujol-Gimenez J, Kanai Y, Hediger MA. Sodium-coupled glucose transport, the SLC5 family, and therapeutically relevant inhibitors: from molecular discovery to clinical application. Pflugers Arch. 2020;472:1177–1206. doi: 10.1007/s00424-020-02433-x. - DOI - PMC - PubMed
    1. Ferrannini E. Sodium-glucose co-transporters and their inhibition: clinical physiology. Cell Metab. 2017;26:27–38. doi: 10.1016/j.cmet.2017.04.011. - DOI - PubMed
    1. Mohebi, R. & Januzzi, J. L. Cardiovascular benefit of SGLT2 inhibitors. Crit. Rev. Clin. Lab. Sci. 59, 142–155 (2022). - PubMed
    1. Inoue T, et al. Mizagliflozin, a novel selective SGLT1 inhibitor, exhibits potential in the amelioration of chronic constipation. Eur. J. Pharmacol. 2017;806:25–31. doi: 10.1016/j.ejphar.2017.04.010. - DOI - PubMed

Publication types