. 2023 May 22;14(1):2935.
doi: 10.1038/s41467-023-38456-y.

Dasatinib overcomes glucocorticoid resistance in B-cell acute lymphoblastic leukemia

Affiliations

Dasatinib overcomes glucocorticoid resistance in B-cell acute lymphoblastic leukemia

Jolanda Sarno et al. Nat Commun. .

Abstract

Resistance to glucocorticoids (GC) is associated with an increased risk of relapse in B-cell progenitor acute lymphoblastic leukemia (BCP-ALL). Performing transcriptomic and single-cell proteomic studies in healthy B-cell progenitors, we herein identify coordination between the glucocorticoid receptor pathway with B-cell developmental pathways. Healthy pro-B cells most highly express the glucocorticoid receptor, and this developmental expression is conserved in primary BCP-ALL cells from patients at diagnosis and relapse. In-vitro and in vivo glucocorticoid treatment of primary BCP-ALL cells demonstrate that the interplay between B-cell development and the glucocorticoid pathways is crucial for GC resistance in leukemic cells. Gene set enrichment analysis in BCP-ALL cell lines surviving GC treatment show enrichment of B cell receptor signaling pathways. In addition, primary BCP-ALL cells surviving GC treatment in vitro and in vivo demonstrate a late pre-B cell phenotype with activation of PI3K/mTOR and CREB signaling. Dasatinib, a multi-kinase inhibitor, most effectively targets this active signaling in GC-resistant cells, and when combined with glucocorticoids, results in increased cell death in vitro and decreased leukemic burden and prolonged survival in an in vivo xenograft model. Targeting the active signaling through the addition of dasatinib may represent a therapeutic approach to overcome GC resistance in BCP-ALL.


Conflict of interest statement

The authors declare no competing interests.

Figures
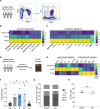
Fig. 1
Fig. 1. Glucocorticoid and B-cell pathways are co-expressed in healthy human B-cell progenitors.
A Flow cytometry gating strategy used to sort B-cell developmental populations (pre-pro-B: CD34+/CD38+/TdT+/CD24-; pro-B: CD34low/CD38+/TdT-/CD24+; pre-B: CD34-/CD38+/TdT-/CD24+) in three healthy bone marrow donors for RNA-Seq analysis. B Canonical pathways are significantly enriched during development. Pathways highly correlated with BCR signaling were plotted; bold indicates BCR and glucocorticoid-related pathways. Heatmap is colored based on the z-score of IPA results. C Upstream regulators across development correlated with BCR complex; bold indicates BCR and glucocorticoid-related pathways. Heatmap is colored based on the z-score of IPA results. D Experimental workflow of healthy bone marrow donors analyzed by CyTOF. E Scaled median expression of B-cell related proteins and glucocorticoid receptor (GCR) in healthy pre-pro-B, pro-B, and pre-B cells. F GCR expression (Mean ± SEM) across cell cycle states (n = 3 healthy donors). Kruskal–Wallis nonparametric test is used to test significance (α = 0.05); G0 vs S p = 0.0285; G0 vs G2 p = 0.0358; S vs M p = 0.0225; G2 vs M p = 0.0255. G Mean percentage of each cell cycle phase in vehicle (ethanol) and dexamethasone (dex, 1 µM) treated cells. Paired t-test dexamethasone vs vehicle: G0: p = 0.0005, G1: p = 0.0021; S: p = 0.0789. H Percentage of live cells (cCASP3-/cPARP-) in vehicle (ethanol) and dexamethasone (1 μM) treated healthy cells (n = 3 healthy donors). Two-tailed paired t-test was used to test significance, p = 0.0742, not significant. Asterisks indicate p values as calculated by a two-tailed t-test (*p ≤ 0.5; **p ≤ 0.01; ***p ≤ 0.001; n.s. not significant). Source data are provided as a Source Data file. The experimental workflow was created with Biorender.com.
Fig. 2
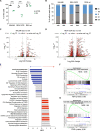
Fig. 2. Glucocorticoid-mediated response and resistance in NALM6 and REH GCR cells.
A Percentage of live cells (cPARP-/cCASP3- gated cells) in vehicle (ethanol, veh) and dexamethasone (dex, 1 µM) treated conditions in NALM6 and REH overexpressing GCR (REH GCR) and REH wild type (wt). Individual plots from three independent biological replicates are shown with the median and significance was tested using a two-tailed paired t-test. NALM6: p = 0.0012; REH GCR: p = 0.0075. B Frequency in each cell cycle phase in vehicle versus dexamethasone (1 µM) NALM6, REH GCR, and REHwt cells. Asterisks indicate the significance of Fisher’s LSD test between vehicle and dexamethasone for each phase. NALM6: G1 p = 0.0263; S p = 0.0007; REH GCR: G0 p = 0.0003, G1 p < 0.0001, S p < 0.0001. C Differentially expressed genes in NALM6 cells in dexamethasone versus vehicle. The log2FoldChange (log2FC), p values, and adjusted p values (padj) were calculated using DESeq2 default settings (alpha = 0.05, lfcThreshold = 1, pAdjustMethod = “BH”) and significant genes were considered the ones with padj <0.05. Volcano plots were generated using EnhancedVolcano R package and default cutoffs were used: FC| > |2 and p value 10e−6. D Differentially expressed genes in REH GCR cells in dexamethasone versus vehicle. The log2FC, p values and adjusted p values (padj) were calculated using DESeq2 default settings (alpha = 0.05, lfcThreshold = 1, pAdjustMethod = “BH”) and significant genes were considered the ones with padj <0.05. Volcano plots were generated using EnhancedVolcano R package and default cutoffs were used: FC| > |2 and p value 10e−6. E NES (normalized enrichment score) after GSEA analysis using the Reactome database. Blue bars indicate cell cycle-related pathways downregulated in dexamethasone-treated cells, while red bars highlight BCR downstream signaling pathways upregulated in dexamethasone-treated cells. FDR <0.25 cutoff was used. F Enrichment plots of cell cycle checkpoints with specific NES score and FDR value G Enrichment plots of downstream signaling events of BCR with specific NES score and FDR value. Source data are provided as a Source Data file.
Fig. 3
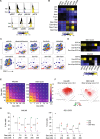
Fig. 3. Response to combination treatment with dexamethasone and tyrosine kinase inhibitors in cell lines.
A Expression of signaling molecules in live (cPARP-/cCASP3-) REH GCR cells treated with either vehicle or dexamethasone. Histograms are colored based on mean expression compared to vehicle. B Phosphoproteins expression in live (cPARP/cCASP3) REH GCR cells following treatments for 48 h. The red box indicated the most significant treatment as calculated in Supplementary 2C. C tSNE density plots of live REH GCR cells following treatments. In red is highlighted the population emerging after dexamethasone treatment and the numbers indicate the number of cells in the gates D Expression of signaling proteins in NALM6 and REH GCR live cells following treatments for 48 h. Pre-BCR signaling stimulation has been performed treating cells with IgM for 10 min and H2O2 for 5 min. The ratio of the mean expression (arcsin transformed) compared to vehicle is plotted. E Percentage of NALM6 and REH GCR live cells (Ann V-/7AAD- cells) following treatment with five different concentrations of dexamethasone (dex), dasatinib (das), and combinations (n = 36). Red boxes highlight areas of most synergy among drug combinations. F Bliss synergy score (δ score) among dexamethasone and dasatinib combinations in NALM6 (left) and REH GCR (right). G Viability (Ann V-/7AAD- cells) after dexamethasone (dex), dasatinib (das), dexamethasone + dasatinib (dex + das) conditions in NALM6 (left), and REH GCR cells (right). A total of n = 4 independent experiments are plotted as mean ± SEM. Asterisks indicate significant differences between single-drug treatments compared to the combined treatment obtained from ANOVA analysis followed by Tukey’s test (α = 0.05). NALM6: all the comparisons p < 0.0001; REH GCR: all the comparisons p < 0.0001. Veh vehicle, dex dexamethasone, das dasatinib, Ibrut Ibrutinib, Tram Trametinib, Idel Idelalisib, BCR-xL pre-BCR crosslinking. *p ≤ 0.5; **p ≤ 0.01; ***p ≤ 0.001; ****p ≤ 0.0001. Source data are provided as a Source Data file.
Fig. 4
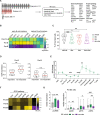
Fig. 4. Dexamethasone-resistant cells have a distinct phenotype and signaling profile.
A Graphical overview of the experimental approach for CyTOF analysis. B Normalized expression of B-cell developmental proteins and the GCR. C Percentage of live cells (cPARP-/cCASP3-) in vehicle, dexamethasone (dex), dasatinib (das), and combination (dex + das). Each point represents a patient sample, dotted lines indicate 25 and 75% quartiles and bold lines indicate medians for a total of n = 19 primary samples per condition. Asterisks indicate significant differences based on ANOVA analysis followed by Tukey’s test (α = 0.05). Dex vs vehicle: p = 0.0007; das vs vehicle: p = 0.0181; dex + das vs vehicle: p = 0.0011. D GCR expression in live pro-B and pre-B cells (cPARP-/cCASP3-) from responders (n = 11 primary samples with dexamethasone-induced cell death >10%) versus non-responders (n = 8 primary samples with dexamethasone-induced cell death <10%). Each point indicates a patient sample and is matched to panel C. Asterisks indicate significance based on a two-tailed unpaired t-test. Pro-B: responders vs non-responders p = 0.0065; Pre-B: responders vs non-responders p = 0.4030. E Mean fold change ± SEM of events assigned to each population in dexamethasone-treated cells compared to vehicle (n = 19 primary samples). ANOVA analysis followed by Fisher’s LSD test (α = 0.05) was used to identify populations that were statistically significant compared to the T-cell population. Pro-BI: p = 0.0001; Pre-BI: p < 0.0001; Pre-BII: p = 0.0047. F Fold change in protein expression between non-responders (n = 8 primary samples) versus responders (n = 11 primary samples) in a vehicle-treated condition of GCR targets. G Protein expression in vehicle, dexamethasone, and the combination in pre-BII classified cells. Box bars indicate mean expression in the n = 18 primary samples, error bars the 5th and 95th percentile and asterisks indicate significant differences based on a two-tailed paired t-test followed by Bonferroni correction. pCREB: dex vs veh p = 0.0679; dex vs dex + das p = 0.0098. prpS6: dex vs veh p = 0.0465; dex vs dex + das p = 0.0011. pSyk: dex vs veh p = 0.0756; dex vs dex + das p = 0.0558. pSRC: dex vs veh p = 0.7229; dex vs dex + das p = 0.0096; dex + das vs veh p = 0.0008. Pt10 was excluded from the analysis because no cells were classified in this population following treatment. *p ≤ 0.5 **p ≤ 0.01; ***p ≤ 0.001, ****p ≤ 0.0001. Source data are provided as a Source Data file. The experimental workflow was created with Biorender.com.
Fig. 5
Fig. 5. Prolonged treatment with glucocorticoids induces phenotypic plasticity in vitro and in vivo.
A Percentage of live cells (cPARP-/cCASP3-) in vehicle (ethanol), dexamethasone (dex, 1 µM), dasatinib (das, 100 nM), and dexamethasone + dasatinib (dex + das) conditions in two primary samples following 48 h and 6 days of treatment. B Median prpS6 and pCREB expression in live cells in Pt13R (top) and Pt14R (bottom) at Day 2 and Day 6. C Fold change of events classified into B-cell developmental populations in dexamethasone condition compared to vehicle after 48 h of treatment. D. Fold change versus vehicle of cells classified into B-cell developmental populations in dexamethasone condition after 6 days of treatment. E Experimental workflow of cohort analyzed by CyTOF at diagnosis and day 8 following prednisone monotherapy as per AEIOP-BFM 2009 protocol (Supplementary Table 1). F Mean percentage of classified leukemic cells in nine matched samples at diagnosis (gray line) and day 8 (blue line) of treatment with prednisone. Asterisks indicate populations differentially abundant at day 8 compared to diagnosis based on ANOVA analysis followed by Fisher’s LSD test (α = 0.05). Pre-BI: p < 0.0001; Pre-BII: p = 0.0081; Mature-B: p = 0.0463. G Mean (with 5th and 95th percentile) protein expression of nine primary samples at diagnosis (gray bars) and day 8 (blue bars). Asterisks indicate significance based on a two-tailed paired t-test. CD10: p = 0.0024; TdT: p = 0.0176; CD43: p = 0.0385; CD19: p = 0.0436; CD24: p = 0.0313; prpS6: p = 0.0038; pERK: p = 0.0081. *p ≤ 0.5 **p ≤ 0.01; ***p ≤ 0.001. Source data are provided as a Source Data file.
Fig. 6
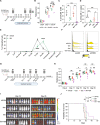
Fig. 6. Combination of dexamethasone with dasatinib reduces engraftment and increases survival in vivo.
A Experimental workflow B Tumor growth by bioluminescence. Dot plots represent the measured radiance for each mouse, while the bar indicates the mean radiance for each group. On day 4 n = 8 mice per group were measured, on day 11 n = 8 for vehicle and dexamethasone groups and n = 7 for dasatinib and dex + das groups, on day 14 n = 8 for vehicle and dexamethasone groups, n = 7 for dasatinib group and n = 2 for dex + das group. To test significance, a two-way ANOVA mixed model followed by Tukey’s test for multiple comparisons has been used with p = 0.05 confidence level. Day 11: dex+das vs veh p = 0.0077; dex vs dex + das p = 0.0087; das vs dex + das p = 0.0254. Day 14: dex vs veh p = 0.0028; dex + das vs veh p = 0.0009; dex vs dex + das p = 0.0012; das vs dex + das p < 0.0001. C Bone marrow engraftment of NALM6 cells (mean ± SEM), identified as mCD45.1-/ hCD19+ by flow cytometry (n = 4 mice per group) D Spleen engraftment of NALM6 cells (mean ± SEM), identified as mCD45.1-/ hCD19+ by flow cytometry (n = 4 per group except n = 2 in dexamethasone + dasatinib group). One-way ANOVA analysis followed by LSD’s test for statistics. E Developmental classification of engrafted cells (murine CD45.1-) in vehicle (n = 4) and dexamethasone-treated mice (n = 4) shown as mean ± SEM. Two-way ANOVA followed by Bonferroni correction was used to calculate significant comparisons. F pCREB and prpS6 in engrafted cells from mice treated with vehicle, dexamethasone, dasatinib, and dexamethasone + dasatinib. G Experimental workflow. H Tumor growth by bioluminescence. Dot plots and mean are represented, and a two-way ANOVA mixed model followed by Tukey’s test for multiple comparisons was used with p = 0.05 confidence level. Day 11: dex + das vs veh p = 0.0047; das vs dex + das p = 0.0069. Day 15: dex + das vs veh p = 0.0435; das vs dex + das p = 0.0060. Day 19: dex + das vs veh p = 0.0085; dex vs dex + das p = 0.0497; das vs dex + das p = 0.0142. Day 25: dex + das vs veh p = 0.0044; dex vs veh p = 0.0218; das vs dex + das p = 0.0019. I Bioluminescence images of NSG mice at Day 15 and Day 25 post engraftment with NALM6/Luc+ cells. Crossed-out mice indicate experimental mice excluded from the analysis because they did not develop leukemia or died without leukemia. J Kaplan–Meier analysis in vehicle, dexamethasone, dasatinib, or dexamethasone + dasatinib conditions. Significance by log-rank test for each group-group comparison. Dex vs veh: p = 0.0078; dex vs dex + das: p = 0.0376; das vs dex + das: p = 0.0029; dex + das vs veh: p = 0.0011. *p ≤ 0.5; **p ≤ 0.01; ***p ≤ 0.001. Source data are provided as a Source Data file. The experimental workflow was created with Biorender.com.

References

    1. Dördelmann M, et al. Prednisone response is the strongest predictor of treatment outcome in infant acute lymphoblastic leukemia. Blood. 1999;94:1209–1217. doi: 10.1182/blood.V94.4.1209. - DOI - PubMed
    1. DeVita VT, Chu E. A history of cancer chemotherapy. Cancer Res. 2008;68:8643–8653. doi: 10.1158/0008-5472.CAN-07-6611. - DOI - PubMed
    1. Nguyen K, et al. Factors influencing survival after relapse from acute lymphoblastic leukemia: a Children’s Oncology Group study. Leukemia. 2008;22:2142–2150. doi: 10.1038/leu.2008.251. - DOI - PMC - PubMed
    1. Schmidt S, et al. Glucocorticoid-induced apoptosis and glucocorticoid resistance: molecular mechanisms and clinical relevance. Cell Death Differ. 2004;11:S45–S55. doi: 10.1038/sj.cdd.4401456. - DOI - PubMed
    1. Taves MD, Ashwell JD. Glucocorticoids in T cell development, differentiation and function. Nat. Rev. Immunol. 2020;21:233–243. doi: 10.1038/s41577-020-00464-0. - DOI - PubMed

Publication types

MeSH terms

Supplementary concepts