Meta-Analysis
. 2023 May 22;14(1):2912.
doi: 10.1038/s41467-023-38530-5.

Cell type specific transcriptomic differences in depression show similar patterns between males and females but implicate distinct cell types and genes

Affiliations
Meta-Analysis

Cell type specific transcriptomic differences in depression show similar patterns between males and females but implicate distinct cell types and genes

Malosree Maitra et al. Nat Commun. .

Abstract

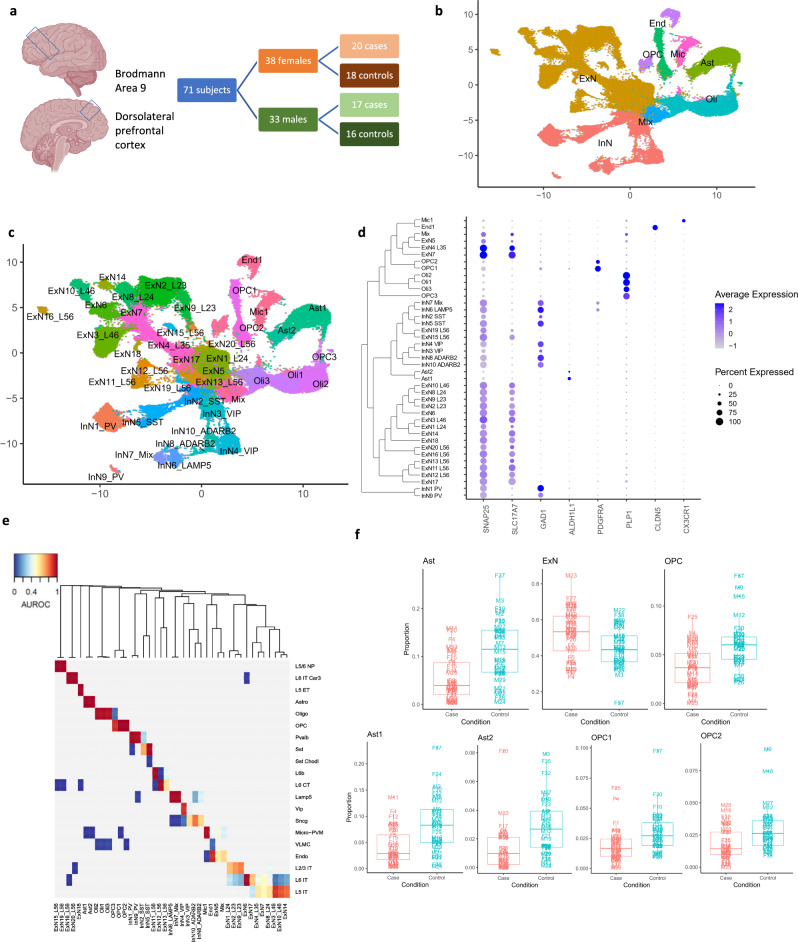
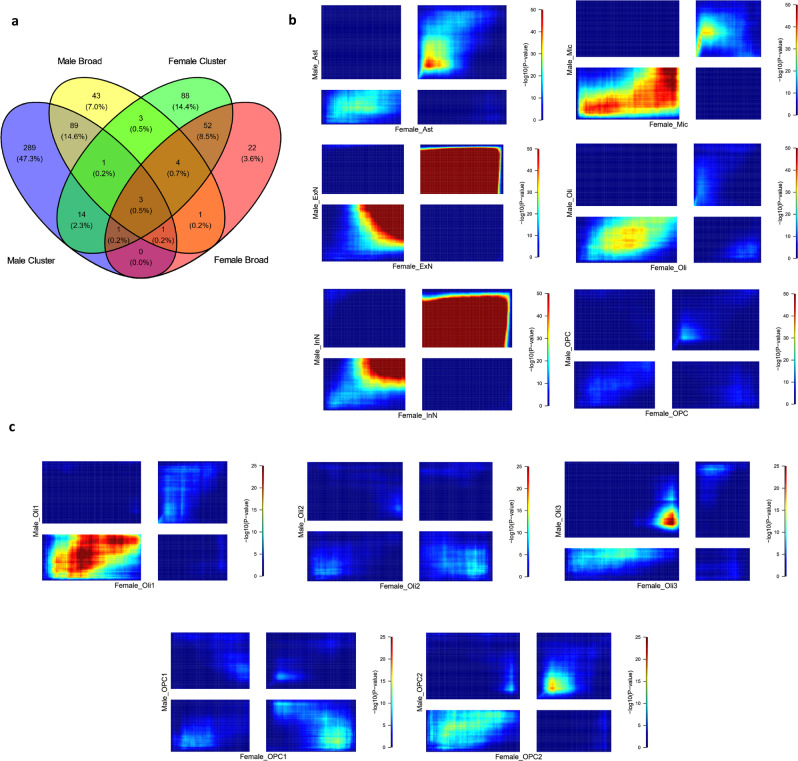
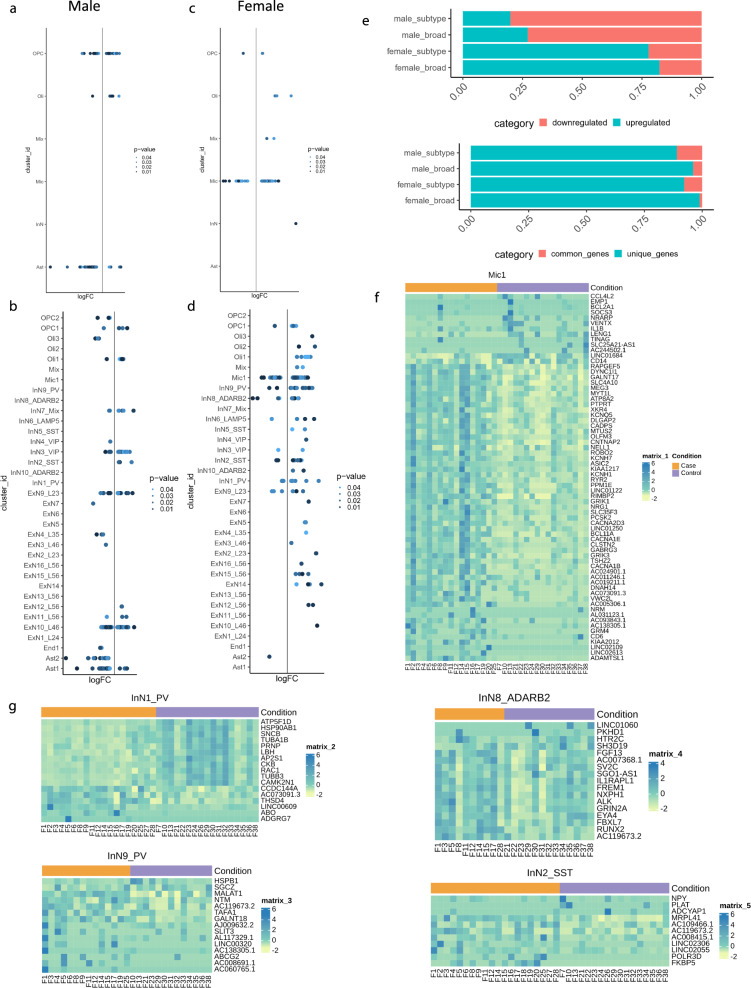
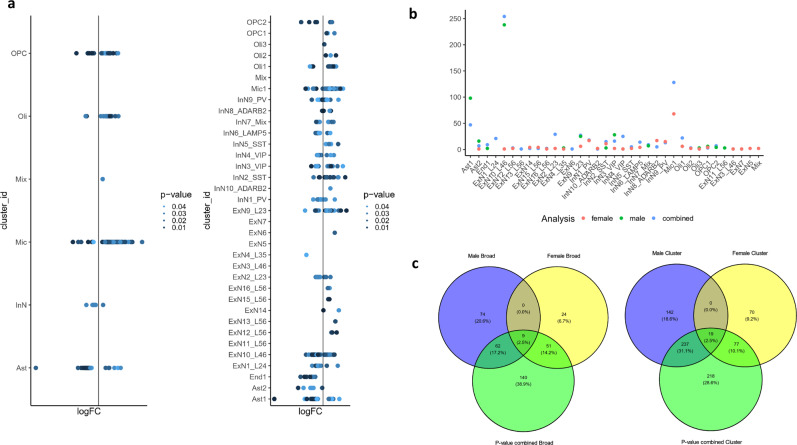
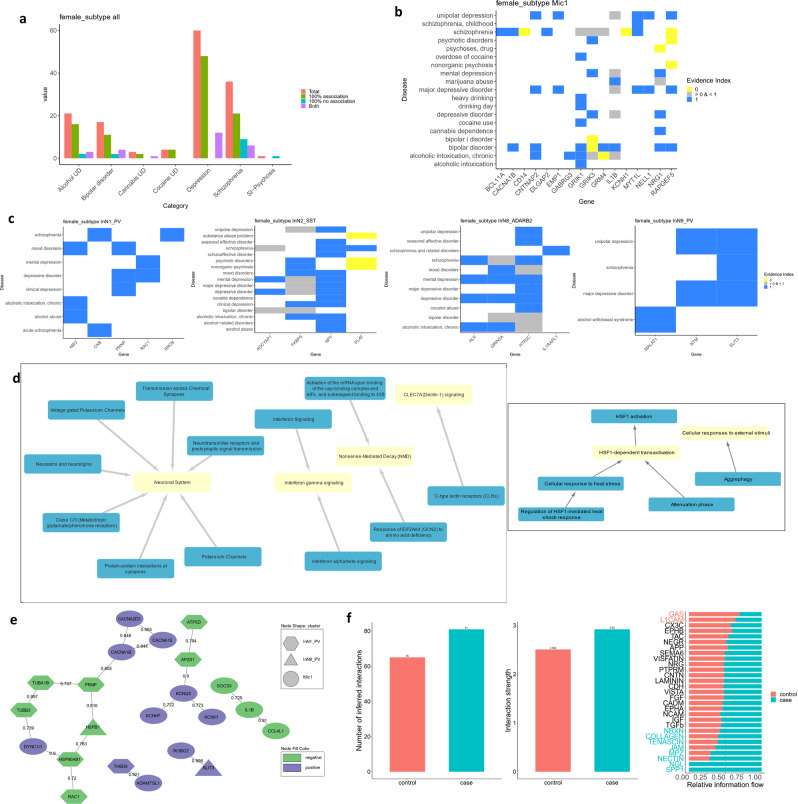
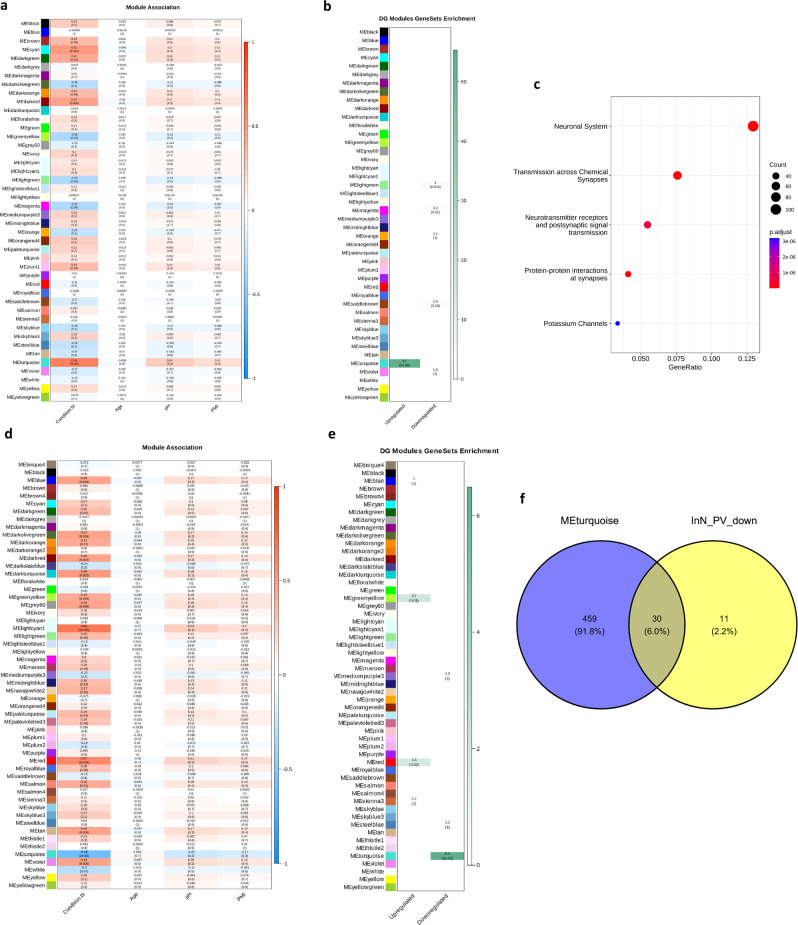
Major depressive disorder (MDD) is a common, heterogenous, and potentially serious psychiatric illness. Diverse brain cell types have been implicated in MDD etiology. Significant sexual differences exist in MDD clinical presentation and outcome, and recent evidence suggests different molecular bases for male and female MDD. We evaluated over 160,000 nuclei from 71 female and male donors, leveraging new and pre-existing single-nucleus RNA-sequencing data from the dorsolateral prefrontal cortex. Cell type specific transcriptome-wide threshold-free MDD-associated gene expression patterns were similar between the sexes, but significant differentially expressed genes (DEGs) diverged. Among 7 broad cell types and 41 clusters evaluated, microglia and parvalbumin interneurons contributed the most DEGs in females, while deep layer excitatory neurons, astrocytes, and oligodendrocyte precursors were the major contributors in males. Further, the Mic1 cluster with 38% of female DEGs and the ExN10_L46 cluster with 53% of male DEGs, stood out in the meta-analysis of both sexes.


Conflict of interest statement

The authors declare no competing interests.

Figures

Fig. 1
Fig. 1. Overview of cell types characterized in the dlPFC.
a Schematic of study design. Diagrams depict the brain region of interest, Brodmann area 9, corresponding to the dlPFC. b UMAP plot colored by the broad cell types. c UMAP plot colored by the individual clusters identified and annotated. For UMAP plots, the x and y-axes represent the first and second UMAP co-ordinates respectively. d DotPlot depicting the expression of marker genes (SNAP25 – neurons, SLC17A7 – excitatory neurons, GAD1 – inhibitory neurons, ALDH1L1 – astrocytes, PDGFRA – oligodendrocyte precursor cells, PLP1 – oligodendrocytes, CLDN5 – endothelial cells, CX3CR1 – microglia). The dendrogram next to the cluster names shows the relationship between the clusters by using the distance based on average expression of highly variable genes. e Best hits heatmap from MetaNeighbor showing the correspondence between the clusters in our dataset (columns) and the broad categories of cells identified in the Allen Brain Institute human motor cortex snRNA-seq dataset (rows). f Boxplots showing the proportion of nuclei in each cluster for each subject split by cases and controls for the broad OPC, astrocyte, and excitatory neuron cell types and the Ast1, Ast2, OPC1, and OPC2 clusters (n = 37 cases, 34 controls, representing biologically independent samples for each cluster or broad cell type). The middle line is the median. The lower and upper hinges correspond to the 25th and 75th percentiles. Upper and lower whiskers extend from the upper or lower hinges to the largest or smallest value no further than 1.5 times the inter-quartile range from the hinge, where the inter-quartile range is the distance between the first and third quartiles. Points beyond the end of the whiskers are plotted individually. In Fig. 1c–e, excitatory neuronal cluster names contain approximate layer annotations and inhibitory neuronal cluster names contain MGE or CGE specific marker information as a suffix where applicable, as described in methods: Cluster annotation. For example, ExN10_L46 denotes a cluster of excitatory neurons with enrichment of marker genes from layer 4 to layer 6 of the cortex and InN1_PV denotes a cluster on inhibitory neurons with enrichment of the MGE specific marker PV. This convention is used throughout the paper. Brain diagram in 1a was created with BioRender.com. Source data are provided as a Source Data file.
Fig. 2
Fig. 2. Overall comparison of cell type specific MDD-associated gene expression changes in males and females.
a Venn diagram showing the overlap of DEGs between the male and female datasets at the broad cell type and cluster levels. b RRHO2 plots for correspondence between differential expression results for broad cell types in the female (x-axis) and male (y-axis) datasets. Warm colors in the bottom left and top right quadrants reflect overlap in genes with increased expression or decreased expression respectively, in cases versus controls between the male and female datasets. Warm colors in the top left and bottom right quadrants reflect overlaps in genes with the opposite direction of effects between the male and female datasets. For each dataset, genes were ranked according to the value of the log of the fold change multiplied by the negative base 10 logarithm of the uncorrected p-value from differential expression analysis. c RRHO2 plots similar to (b) but for oligodendrocyte lineage clusters. For RRHO2 plots comparing broad cell types the color scale maximum was set to a −log10(p-value) of 50, and for RRHO2 plots comparing clusters the color scale maximum was set to a −log10(p-value) of 25 for ease of comparison. RRHO2 uses one-sided hypergeometric tests, the p-values plotted here are uncorrected. Source data are provided as a Source Data file.
Fig. 3
Fig. 3. Cell type specific differential gene expression in males and females with MDD.
a, b Distribution of differentially expressed genes in (a) broad cell types and (b) clusters with increased and decreased expression in male cases compared to controls. c, d Distribution of differentially expressed genes in (c) broad cell types and (d) clusters with increased and decreased expression in female cases compared to controls. For ad, points are colored by the corrected p-value for differential expression, and upregulated genes are plotted to the right of the midline while downregulated genes are plotted to the left. e Barplots showing proportions of up and downregulated genes and unique and shared genes. For males, the majority of DEGs were decreased in expression in cases compared to controls both at the broad (110/151, 73%) and cluster levels (358/447, 80%) and most DEGs were cell type specific both at the broad (145/151, 96% unique DEGs) and cluster (398/447, 89% unique DEGs) level. For females, the majority of DEGs were upregulated both at the broad (70/85, 82%) and the cluster level (140/180, 78%) and most DEGs were cell type specific both at the broad (84/85, 99% unique DEGs) and cluster (166/180, 92% unique DEGs) level. f, g Heatmaps showing the pseudobulk expression of differentially expressed genes in top clusters with highest number of DEGs in the female cluster level analysis—f microglia, g inhibitory neuronal clusters. For f, g, the plotted values are pseudobulk CPMs (counts per million) calculated with edgeR and muscat and scaled per row (by gene). For all heatmaps (f, g), the annotation bar at the top is colored orange for cases and purple for controls, and rows and columns are not clustered. Statistical testing corresponding to Fig. 3a–d were performed with the edgeR (glmQLFit, glmQLFtest), FDR (Benjamini & Hochberg) corrected p-values are plotted. Source data are provided as a Source Data file.
Fig. 4
Fig. 4. p-value combination meta-analysis results.
a, b Distribution of DEGs across the (left) broad cell types and (right) clusters after p-value combination meta-analysis. b Numbers of DEGs (y-axis) in each cluster for the male analysis, female analysis, and meta-analysis. c, d Overlap of meta-analysis DEGs with the individual analyses of the male and female datasets for (c) broad cell types and (d) clusters. The statistical test performed is Fisher combination of p-values as implemented in metaRNAseq, the test is one-sided, and the p-values were Benjamini Hochberg corrected. Source data are provided as a Source Data file.
Fig. 5
Fig. 5. Characterization of cell type specific DEGs in females with MDD.
a PsyGeNET literature reported gene-disease association bar plot for all DEGs in the female cluster level analysis. The y-axis shows the number of gene-disease associations. “100% association” indicates all evidence is in support, “100% no association” indicates the opposite, while “Both” indicates mixed support. b, c Gene-disease association heatmaps for 5 clusters with the highest numbers of DEGs in females: b microglia, c inhibitory neuron clusters. Evidence index of 1 indicates that all literature supports the association, while 0 indicates that there is no support for the association. Values in between indicate partial support. d Networks showing the relationship between main gene sets (yellow) and all gene sets (blue) with enrichment in pre-ranked GSEA with Reactome pathways in Mic1 (left) and InN9_PV (right) in females. Controlling for the overlap between gene sets, the main gene sets are independently enriched. e STRING network showing DEGs in female microglia and PV interneurons whose protein products have reported interactions. The shape of the node represents the cluster in which the DEG was detected, and the color represents the direction of fold change in cases compared to controls. The numbers on the edges represent the confidence scores for the interactions. f (left) Bar plots showing the number and strength of ligand-receptor communications within and between PV interneurons and microglia in cases and controls. (right) Relative strength of communication in different signaling pathways for cases and controls. Source data are provided as a Source Data file.
Fig. 6
Fig. 6. WGCNA results for microglia and PV interneurons in females.
a Heatmap showing the correlation and associated p-value, in parentheses, of Mic1 WGCNA module eigengenes with case-control status and covariates (age, pH, PMI). b Heatmap showing the test-statistic and FDR corrected p-value, in parentheses, for one-sided Fisher tests of overlap between the Mic1 WGCNA module member genes and DEGs in females in Mic1. c Top Reactome pathway gene sets over-represented in Mic1 WGCNA, in the MEturqouise module using one-tailed hypergeometric testing. Uncorrected p-values are plotted. d Heatmap showing the correlation and associated p-value, in parentheses, of InN_PV WGCNA module eigengenes with case-control status and covariates. e Heatmap showing the test-statistic and FDR corrected p-value, in parentheses, for one-sided Fisher tests of overlap between the InN_PV WGCNA module member genes and DEGs in females the InN1_PV or InN9_PV clusters. f Venn diagram showing the overlap of Reactome pathway gene sets enriched in the InN_PV WGCNA module MEturquoise (associated negatively with case status) and downregulated via GSEA in cases within InN1_PV or InN9_PV. For 6a, 6d the statistical test performed was a Pearson correlation as implemented in the WGCNA package and p-values are one-sided and uncorrected. Source data are provided as a Source Data file.

References

    1. James SL, et al. Global, regional, and national incidence, prevalence, and years lived with disability for 354 diseases and injuries for 195 countries and territories, 1990–2017: a systematic analysis for the Global Burden of Disease Study 2017. Lancet. 2018;392:1789–1858. doi: 10.1016/S0140-6736(18)32279-7. - DOI - PMC - PubMed
    1. American Psychiatric, A. Diagnostic and Statistical Manual Of Mental Disorders: DSM-5-TR. (American Psychiatric Association Publishing, Washington, DC, 2022).
    1. Howard DM, et al. Genome-wide meta-analysis of depression identifies 102 independent variants and highlights the importance of the prefrontal brain regions. Nat. Neurosci. 2019;22:343–352. doi: 10.1038/s41593-018-0326-7. - DOI - PMC - PubMed
    1. Gandal MJ, et al. Shared molecular neuropathology across major psychiatric disorders parallels polygenic overlap. Science. 2018;359:693–697. doi: 10.1126/science.aad6469. - DOI - PMC - PubMed
    1. Kessler RC, Bromet EJ. The epidemiology of depression across cultures. Annu. Rev. Public Health. 2013;34:119–138. doi: 10.1146/annurev-publhealth-031912-114409. - DOI - PMC - PubMed

Publication types