. 2023 May 22;14(1):2740.
doi: 10.1038/s41467-023-38292-0.

AMPK is a mechano-metabolic sensor linking cell adhesion and mitochondrial dynamics to Myosin-dependent cell migration

Affiliations

AMPK is a mechano-metabolic sensor linking cell adhesion and mitochondrial dynamics to Myosin-dependent cell migration

Eva Crosas-Molist et al. Nat Commun. .

Abstract

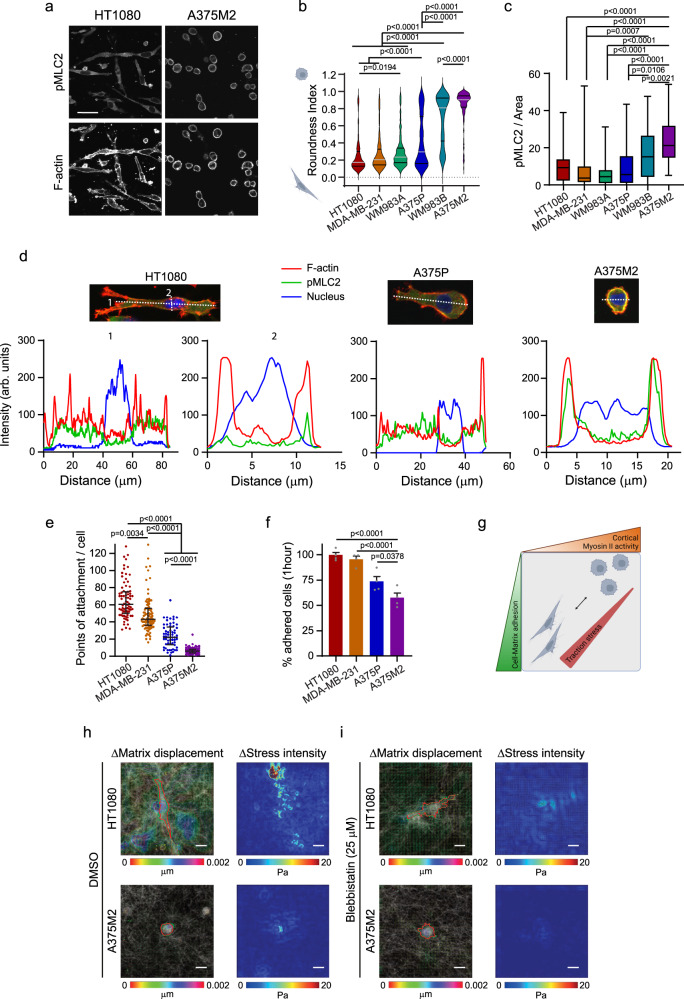
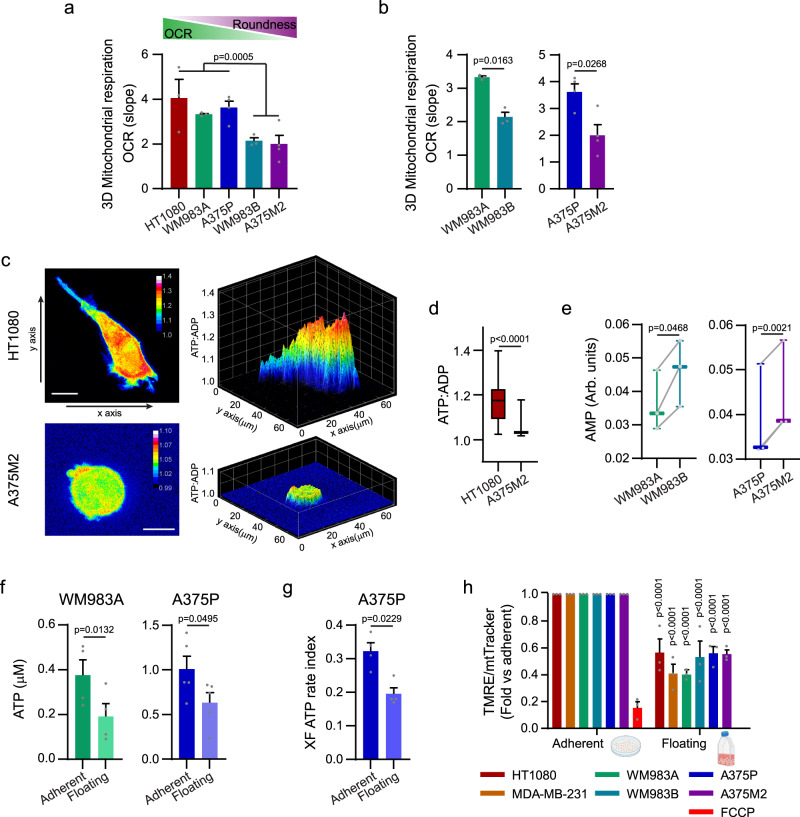
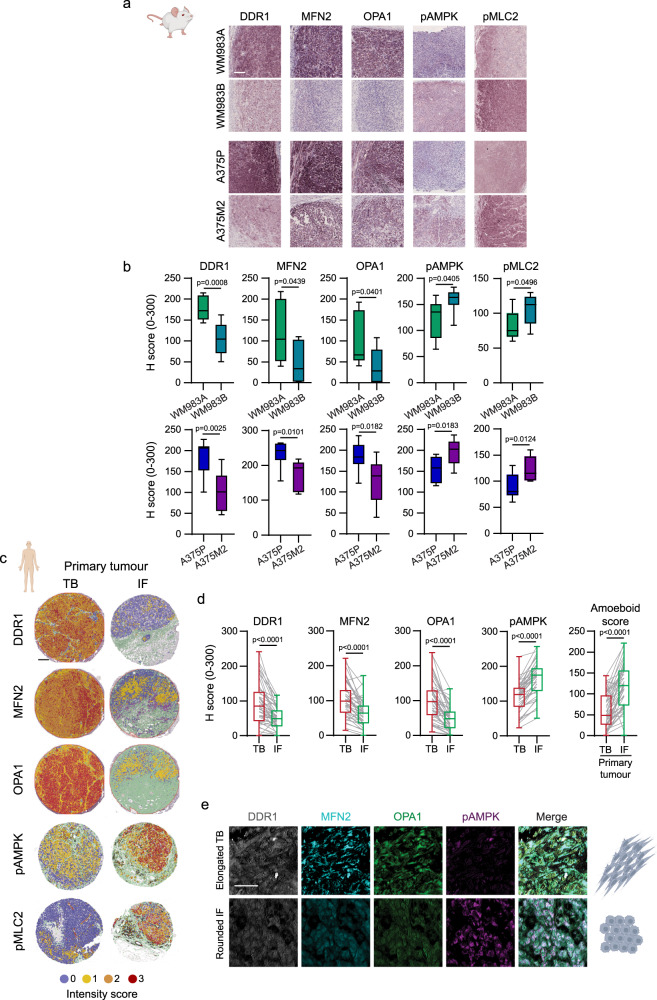
Cell migration is crucial for cancer dissemination. We find that AMP-activated protein kinase (AMPK) controls cell migration by acting as an adhesion sensing molecular hub. In 3-dimensional matrices, fast-migrating amoeboid cancer cells exert low adhesion/low traction linked to low ATP/AMP, leading to AMPK activation. In turn, AMPK plays a dual role controlling mitochondrial dynamics and cytoskeletal remodelling. High AMPK activity in low adhering migratory cells, induces mitochondrial fission, resulting in lower oxidative phosphorylation and lower mitochondrial ATP. Concurrently, AMPK inactivates Myosin Phosphatase, increasing Myosin II-dependent amoeboid migration. Reducing adhesion or mitochondrial fusion or activating AMPK induces efficient rounded-amoeboid migration. AMPK inhibition suppresses metastatic potential of amoeboid cancer cells in vivo, while a mitochondrial/AMPK-driven switch is observed in regions of human tumours where amoeboid cells are disseminating. We unveil how mitochondrial dynamics control cell migration and suggest that AMPK is a mechano-metabolic sensor linking energetics and the cytoskeleton.


Conflict of interest statement

The authors declare no competing interests.

Figures

Fig. 1
Fig. 1. Cytoskeleton, adhesion and traction stress in 3D migration.
Cells seeded on a 3D collagen I matrix. a pMLC2 and F-actin confocal images in HT1080 and A375M2 cells (n = 3). Scale bar = 50 μm. b, c Quantification of cell morphology (211, 291, 313, 358, 339 and 311 cells pooled from n = 6) (b) and pMLC2 immunofluorescence signal normalized by cell area (45, 72, 65, 79, 85 and 83 pooled from n = 3) (c). d Representative fluorescence intensity line scans (dashed white lines in image) showing distribution of F-actin (red), pMLC2 (green) and nucleus (blue) along elongated-mesenchymal (HT1080 and A375P) and rounded-amoeboid (A375M2) cells (n = 10 cells/cell line). e Quantification of points of attachment between cells and matrix (78, 99, 61 and 112 cells pooled from n = 3). f Percentage of adhered cells 1 h after seeding on a matrix of collagen I (n = 4). g Scheme showing that cell morphology, Myosin II activity and adhesion to the matrix define the mode of migration and the stress exerted into the matrix (Created with BioRender.com). h, i Cells treated with vehicle (DMSO) or blebbistatin (25 μM). (Left) Representative displacement vector maps from maximum intensity projections of cells obtained from the tracked displacements of collagen I fibres between 0 to 2 min. Red and green boundaries indicate the outline of the cell in the previous and current frames, respectively. Scale bar = 20 μm. (Right) Representative traction stress magnitude maps corresponding to displacement maps. Colour bar indicates traction stress magnitude (Pascal, Pa). Scale bar = 20 μm. Dot plot (e) shows median with interquartile range (each dot represents a single cell). Violin plot (b) shows median with interquartile range. Box plots (c) show median (centre line), interquartile range (box) and min-max values (whiskers). Graph (f) shows mean ± SEM. p values by Kruskal–Wallis test with Dunn’s multiple comparisons test (b, c, e), one-way ANOVA with Dunnett’s correction versus A375M2 (f). All n are indicative of independent experiments unless otherwise stated. Source data are provided as a Source Data file. See also Supplementary Fig. 1.
Fig. 2
Fig. 2. Different modes of migration and mitochondrial metabolism.
a, b Oxygen consumption rate (OCR) from cells embedded in a 3D collagen I matrix (n = 3). Comparison between elongated-mesenchymal and rounded-amoeboid cells in a panel of cell lines and between the melanoma pairs. c Maximal intensity projection (left) and 3D representation (right) of ATP:ADP ratio in HT1080 and A375M2 cells expressing Perceval HR biosensor, embedded in a 3D collagen I matrix. Scale bar = 10 μm. d Quantification of ATP:ADP ratio from (c) (18 cells/condition pooled from n = 3). e AMP levels quantified by 1H-NMR for the indicated cell lines (n = 3). f Intracellular ATP levels in WM983A and A375P cells grown under adherent or floating conditions for 24 h (WM983A, n = 4; A375P, n = 5). g XF ATP rate index indicative of the ratio of mitochondrial and glycolytic ATP Production Rate in A375P under adherent or floating conditions for 24 h (n = 4). h Quantification of Tetramethylrhodamine Ethyl Ester Perchlorate (TMRE) fluorescence intensity normalized by MitoTracker Deep Red signal by FACS in cells adhered on plastic or floating cells for 24 h. Data shown as fold versus adherent cells (n = 3). Graphs (a, b, f, g, h) show mean ± SEM. Box plots (d, e) show median (centre line), interquartile range (box) and min-max values (whiskers). p values were calculated using two-tailed tests (a, b, dg). p value by unpaired t-test comparing elongated-mesenchymal versus rounded-amoeboid cells (a), unpaired t-test (b), paired t-test (eg), Mann-Whitney test (d) and two-way ANOVA with Sidak’s correction comparing floating vs adherent cells (h). All n are indicative of independent experiments unless otherwise stated. Source data are provided as a Source Data file. See also Supplementary Fig. 2.
Fig. 3
Fig. 3. DDR1 controls adhesion levels and energy demands.
a Heat map showing Log2 data from an Affymetrix microarray comparing A375M2 versus A375P cells or A375M2 cells seeded on collagen I and treated with Blebbistatin (Bleb) or ROCK inhibitors (Y27632 or H1152) for 24 h (GSE23764). b Expression levels of DDR1 from an Affymetrix microarray comparing A375P and A375M2 cells (n = 3). c DDR1 levels in a panel of cell lines (n = 5). Quantification normalized by TUBULIN. d (Top) Quantification of adhered cells after 1 h seeding on a collagen I matrix (n = 4). (Bottom) DDR1 protein levels after DDR1 knock-down. e Cells seeded on a collagen I matrix. Immunofluorescence images showing pMLC2 levels (green), F-actin (red) and Hoechst (blue) (n = 3). Scale bar = 50 μm. Inset shows blebbing cell for siDDR1. f Quantification of cell morphology (n = 3). g Quantification of pMLC2 immunofluorescence signal normalized by cell area (107, 105, 116, 115 cells pooled from n = 3). h 3D invasion index into a collagen I matrix (n = 5). i OCR from cells embedded in a 3D collagen I matrix (n = 3). j Quantification (left) and maximal intensity projection (right) of ATP:ADP ratio in A375P cells expressing Perceval HR biosensor, embedded in a 3D collagen I matrix (31, 29 cells pooled from n = 3). Scale bar = 10 μm. Graphs (b, d, h, i) show mean ± SEM. Violin plots (f) show median with interquartile range (each dot represents a single cell). Box plots (g, j) show median (centre line), interquartile range (box) and min-max values (whiskers) (each dot in (j) represents a single cell). p values were calculated using two-tailed tests (b, d, fj). p value by unpaired t-test (b, d, i, j), one sample t-test (h) and Mann–Whitney test (f, g). All n are indicative of independent experiments unless otherwise stated. Source data are provided as a Source Data file. See also Supplementary Fig. 3 and 4.
Fig. 4
Fig. 4. ATP levels control plasticity of cell migration through AMPK.
a AMP, ATP/AMP and ATP/ADP in A375P cells treated with rotenone (0.5 μM) and antimycin A (0.5 μM) (5 replicates/condition). b Western blot for the same conditions as in (a). c Western blot of the indicated proteins (WM983 n = 6, A375 n = 5). d Western blot upon AMPK knock-down (n = 3). e Cells grown on a collagen I matrix. Immunofluorescence images showing pMLC2 (green) and F-actin (red) (n = 3). Scale bar = 5 μm. fh Quantification of cell morphology (211, 193 cells pooled from n = 3) (f), pMLC2 immunofluorescence signal normalized by cell area (52, 66 cells pooled from n = 3) (g) and representative traction stress (n = 3). Colour bar indicates traction stress magnitude (Pascal, Pa), scale bar = 20 μm (h). i Western blot upon AMPK activation (A769662 10 μM, 30 minutes) (n = 5). jl Cells grown on a collagen I matrix. Immunofluorescence images showing pMLC2 (green) and F-actin (red) after A769662 treatment (10 μM, 24 h) (n = 3), scale bar = 10 μm (j); quantification of cell morphology (317, 283 cells pooled from n = 3) (k) and quantification of pMLC2 immunofluorescence signal normalized by cell area (81, 84 cells pooled from n = 3) (l). m, n Western blot and quantification after DDR1 knock-down and Comp C treatment (2 μM, 24 h) (n = 8 AMPK, n = 6 ACC, n = 9 MYPT1). oq Cells grown on a collagen I matrix. Immunofluorescence images showing pMLC2 (green) and F-actin (red) (n = 3), scale bar = 10 μm (o); quantification of cell morphology (274, 210, 274, 191 cells pooled from n = 3) (p) and quantification of pMLC2 immunofluorescence signal normalized by cell area (93, 84, 94, 93 cells pooled from n = 3) (q). Quantification versus corresponding total protein (b, c, d, i). Graphs (a, n) show mean ± SEM. Violin plots (f, k, p) show median with interquartile range. Box plots (g, l, q) show median (centre line), interquartile range (box) and min-max values (whiskers). p values were calculated using two-tailed tests (f, g, k, l). p value by Mann–Whitney test (f, g, k, l), one-way ANOVA with Dunnett’s correction (a) or Tukey’s multiple test (n) and Kruskal-Wallis with Dunn’s multiple comparisons test (p, q). All n are indicative of independent experiments unless otherwise stated. Source data are provided as a Source Data file. See also Supplementary Fig. 5.
Fig. 5
Fig. 5. Mitochondrial dynamics in 3D migration.
a Upon AMPK activation (A769662 10 μM, 30 min) in A375P cells, western blot of the indicated proteins (n = 3). b (Left) Representative images of mitochondrial network (Tom20, green), F-actin (red) and nucleus (Hoechst, blue) after A769662 treatment (10 μM, 24 h). Scale bar = 5 μm. (Right) Quantification of mitochondrial branches per cell from Tom20 staining (10, 17 cells pooled from n = 3). c Western blot of the indicated proteins after AMPK knock-down in A375M2 cells (n = 3). d (Left) Representative images of mitochondrial network (Tom20 (green), F-actin (red) and nucleus (Hoechst, blue)) after AMPK knock-down. Scale bar = 5 μm. (Right) Quantification of mitochondrial branches per cell from Tom20 staining (14, 13 cells pooled from n = 3). e Live cell imaging of mitochondria using MitoTracker Deep Red of the indicated cell lines stably transfected with LifeAct-GFP. Bottom panel show MitoTracker Deep Red segmentation used for quantification. Scale bar = 10 μm. Quantification of mitochondrial branches per cell from Tom20 staining (12, 20, 14, 30 cells pooled from n = 3). f Representative images of TMRE (red) and mitoTracker Green (green). Quantification of TMRE fluorescence intensity per cell (15 cells pooled from n = 3). g (Left) Representative images of mitochondrial network (Tom20, green), F-actin (red) and nucleus (Hoechst, blue) after DDR1 knock-down and Comp C treatment (2 μM, 24 h). Scale bar = 5 μm. (Right) Quantification of mitochondrial branches per cell from Tom20 staining (11, 10, 20, 10 cells pooled from n = 3). Western blot quantifications normalized by each total protein (a, c). Cells seeded on a collagen I matrix (b, d, e, f, g). Dot plots (b, d, e, f, g) show median with interquartile range (each dot represents a single cell). p values were calculated using two-tailed tests (b, df). p value by unpaired t-test (b, d, e, f) and Kruskal–Wallis with Dunn’s multiple comparisons test (g). All n are indicative of independent experiments unless otherwise stated. Source data are provided as a Source Data file. See also Supplementary Fig. 6.
Fig. 6
Fig. 6. Mitochondrial fission control the cytoskeleton and invasion.
a Western blot (left) and quantification (right) of the indicated proteins after the indicated knock-downs in A375M2 cells (n = 4). be Cells seeded on a collagen I matrix after the indicated knock-downs. b (Left) Representative images of mitochondrial network (Tom20 (green), F-actin (red) and nucleus (Hoechst, blue)). Scale bar = 5 μm. (Right) Quantification of mitochondrial branches per cell from Tom20 staining (14, 10, 17, 13 cells pooled from n = 3). c pMLC2 staining for the indicated conditions, scale bar = 5 μm (n = 3). df After the indicated knock-downs, quantification of cell morphology (211, 231, 222, 169 cells pooled from n = 3) (d), quantification of pMLC2 immunofluorescence signal normalized by cell area (52, 53, 64, 71 cells pooled from n = 3) (e) and 3D invasion index into a collagen I matrix (n = 3) (f). Dot plot (b) shows median with interquartile range (each dot represents a single cell). Violin plot (d) shows median with interquartile range. Box plot (e) shows median (centre line), interquartile range (box) and min-max values (whiskers). Graphs (a, f) show mean ± SEM. p value by Kruskal–Wallis with Dunn’s multiple comparisons test (b, d, e) and one-way ANOVA with Dunnett’s correction (a, f). All n are indicative of independent experiments unless otherwise stated. Source data are provided as a Source Data file. See also Supplementary Fig. 7.
Fig. 7
Fig. 7. Mitochondrial fusion control the cytoskeleton and invasion.
a Mitochondrial fusion protein levels (n = 4). Quantifications normalized versus TUBULIN. b (Left) Mitochondrial network (Tom20 (green), F-actin (red) and nucleus (Hoechst, blue)) after MFN1/2 knock-down. Inset shows whole cell (Scramble) and bleb protrusion (siMFN1/2). Scale bar = 10 μm. (Right) Quantification of mitochondrial branches per cell from Tom20 staining (20, 31 cells pooled from n = 3). c Oxygen consumption rate (OCR) from cells in 3D collagen (n = 3). d Maximal intensity projection (left) and quantification (right) of ATP:ADP ratio in cells expressing PercevalHR biosensor, in a 3D collagen matrix (27, 32 cells pooled from n = 3). Scale bar = 5 μm. ej After MFN1/2 knock-down, pMLC2 immunofluorescence (n = 3), scale bar = 10 μm (e); quantification of cell morphology (383, 356 cells pooled from n = 3) (f), pMLC2 immunofluorescence signal normalized by cell area (116, 130 cells pooled from n = 3) (g), adhered cells after 1 h seeding on a collagen I matrix (n = 6) (h), 3D invasion index into a collagen I matrix (n = 6) (i) and representative traction stresses exerted by cells (n = 3) (j). Colour bar indicates traction stress magnitude (Pascal, Pa), scale bar = 20 μm. k, l Western blot and quantification after MFN1/2 knock-down and Comp C treatment (2 μM, 24 h) (n = 4). m Cells seeded on a collagen I matrix. pMLC2 (green) and F-actin (red) after MFN1/2 knock-down and Comp C treatment (2 μM, 24 h) (n = 3). Scale bar = 10 μm. n Cell morphology (299, 222, 276, 238 cells pooled from n = 3). o pMLC2 immunofluorescence signal normalized by cell area (82, 75, 86, 79 cells pooled from n = 3). Dot plot (b) shows median with interquartile range (each dot represents a single cell). Violin plots (f, n) show median with interquartile range. Box plots (d, g, o) show median (centre line), interquartile range (box) and min-max values (whiskers). Graphs (c, h, i, l) show mean ± SEM. p values calculated using two-tailed tests (bd, fi). p value by one sample t-test unpaired t-test, Mann-Whitney test (d, f, g), Paired t-test (c, h), one-way ANOVA with Dunnett’s correction (l) and Kruskal-Wallis test with Dunn’s multiple comparisons test (n, o). All n are indicative of independent experiments unless otherwise stated. Source data are provided as a Source Data file. See also Supplementary Fig. 7–8.
Fig. 8
Fig. 8. Adhesion, AMPK and mitochondrial dynamics in vivo and in primary melanoma tissues.
a, b Representative immunohistochemistry (IHC) images and quantification of DDR1, MFN2, OPA1, pAMPK and pMLC2 in subcutaneous tumours in mice from WM983A, WM983B, A375P or A375M2 cells (n = 8 mice/group). Scale bar = 100 μm. c, d Representative QuPath mark-up images and quantification of DDR1, MFN2, OPA1 and pAMPK expression and amoeboid score (calculated as indicated in methods) in matched tumour body (TB) and invasive front (IF) of primary tumours from human melanoma tissue microarrays (n = 46 tumours). Scale bar = 200 μm. e Representative IHC images showing DDR1, MFN2, OPA1 and pAMPK staining in elongated cells from TB and rounded cells from IF. Scale bar = 50 μm. Box plots (b, d) show median (centre line), interquartile range (box) and min-max values (whiskers). p values were calculated using two-tailed tests (b, d). p value by unpaired t-test (b) and Wilcoxon test (d). Source data are provided as a Source Data file. See also Supplementary Fig. 9.
Fig. 9
Fig. 9. Adhesion, AMPK and mitochondrial dynamics in metastasis.
a (Left) Confocal images of mouse lungs 24 h after tail vein injection of 5-chloromethylfluorescein diacetate (CMFDA)-Green labelled A375M2 pre-treated with Comp C (2 μM, 24 h) and (right) percentage of field area covered by cells (15 fields/mouse/condition, 5 mice/condition, n = 2 independent experiments). Scale bar = 100 μm. b Amoeboid score comparing tumour body (TB) and invasive front (IF) in melanoma primary tumours and metastasis, calculated as indicated in methods (primary tumours n = 46, metastasis n = 42). c, d Representative QuPath mark-up images and quantification of DDR1, MFN2, OPA1, pAMPK and pMLC2 expression in matched TB and IF of metastasis from human melanoma tissue microarrays (n = 45 patients). Scale bar = 200 μm. Dot plot (a) shows median with interquartile range (each dot represents a single mouse). Box plots (b, d) show median (centre line), interquartile range (box) and min-max values (whiskers). p values were calculated using two-tailed tests (a, d). p value by Mann-Whitney test (a), one-way ANOVA with Holm-Šídák’s multiple comparisons test (b) and Wilcoxon test (d). Source data are provided as a Source Data file. See also Supplementary Fig. 9.
Fig. 10
Fig. 10. AMPK is a mechano-metabolic sensor linking cell adhesion and mitochondrial dynamics to Myosin II dependent cell migration.
Highly invasive but weakly adhesive rounded-amoeboid cancer cells harbour high levels of cortical Myosin II activity and exert low magnitude traction forces into extracellular matrix (ECM). Low adhesion to the matrix results in decreased engagement in mitochondrial metabolism and alterations in ATP and AMP intracellular levels that lead to AMP-activated protein kinase (AMPK) activation. Once AMPK is active, it directly phosphorylates the crucial regulator of cytoskeletal dynamics Myosin phosphatase (Myosin phosphatase target subunit 1, MYPT1) in the key residue for its inactivation, leading to increased Myosin Light Chain phosphorylation and increased overall Myosin II activity. At the same time, AMPK induces mitochondrial fission through the phosphorylation of Mitochondrial Fission Factor (MFF), which sustains the imbalance in energy levels, further boosting AMPK signalling and Myosin II activation. In contrast, highly adhesive elongated-mesenchymal cells present highly fused and active mitochondria. This provides energy for mesenchymal cancer cells to exert strong adhesive traction stress, while it maintains lower levels of AMPK signalling, resulting in moderate Myosin II activity. Strong adhesions in elongated-mesenchymal cells rely on Discoidin Domain Receptor 1 (DDR1) collagen receptor. Reducing DDR1-dependent adhesion, inhibiting mitochondrial fusion or inducing AMPK activity in elongated-mesenchymal cells promotes the transition to rounded-amoeboid efficient migration/invasion and all its cytoskeletal/mitochondrial features. (Created with BioRender.com).

References

    1. Sanz-Moreno V, et al. Rac activation and inactivation control plasticity of tumor cell movement. Cell. 2008;135:510–523. doi: 10.1016/j.cell.2008.09.043. - DOI - PubMed
    1. Tozluoglu M, et al. Matrix geometry determines optimal cancer cell migration strategy and modulates response to interventions. Nat. Cell Biol. 2013;15:751–762. doi: 10.1038/ncb2775. - DOI - PubMed
    1. Herraiz C, et al. Reactivation of p53 by a Cytoskeletal Sensor to Control the Balance Between DNA Damage and Tumor Dissemination. J. Natl. Cancer Inst. 2016;108:djv289. doi: 10.1093/jnci/djv289. - DOI - PMC - PubMed
    1. Sanz-Moreno V, et al. ROCK and JAK1 signaling cooperate to control actomyosin contractility in tumor cells and stroma. Cancer Cell. 2011;20:229–245. doi: 10.1016/j.ccr.2011.06.018. - DOI - PubMed
    1. Wolf K, et al. Compensation mechanism in tumor cell migration: mesenchymal-amoeboid transition after blocking of pericellular proteolysis. J. Cell Biol. 2003;160:267–277. doi: 10.1083/jcb.200209006. - DOI - PMC - PubMed

Publication types