. 2023 May 22;14(1):2922.
doi: 10.1038/s41467-023-38528-z.

Base editing-mediated one-step inactivation of the Dnmt gene family reveals critical roles of DNA methylation during mouse gastrulation

Affiliations

Base editing-mediated one-step inactivation of the Dnmt gene family reveals critical roles of DNA methylation during mouse gastrulation

Qing Li et al. Nat Commun. .

Abstract

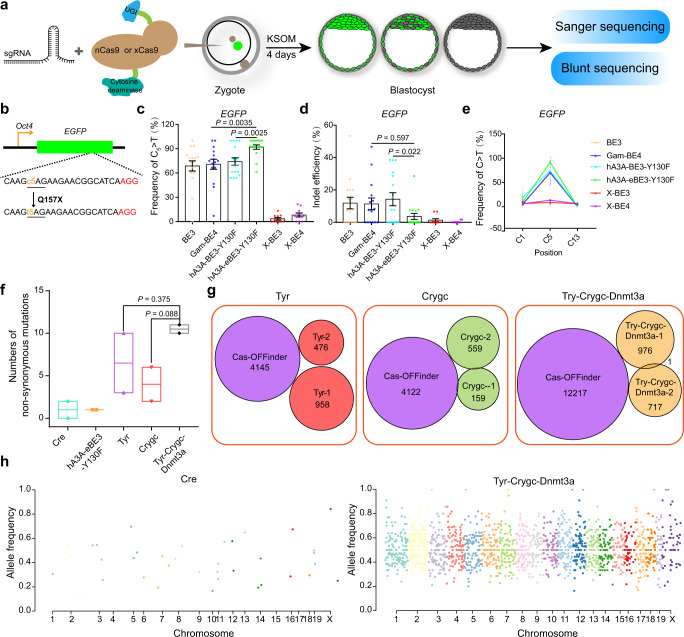
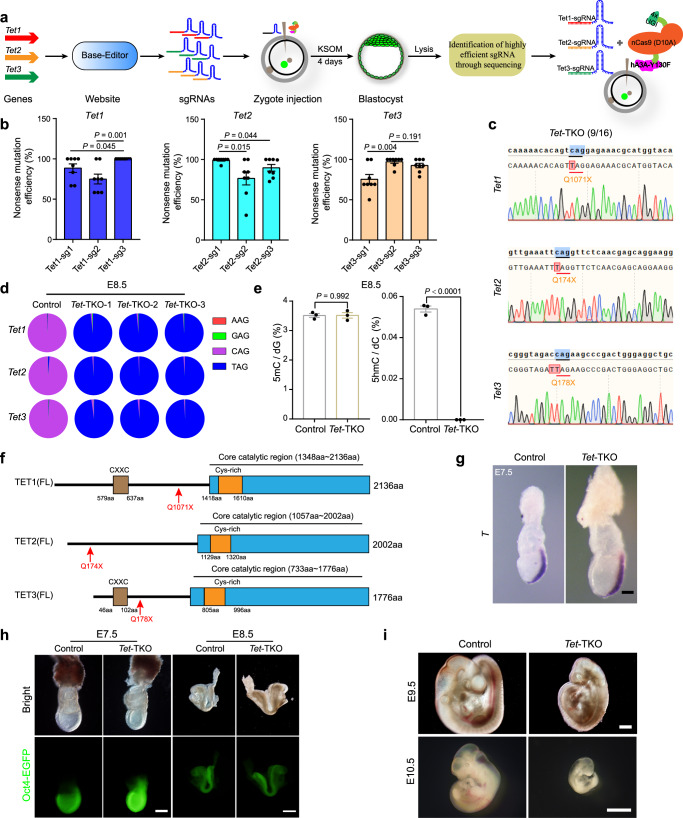
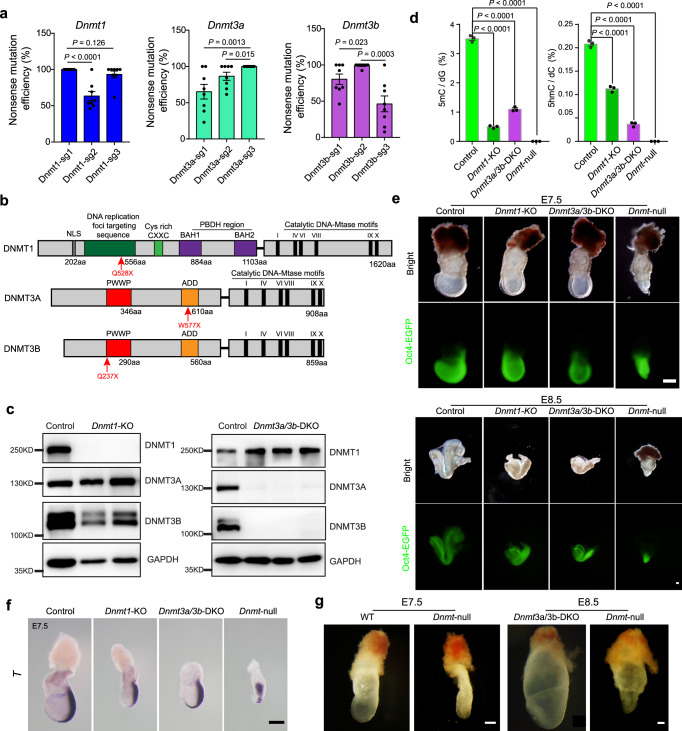
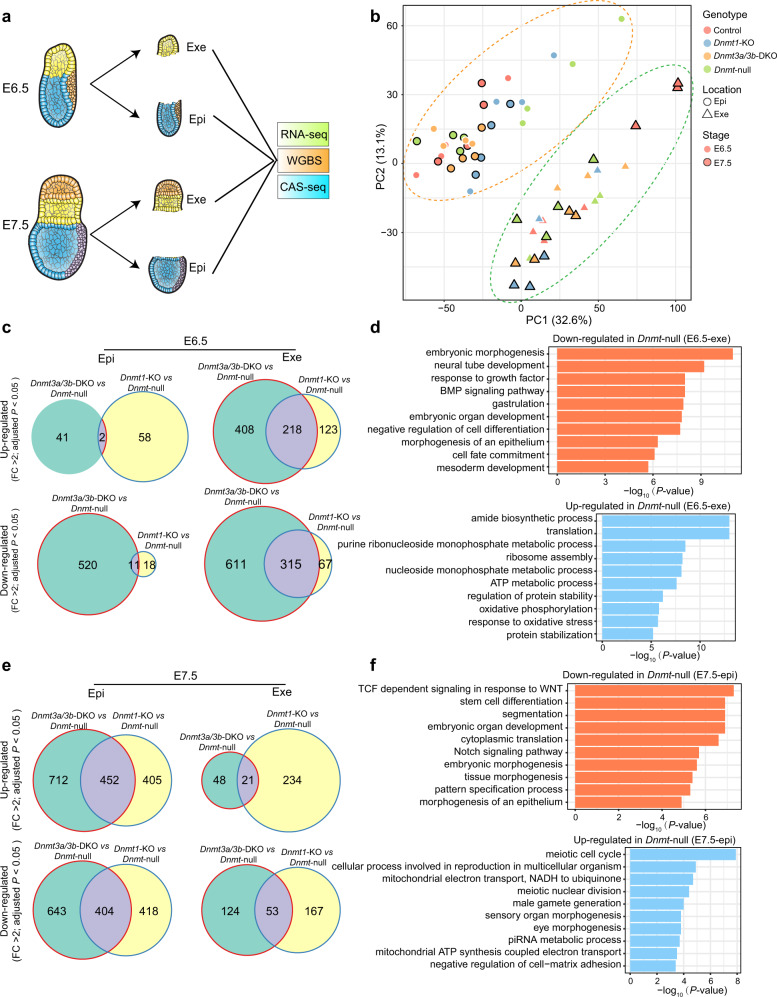
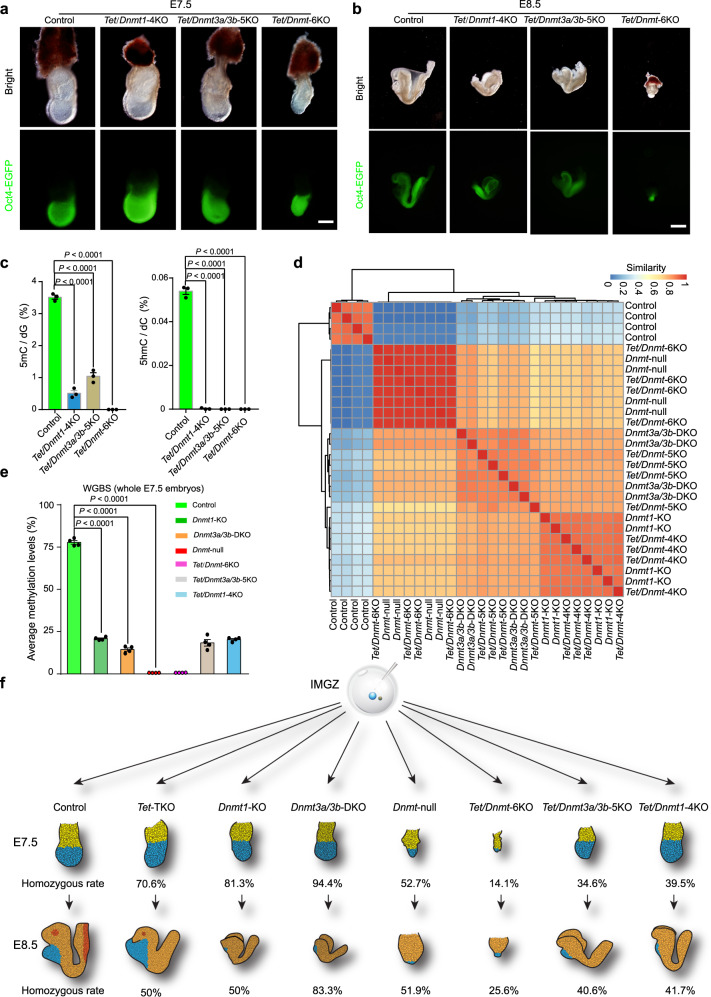
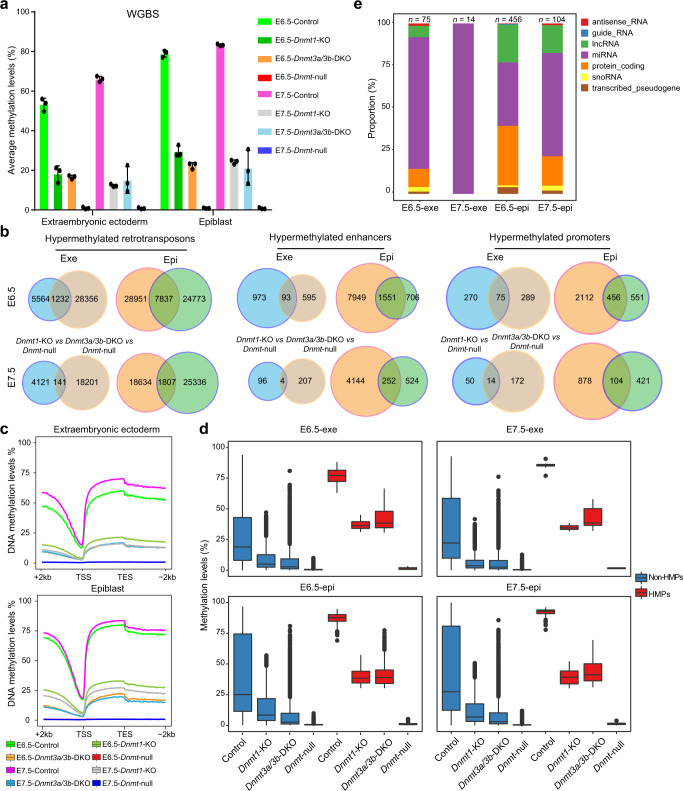
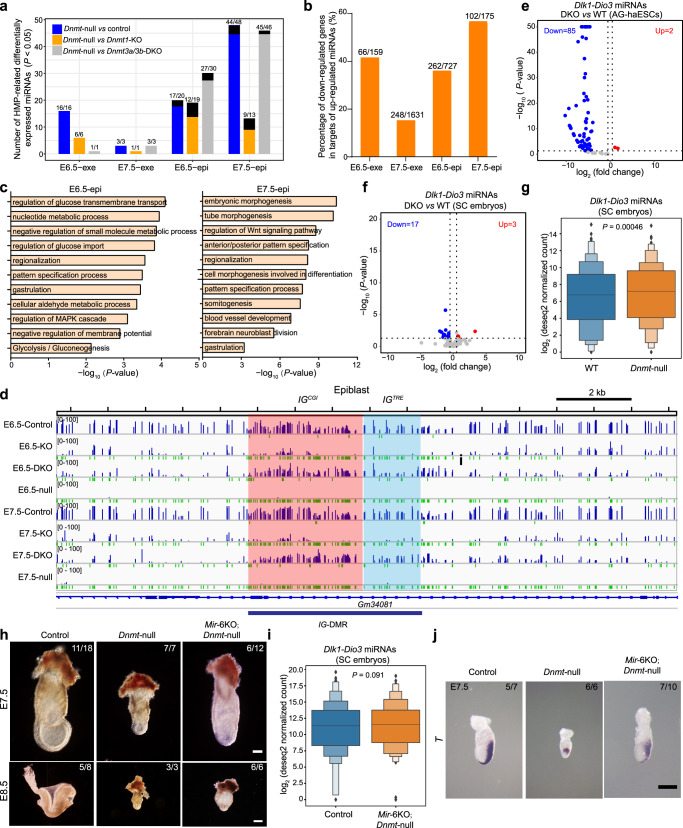
During embryo development, DNA methylation is established by DNMT3A/3B and subsequently maintained by DNMT1. While much research has been done in this field, the functional significance of DNA methylation in embryogenesis remains unknown. Here, we establish a system of simultaneous inactivation of multiple endogenous genes in zygotes through screening for base editors that can efficiently introduce a stop codon. Embryos with mutations in Dnmts and/or Tets can be generated in one step with IMGZ. Dnmt-null embryos display gastrulation failure at E7.5. Interestingly, although DNA methylation is absent, gastrulation-related pathways are down-regulated in Dnmt-null embryos. Moreover, DNMT1, DNMT3A, and DNMT3B are critical for gastrulation, and their functions are independent of TET proteins. Hypermethylation can be sustained by either DNMT1 or DNMT3A/3B at some promoters, which are related to the suppression of miRNAs. The introduction of a single mutant allele of six miRNAs and paternal IG-DMR partially restores primitive streak elongation in Dnmt-null embryos. Thus, our results unveil an epigenetic correlation between promoter methylation and suppression of miRNA expression for gastrulation and demonstrate that IMGZ can accelerate deciphering the functions of multiple genes in vivo.


Conflict of interest statement

The authors declare no competing interests.

Figures

Fig. 1
Fig. 1. Screening for a highly efficient base editor and analyzing its off-target effects.
a Schematic diagram of screening for highly efficient base editors that induce homozygous stop codons in early embryos through direct injection into zygotes. KSOM, embryo culture medium. b The target sequence in EGFP. The PAM sequence and the intended mutant bases are shown in red and yellow, respectively. c, d, e Statistical analysis of on-target C-to-T base conversion (c), indels (d) and adjacent site mutation (e) induced by BE3, Gam-BE4, hA3A-BE3-Y130F, hA3A-eBE3-Y130F, X-BE3, and X-BE4 in EGFP. Data are mean ± s.e.m for the indicated numbers of blastocysts. Detailed data are shown in Supplementary Data 1. P values were determined by Student’s unpaired two-sided t-test. f Number of nonsynonymous mutations detected in E11.5 embryos from five groups. Floating bars show minima to maxima from two biological replicates. P values were determined by Student’s unpaired two-sided t-test; Lists of nonsynonymous off-target mutations are presented in Supplementary Data 2. g Analysis of SNVs detected in two E11.5 embryos with mutant Tyr, Crygc, or/and Dnmt3a by GOIT and off-targets predicted by Cas-OFFinder based on Tyr-sgRNA, Crygc-sgRNA, and Dnmt3a-sg3, indicating no overlapped sites caused by hA3A-eBE3-Y130F. The numbers present the predicted off-target sites or detected SNVs. h The Manhattan plot shows the distribution of all off-target mutations of different groups (Cre and Try-Crygc-Dnmt3a) in the genome. The abscissa is the location of the mutations on the chromosome, and the ordinate is the frequency of each mutation. Each point presents a mutation (SNV or indel), and the different colors indicate different chromosomes. Source data are provided as a Source Data file.
Fig. 2
Fig. 2. Establishment of the IMGZ system.
a Schematic diagram of the IMGZ system for inactivation of multiple genes in one step in embryos. b The editing efficiency of on-target C-to-T base conversion induced by different sgRNAs in Tet1, Tet2, and Tet3. Detailed data are presented in Supplementary Data 4. Data are mean ± s.e.m for the indicated numbers of blastocysts. P values were determined by Student’s unpaired two-sided t-test. c Representative Sanger sequence chromatograms of one Tet1/2/3-TKO blastocyst. 9 of 16 checked blastocysts show homozygous mutant chromatograms. d Deep sequencing analysis of genome mutant sites of one control and three Tet1/2/3-TKO embryos (E8.5). The results indicated the conversion of CAG codon of Tet1/2/3 into TAG stop codon in resultant embryos. e Frequencies of 5mC and 5hmC modified nucleotides in the genomic DNA of control and Tet1/2/3-TKO embryos (E8.5) were determined by quantitative mass spectrometry. Data are mean ± s.e.m of three biological replicates. P values were determined by Student’s unpaired two-sided t-test. f Domain structure of full‑length TET1, TET2, and TET3 proteins. The red arrows indicate amino acid mutation sites produced by the sgRNAs with the highest base conversion efficiency. g RNA in situ hybridization of T (also known as brachyury, a primitive streak marker) in the control and Tet-TKO embryos (E7.5). Three independent embryos were analyzed for each group. Scale bar, 100 μm. h Representative images of IMGZ-derived control and Tet-TKO embryos at E7.5 and E8.5. Green fluorescence indicates the expression of Oct4-EGFP. Three independent embryos were analyzed for each group. Scale bar, 200 μm in the left panel and 500 μm in the right panel. i Representative images of control and Tet-TKO embryos at E9.5 and E10.5 generated by the IMGZ system. Green fluorescence indicates the expression of Oct4-EGFP. Three independent embryos were analyzed for each group. Scale bars, 500 μm in the up panel and 2 mm in the down panel. Source data are provided as a Source Data file.
Fig. 3
Fig. 3. One-step inactivation of Dnmt1/3a/3b mediated by IMGZ reveals critical roles of DNA methylation in mouse gastrulation.
a The editing efficiencies of on-target C-to-T base conversion induced by different sgRNAs in Dnmt1, Dnmt3a, and Dnmt3b. Detailed data are presented in Supplementary Data 4. Data are mean ± s.e.m for the indicated numbers of blastocysts. P values were determined by Student’s unpaired two-sided t-test. b Domain structure of full‑length DNMT1, DNMT3A, and DNMT3B proteins. The red arrows indicate the amino acid mutation site produced by the sgRNAs with the highest base conversion efficiency. c Expression of DNMT1, DNMT3A, and DNMT3B in Dnmt1-KO and Dnmt3a/3b-DKO embryos. GAPDH is the control. Proteins were obtained from E9.5 embryo lysis. Two control, two Dnmt1-KO, and three Dnmt3a/3b-DKO embryos were analyzed. d Frequencies of 5mC and 5hmC modified nucleotides in the genomic DNA of control, Dnmt1-KO, Dnmt3a/3b-DKO, and Dnmt-null embryos (E8.5) were determined by quantitative mass spectrometry. Data are mean ± s.e.m of three biological replicates. P-values were determined by Student’s unpaired two-sided t-test. e Representative images of IMGZ-derived control, Dnmt1-KO, Dnmt3a/3b-DKO, and Dnmt-null embryos at E7.5 and E8.5, showing developmental retardation at E7.5 in Dnmt-null embryos. Green fluorescence indicates the expression of Oct4-EGFP. Three independent embryos were analyzed for each group. Scale bars, 200 μm. f RNA in situ hybridization of T in the control, Dnmt1-KO, Dnmt3a/3b-DKO, and Dnmt-null embryos (E7.5), showing primitive streak elongation failure in Dnmt-null embryos. Three independent embryos were analyzed for each group. Scale bar, 100 μm. g Representative images of E7.5 and E8.5 Dnmt-null embryos obtained through crossing germline-specific conditional knockout parents. Scale bars, 200 μm. Three independent embryos were analyzed for each group. Source data are provided as a Source Data file.
Fig. 4
Fig. 4. Transcriptome analysis of Dnmt mutant embryos.
a Schematic diagram of collecting Exe and Epi at E6.5 or E7.5 for RNA sequencing (RNA-seq), whole genome bisulfite sequencing (WGBS), and Cas9-assisted small RNA-sequencing (CAS-seq). Exe, extraembryonic ectoderm; Epi, epiblast. b Principal component analysis (PCA) of RNA-seq data from E6.5 and E7.5 embryos with different mutations. c Venn diagrams show up-regulated and down-regulated differentially expressed genes (DEGs) in Dnmt1-KO and Dnmt3a/3b-DKO compared to Dnmt-null of Exe and Epi at E6.5. P-values were calculated by Deseq2. d Enriched Gene Ontology terms of overlapped down-regulated (up) and up-regulated (down) DEGs (Dnmt-null vs Dnmt1-KO and Dnmt-null vs Dnmt3a/3b-DKO) in E6.5 Dnmt-null Exe related to (c). P values were calculated by Metascape. e Venn diagrams show up-regulated and down-regulated DEGs in Dnmt1-KO and Dnmt3a/3b-DKO compared to Dnmt-null of Exe and Epi at E7.5. P values were calculated by Deseq2. f Enriched Gene Ontology terms of overlapped down-regulated (up) and up-regulated (down) DEGs (Dnmt-null vs Dnmt1-KO and Dnmt-null vs Dnmt3a/3b-DKO) in E7.5 Dnmt-null Epi related to (e). P values were calculated by Metascape. Source data are provided as a Source Data file.
Fig. 5
Fig. 5. DNA methylation is involved in gastrulation independent of DNA demethylation.
a, b Representative images of IMGZ-derived E7.5 (a) and E8.5 (b) embryos carrying Tet1/2/3;Dnmt1−4KO, Tet1/2/3;Dnmt3a/3b−5KO, or Tet1/2/3;Dnmt1/3a/3b−6KO. Green fluorescence indicates the expression of Oct4-EGFP. Three independent embryos were analyzed for each group. Scale bars, 200 μm in (a) and 500 μm in (b). c Frequencies of 5mC and 5hmC modified nucleotides in the genomic DNA of control, Tet1/2/3;Dnmt1−4KO, Tet1/2/3;Dnmt3a/3b−5KO, and Tet1/2/3;Dnmt1/3a/3b−6KO embryos (E8.5) were determined by quantitative mass spectrometry. Data are mean ± s.e.m of three biological replicates. P-values were determined by Student’s unpaired two-sided t-test. d Heatmap shows the similarity of WGBS data between different mutant embryos. The similarity between samples was defined as min-max normalized Euclidean distance reduced by 1. e Bar plots represent the average CG methylation level of whole embryos (E7.5) with different mutations measured by WGBS. Data are mean ± s.e.m of four biological replicates. P-values were determined by Student’s unpaired two-sided t-test. f Summary of phenotypes observed in E7.5 and E8.5 embryos carrying different mutant Dnmt and Tet genes generated by IMGZ. Detailed data of homozygous mutants are presented in Supplementary Data 6. Source data are provided as a Source Data file.
Fig. 6
Fig. 6. Overlapped hypermethylated promoters mediated by DNMT1 and/or DNMT3A/3B are related to embryo gastrulation.
a Bar plots represent the average CG methylation level of Exe and Epi measured by WGBS in four groups (control, Dnmt1-KO, Dnmt3a/3b-DKO, and Dnmt-null embryos). Data are mean ± s.e.m of three biological replicates. b Venn diagrams show overlapped hypermethylated retrotransposons, enhancers, and promoters between Dnmt1-KO vs Dnmt-null and Dnmt3a/3b-DKO vs Dnmt-null in Exe and Epi of E6.5 and E7.5. c Average DNA methylation levels in the gene body and an additional 2kb flanking regions in four genotypes of Exe and Epi at E6.5 and E7.5. TSS, transcription start site; TES, transcription end site. d Box plots show promoter methylation levels of overlapped hypermethylated promoters (HMPs) and non-HMPs in embryos with different mutants. HMPs are overlapped HMPs shown in (b); Non-HMPs are other promoters besides the HMPs. The central lines are the median of data. The lower and upper hinges correspond to the 25th and 75th percentiles. The end of the lower and upper whiskers are 1.5 * IQR (inter-quartile range). Data beyond the end of the whiskers are plotted as outliers. e Bar plots show the composition of genes related to overlapped HMPs in Exe and Epi at E6.5 and E7.5 shown in (b). n, the number of overlapped HMPs. Source data are provided as a Source Data file.
Fig. 7
Fig. 7. Suppression of miRNA expression mediated by DNA methylation fine-tunes gastrulation.
a Bar plots show the numbers of differently expressed miRNAs related to overlapped HMPs. Numerators/denominators: numbers of significantly up-regulated miRNAs/total numbers of significantly differentiated expressed miRNAs. Black bars mean significantly down-regulated miRNAs. b Bar plots show percentages of overlapped genes between downregulated genes revealed by RNA-seq and predicted target genes of the upregulated miRNAs shown in (a) in Dnmt-null embryos. The top 50% high-confident targets of these miRNAs were chosen. Numerators/denominators: numbers of overlapped down-regulated genes/total numbers of downregulated genes shown in Supplementary Fig. 15a. c Enriched Gene Ontology terms of overlapped downregulated genes in E6.5-epi and E7.5-epi related to (b). P values were calculated by Metascape. d Representative genome browser snapshots of methylation profiles. The IG-DMR was divided into IGCGI (red-shaded box) and IGTRE (blue-shaded box). Resolution, 5kb. e Volcano plot shows the differently expressed Dlk1-Dio3 miRNAs of DKO-AG-haESCs compared to WT-AG-haESCs. f Volcano plot shows the differently expressed Dlk1-Dio3 miRNAs of SC embryos (E6.5 epiblast) from DKO-AG-haESCs compared to WT SC embryos. g Boxplot shows the expression of Dlk1-Dio3 miRNAs between WT SC embryos and Dnmt-null SC embryos (E6.5 epiblast) produced by IMGZ. P values were determined by Student’s two-sided paired t-test. h Representative images of E7.5 and E8.5 SC embryos carrying Dnmt-null. Control SC embryos were derived from DKO-AG-haESCs. Dnmt-null SC embryos were derived by inactivation of Dnmt1/3a/3b in SC embryos through IMGZ. Mir−6KO;Dnmt-null SC embryos were generated by injection of DKO-AG-haESCs carrying six miRNA deletions into oocytes, followed by inactivation of Dnmt1/3a/3b by IMGZ. Scale bars, 100 μm in up panels, 200 μm in down panels. i Boxplot shows the expression of Dlk1-Dio3 miRNAs between control SC embryos from DKO-AG-haESCs and SC embryos from Mir−6KO carrying Dnmt-null. P-values were determined by Student’s two-sided paired t-test. j Representative images of RNA in situ hybridization of T probe in E7.5 SC embryos with different mutations. Scale bar, 200 µm. Numerators/denominators in h and j: numbers of SC embryos sustaining the phenotype shown in the image/total numbers of observed embryos. Source data are provided as a Source Data file.

References

    1. Greenberg MVC, Bourc’his D. The diverse roles of DNA methylation in mammalian development and disease. Nat. Rev. Mol. cell Biol. 2019;20:590–607. doi: 10.1038/s41580-019-0159-6. - DOI - PubMed
    1. Smith ZD, Meissner A. DNA methylation: roles in mammalian development. Nat. Rev. Genet. 2013;14:204–220. doi: 10.1038/nrg3354. - DOI - PubMed
    1. Hackett JA, Surani MA. DNA methylation dynamics during the mammalian life cycle. Philos. Trans. R. Soc. Lond. B Biol. Sci. 2013;368:20110328. doi: 10.1098/rstb.2011.0328. - DOI - PMC - PubMed
    1. Xu G-L, Wong J. Oxidative DNA demethylation mediated by Tet enzymes. Natl Sci. Rev. 2015;2:318–328. doi: 10.1093/nsr/nwv029. - DOI
    1. Kohli RM, Zhang Y. TET enzymes, TDG and the dynamics of DNA demethylation. Nature. 2013;502:472–479. doi: 10.1038/nature12750. - DOI - PMC - PubMed

Publication types

MeSH terms