. 2023 May 22;9(1):10.
doi: 10.1038/s41514-023-00109-1.

Senotherapeutic peptide treatment reduces biological age and senescence burden in human skin models

Affiliations

Senotherapeutic peptide treatment reduces biological age and senescence burden in human skin models

Alessandra Zonari et al. NPJ Aging. .

Erratum in

Abstract

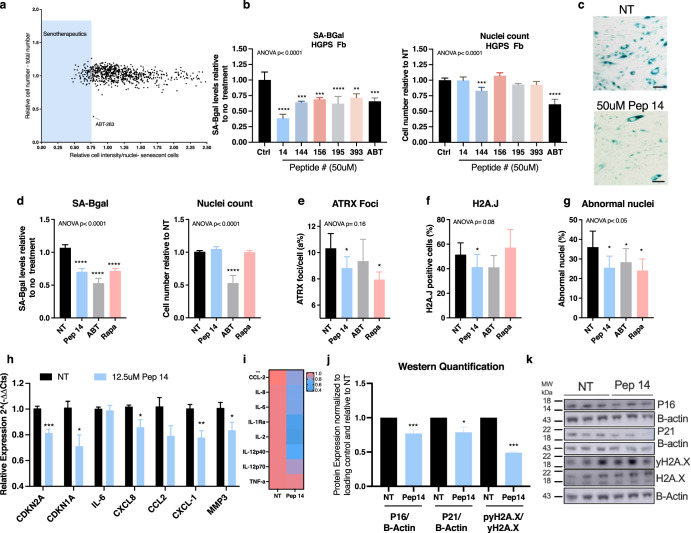
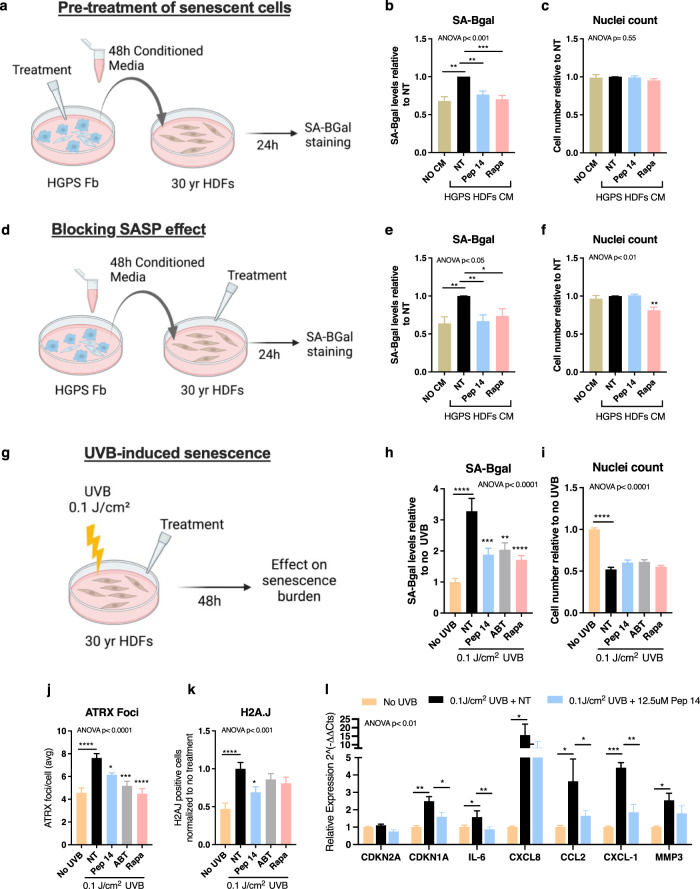
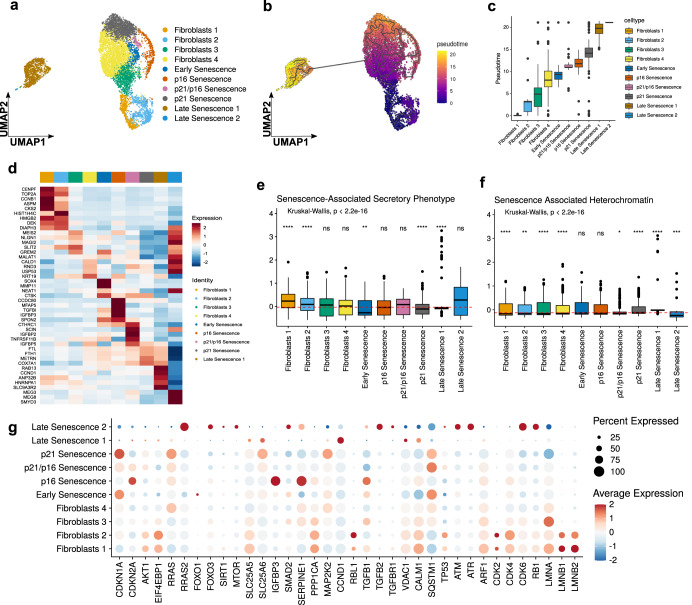
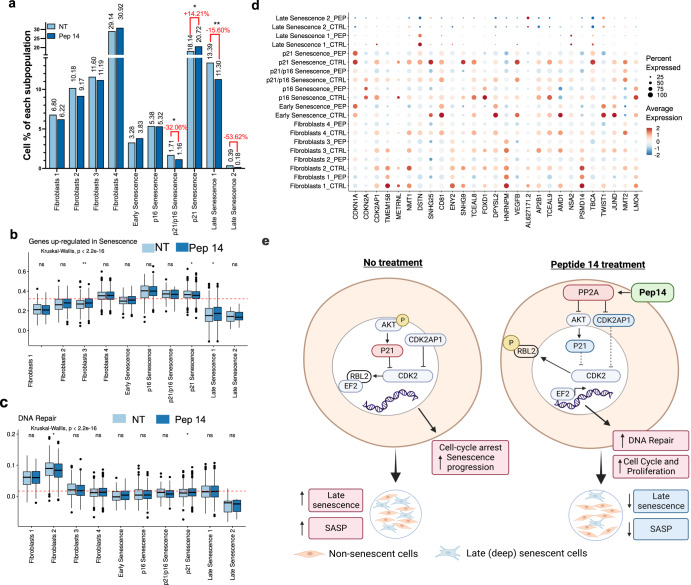
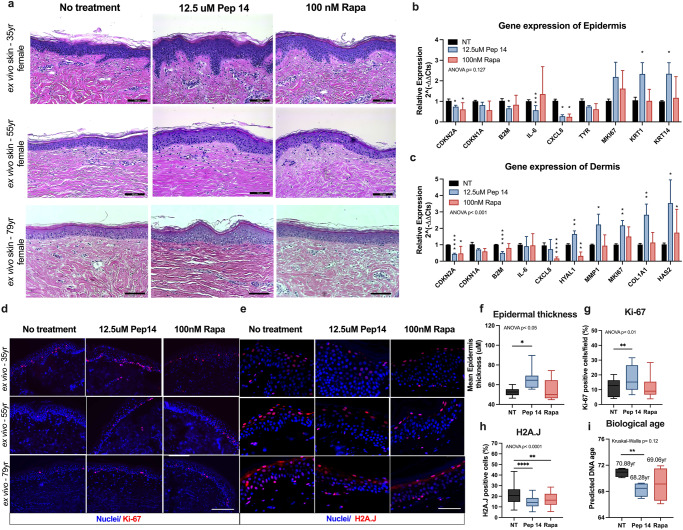
Cellular senescence is known to play a role in age-related skin function deterioration which potentially influences longevity. Here, a two-step phenotypic screening was performed to identify senotherapeutic peptides, leading to the identification of Peptide (Pep) 14. Pep 14 effectively decreased human dermal fibroblast senescence burden induced by Hutchinson-Gilford Progeria Syndrome (HGPS), chronological aging, ultraviolet-B radiation (UVB), and etoposide treatment, without inducing significant toxicity. Pep 14 functions via modulation of PP2A, an understudied holoenzyme that promotes genomic stability and is involved in DNA repair and senescence pathways. At the single-cell level, Pep 14 modulates genes that prevent senescence progression by arresting the cell cycle and enhancing DNA repair, which consequently reduce the number of cells progressing to late senescence. When applied on aged ex vivo skin, Pep 14 promoted a healthy skin phenotype with structural and molecular resemblance to young ex vivo skin, decreased the expression of senescence markers, including SASP, and reduced the DNA methylation age. In summary, this work shows the safe reduction of the biological age of ex vivo human skins by a senomorphic peptide.


Conflict of interest statement

M.B., A.Z., C.R., L.B., E.A., MGu, W.P., O.F. and J.C. are named as inventors of a patent directed at this invention, which is solely owned by OneSkin, Inc. M.B., A.Z., C.R., E.A. and J.C. are co-founders of OneSkin Inc. The remaining authors declare no competing interests.

Figures

Fig. 1
Fig. 1. Screening of a peptide library identifies Pep 14 as a new senotherapeutic compound.
a Screening of the 764-peptide leads according to the senotherapeutic potential. Peptides that reduced the number of senescent HDFs isolated from an HGPS donor by more than 25% after 48 h treatment were considered senotherapeutics and highlighted in the blue shaded area. b Relative cellular senescence level and total cell number of HGPS HDFs treated for 48 hours with 50 μM of the top 5 peptides screened in a, and 5 μM ABT. c Representative SA-BGal stained image of HGPS HDFs treated with 50 μM Pep 14 compared to untreated controls. Scale bar 50 μm. d Relative cellular senescence and relative total cell number, e mean ATRX foci/cell, f mean percentage of H2A.J positive cells, and g mean percentage of abnormal nuclei of HGPS HDFs treated with 12.5 μM of Pep14, 5 μM ABT and 100 nM Rapamycin for 48 h. h mRNA expression of HGPS fibroblasts treated with 12.5 μM Pep 14 for 48 h. i ELISA quantification of SASP components produced by HGPS fibroblasts treated with 12.5 μM Pep 14 for 48 h. j Protein expression analysis of P16, P21, and γH2A.x/H2A.x in HGPS fibroblasts treated with 12.5 μM Pep 14 for 48 h. k Representative Western Blot analysis of P16, P21 and γH2A.x/H2A.x protein expression. Data are shown as mean ± SD and are representative of 3–4 independent experiments in triplicate and were analyzed using one-way ANOVA and multiple comparisons or Student’s t test two-tailed. *p < 0.05; **p < 0.01; ***p < 0.001; ****p < 0.0001, compared to untreated controls (NT).
Fig. 2
Fig. 2. Pep 14 protects cells from different cellular senescence inducers.
a HDFs isolated from HGPS patients were treated with either 12.5 μM Pep 14 or 100 nM Rapamycin for 48 h. Then the CM was collected and used to treat HDFs isolated from a 30 yr healthy donor for 24 h. Relative cellular senescence (b) and relative total cell number (c) of samples processed as described in a. d Alternatively, HDFs isolated from HGPS patients had CM collected and used to treat HDFs isolated from a 30 yr healthy donor for 24 h in combination with either 12.5 μM Pep 14 or 100 nM Rapa treatment. Relative cellular senescence (e) and relative total cell number (f) of samples processed as described in d. g HDFs isolated from a 30 yr healthy donor were exposed to 0.1 J/cm2 of UVB radiation and treated for 48 h with 12.5 μM Pep 14, 5 μM ABT and 100 nM Rapamycin. h Relative cellular senescence, i relative total cell number, j mean ATRX foci/cell, and k mean percentage of H2A.J positive cells of HDFs after 48 h treatment. l mRNA expression of HDFs without treatment, exposed to 0.1 J/cm2 UVB and exposed to UVB followed by treatment with 12.5 μM Pep 14. Data were normalized to the mRNA expression of untreated HDFs not exposed to UVB. Data are shown as mean ± SD and are representative of ≥3 independent experiments in triplicate. *p < 0.05; **p < 0.01; ***p < 0.001; ****p < 0.0001, compared to untreated control, according to one-way ANOVA and multiple comparisons. Schemes created with Biorender.com.
Fig. 3
Fig. 3. Pep 14 acts as a senotherapeutic agent by regulating aging-related pathways.
a Heat maps showing the expression pattern of top 20 genes modulated by Pep 14 treatment (12.5 μM) in healthy and HGPS HDFs. Samples were hierarchically clustered using distance as 1 − Pearson correlation coefficient. b Heat maps of HDFs samples derived from HGPS patient and healthy donors sorted according to the donor’s age. Color codes in all heat maps represent RNA-seq normalized pseudocounts in log2 scale after row-wise z-score transformation. c Protein-protein interaction (PPI) map of genes modulated by Pep 14. Network interaction was built based on the String database. Size of genes represent the number of connections and color their LFC (blue and red for genes down- and up-regulated, respectively). d qRT-PCR analysis of some of the top 20 genes modulated by 12.5 μM Pep 14 treatment in HDFs obtained from HGPS. Protein expression analysis of PP2A subunit A (e) and pAkt/Akt (f) in HGPS HDFs treated with 12.5 μM Pep 14 for 48 h. Relative cellular senescence (g) and relative total cell number (h) of HGPS HDFs treated with 12.5 μM of Pep 14, 7.5 μM DT-061, 7.5 nM OA and 100 nM Rapamycin for 48 h. mRNA expression of CDKN1A (i), IL-6 (j), and CXCL-1 (k) of HGPS HDFs treated with 12.5 μM of Pep 14, 7.5 μM DT-061, 7.5 nM OA and 100 nM Rapamycin for 48 h. qRT-PCR analysis of PPP2R1A (l) and PPP2R5C (m) in HDFs transfected with scramble (scr) or PP2A siRNA, treated or not with 12.5 μM of Pep 14 for 48 h. Relative cellular senescence (n) and relative total cell number (o) of control (scr) or PP2A siRNA-transfected HDFs, treated or not with Pep 14. qRT-PCR analysis of CDKN1A (p), IL-6 (q), CXCL1 (r), CXCL-8 (s), and CCL-2 (t) in HDFs transfected with control (scr) or PP2A siRNA, treated or not with Pep 14. Data are shown as mean ± SD and are representative of 3 independent experiments. Ns: p > 0.05, *p < 0.05; **p < 0.01, ***p < 0.001, ****p < 0.0001, compared to untreated control, according to one-way ANOVA and multiple comparisons or Student’s t test two-tailed.
Fig. 4
Fig. 4. Characterization of HGPS fibroblasts at the single cell level.
HGPS fibroblasts were processed for single-cell RNA-Seq. a Uniform manifold approximation and projection (UMAP) plot depicting the cell subpopulations identified in the HGPS dermal fibroblasts. The cell subpopulations were named non-senescent Fibroblasts 1–4, Early senescence, P16 senescence, P21 senescence, P21/P16 senescence, late senescence 1, and late senescence 2. b Pseudo-time analysis showed the progression of non-senescent fibroblasts to late senescence cells. c Pseudotime score for cells grouped by cluster, showing the progression of non-senescent fibroblasts 1–4 to late senescence cells. d Heat map showing gene expression markers of HGPS fibroblast subpopulations. Expression levels are depicted in the color code from blue to red. Box plots showing the score based on (e) senescence-associated secretory phenotype gene expression levels in each subpopulation and (f) senescence-associated heterochromatin gene expression levels in each subpopulation. Dashed lines in red represent the average score. Box indicates the range from 25th to 75th percentile, with whiskers extending to 1.5 times the interquartile range. Outliers are plotted separately, center indicates the median value. g Senescence-related gene expression levels in each cluster. For statistical significance, we performed the Kruskall–Wallis test followed by Wilcoxon to compare each of the ten groups against “all” (i.e. base-mean). Ns non-significant. *p < 0.05; **p < 0.01; ***p < 0.001; ****p < 0.0001.
Fig. 5
Fig. 5. Peptide 14 treatment prevents late senescence cell accumulation.
Peptide 14 and untreated HGPS fibroblasts were processed for sc-RNASeq. a Frequency of each HGPS cell subpopulation before and after peptide treatment. Differences in frequency were compared using Chi-square test, *p < 0.05; **p < 0.01. Data is shown as mean ± SD. Boxplots showing scores based on (b) senescence-related and (c) DNA repair-related genes. Dashed lines in red represent the average score. Box indicates the range from 25th to 75th percentile, with whiskers extending to 1.5 times the interquartile range. Outliers are plotted separately, center indicates the median value. Differences between peptide treatment and control were compared using the Wilcoxon test, *p < 0.05; **p < 0.01. d Expression levels of the genes that were significantly differentially modulated by Pep 14 treatment, in each cluster. e Proposed model for how Pep 14 reduces senescence burden. In the absence of the peptide, CDK2 is inhibited by CDK2AP1 and phosphorylated AKT, favoring the interaction of RBL2 and the transcription factor EF2. Upon Pep 14 treatment, PP2A complex is stabilized, favoring the reduction of CDK2AP1 expression and AKT phosphorylation, leading to CDK2 activation and further phosphorylation of RBL2, liberating EF2 to exert its transcription factor function. Scheme created with BioRender.com.
Fig. 6
Fig. 6. Pep 14 reduces skin biological age.
a Representative Hematoxylin and Eosin staining of histological sections of ex vivo skin samples from 35, 55, and 79 yr donors maintained in basal media (no treatment) or treated with 12.5 μM Pep 14 and 100 nM Rapamycin (Rapa), added in the tissue culture media for 5 days, scale bar 100 μm. mRNA expression of epidermal (b) and dermal (c) layers of samples (35, 55 and 79 yr) treated for 5 days. Fluorescence microscopy images (d) and quantification (g) of ex vivo skin (35, 55, and 79 yr), 5 days after treatment, stained for Ki-67. Fluorescence microscopy images (e) and quantification (h) of ex vivo skin (35, 55, and 79 yr), 5 days after treatment, stained for H2A.J. Scale bar corresponds to 100 µm. f Epidermal thickness analysis of ex vivo skin samples (35, 55 and 79 yr) after 5 days of treatment. i DNA methylation age calculated using the Skin-Specific DNA Methylation Clock (MolClock) of ex vivo skin samples (79 yr, female) maintained in basal media (NT), or treated with 12.5 μM Pep 14 or 100 nM Rapamycin (Rapa), added in the media for 5 days. Graph bar data are shown as mean ± SD. Boxplot data are shown as median (center line) and quartiles (1st and 3rd) and the minimum and maximum by the whiskers. Data are representative of 3 independent experiments in triplicate. *p < 0.05; **p < 0.01; ***p < 0.001; ****p < 0.0001, compared to untreated control (NT), according to one-way ANOVA and multiple comparisons or Student’s t test two-tailed. For graph i, one experiment was performed with 4 biological replicates, statistical analysis was done using Kruskal–Wallis and Wilcoxon test.

References

    1. López-Otín C, Blasco MA, Partridge L, Serrano M, Kroemer G. The hallmarks of aging. Cell. 2013;153:1194–1217. doi: 10.1016/j.cell.2013.05.039. - DOI - PMC - PubMed
    1. Toutfaire M, Bauwens E, Debacq-Chainiaux F. The impact of cellular senescence in skin ageing: a notion of mosaic and therapeutic strategies. Biochem. Pharmacol. 2017;142:1–12. doi: 10.1016/j.bcp.2017.04.011. - DOI - PubMed
    1. Demaria M, Desprez PY, Campisi J, Velarde MC. Cell autonomous and non-autonomous effects of senescent cells in the skin. J. Invest. Dermatol. 2015;135:1722–1726. doi: 10.1038/jid.2015.108. - DOI - PMC - PubMed
    1. Boroni M, et al. Highly accurate skin-specific methylome analysis algorithm as a platform to screen and validate therapeutics for healthy aging. Clin. Epigenetics. 2020;12:105. doi: 10.1186/s13148-020-00899-1. - DOI - PMC - PubMed
    1. Dimri GP, et al. A biomarker that identifies senescent human cells in culture and in aging skin in vivo. Proc. Natl. Acad. Sci. USA. 1995;92:9363–9367. doi: 10.1073/pnas.92.20.9363. - DOI - PMC - PubMed