. 2023 May 22;3(1):71.
doi: 10.1038/s43856-023-00300-1.

Imaging immunomodulatory treatment responses in a multiple sclerosis mouse model using hyperpolarized 13C metabolic MRI

Affiliations

Imaging immunomodulatory treatment responses in a multiple sclerosis mouse model using hyperpolarized 13C metabolic MRI

Caroline Guglielmetti et al. Commun Med (Lond). .

Abstract

Background: In recent years, the ability of conventional magnetic resonance imaging (MRI), including T1 contrast-enhanced (CE) MRI, to monitor high-efficacy therapies and predict long-term disability in multiple sclerosis (MS) has been challenged. Therefore, non-invasive methods to improve MS lesions detection and monitor therapy response are needed.

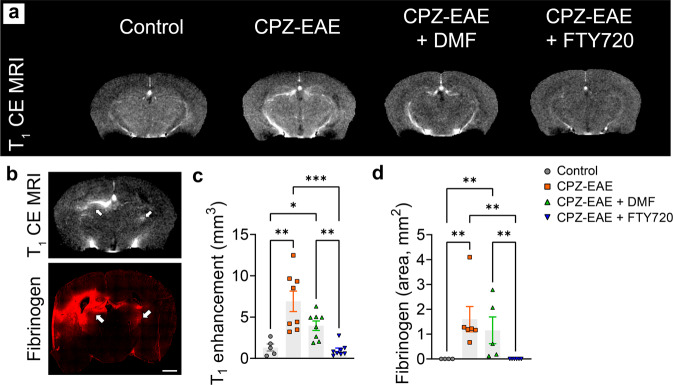
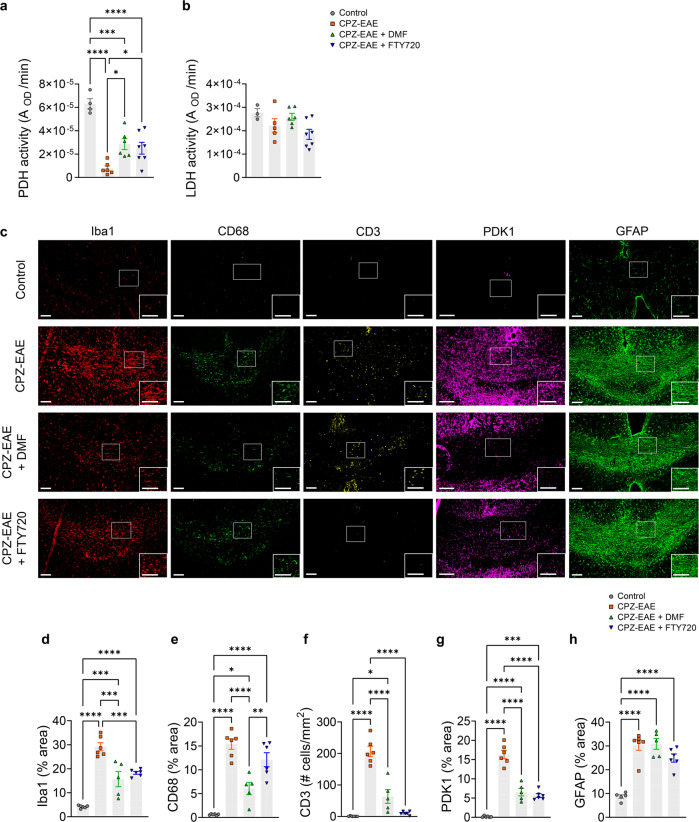
Methods: We studied the combined cuprizone and experimental autoimmune encephalomyelitis (CPZ-EAE) mouse model of MS, which presents inflammatory-mediated demyelinated lesions in the central nervous system as commonly seen in MS patients. Using hyperpolarized 13C MR spectroscopy (MRS) metabolic imaging, we measured cerebral metabolic fluxes in control, CPZ-EAE and CPZ-EAE mice treated with two clinically-relevant therapies, namely fingolimod and dimethyl fumarate. We also acquired conventional T1 CE MRI to detect active lesions, and performed ex vivo measurements of enzyme activities and immunofluorescence analyses of brain tissue. Last, we evaluated associations between imaging and ex vivo parameters.

Results: We show that hyperpolarized [1-13C]pyruvate conversion to lactate is increased in the brain of untreated CPZ-EAE mice when compared to the control, reflecting immune cell activation. We further demonstrate that this metabolic conversion is significantly decreased in response to the two treatments. This reduction can be explained by increased pyruvate dehydrogenase activity and a decrease in immune cells. Importantly, we show that hyperpolarized 13C MRS detects dimethyl fumarate therapy, whereas conventional T1 CE MRI cannot.

Conclusions: In conclusion, hyperpolarized MRS metabolic imaging of [1-13C]pyruvate detects immunological responses to disease-modifying therapies in MS. This technique is complementary to conventional MRI and provides unique information on neuroinflammation and its modulation.

Plain language summary

Magnetic resonance imaging (MRI) is widely used in the clinic to diagnose multiple sclerosis (MS), which affects the central nervous system and leads to a range of disabling symptoms. However, MRI is often not capable of detecting how well a patient responds to therapies, in particular those targeting the immune system. We questioned whether an advanced MRI method called hyperpolarized 13C MRS could help. Using a mouse model for MS, we showed that hyperpolarized 13C MRS can detect response to two therapies used in the clinic, namely fingolimod and dimethyl fumarate when conventional MRI could not. We also showed that this method is sensitive to the immune response. As hyperpolarized 13C MRS is becoming available in many centers worldwide, it could be used to evaluate existing and new treatments for people living with MS, improving care and quality of life.


Conflict of interest statement

The authors declare no competing interests.

Figures

Fig. 1
Fig. 1. Hyperpolarized 13C lactate/pyruvate decreases following response to DMF and FTY720 immunomodulatory therapies, while [13C]urea remains unchanged.
a EAE score at 14 ± 1 dpi. Only untreated and DMF-treated CPZ-EAE mice displayed symptoms of tail and/or limb paralysis, with decreased disease severity in DMF-treated mice. FTY720 prevented the appearance of EAE symptoms (n = 14 control, n = 12 CPZ-EAE, n = 11 CPZ-EAE + DMF, n = 14 CPZ-EAE + FTY720). b Representative 13C spectra from an untreated CPZ-EAE mouse brain (red voxel), after intravenous co-injection of hyperpolarized [1-13C]pyruvate and [13C]urea. Data were acquired every 4 s for 1 min starting from the beginning of injection. [13C]urea peak resonance is located at 162.5 ppm; [1-13C]pyruvate at 171 ppm and [1-13C]lactate at 183.5 ppm. c Summed spectra from representative control, CPZ-EAE, CPZ-EAE + DMF, and CPZ-EAE + FTY720 mice following intravenous injection of hyperpolarized [1-13C]pyruvate and [13C]urea, showing increased [1-13C]lactate peak intensity at 183.5 ppm in CPZ-EAE (red rectangle). d 13C lactate/pyruvate and [13C]urea color maps obtained from 13C chemical-shift images in control, CPZ-EAE, CPZ-EAE + DMF and CPZ-EAE + FTY720 mice. Corresponding quantitative analyses from the red highlighted voxels shown in (b) revealed a significant increase of e 13C lactate/pyruvate in untreated CPZ-EAE mice. Both DMF and FTY720 treated mice displayed lower 13C lactate/pyruvate compared to untreated CPZ-EAE mice (n = 7 control, n = 9 CPZ-EAE, n = 9 CPZ-EAE + DMF, n = 8 CPZ-EAE + FTY720). f [13C]urea was unchanged between groups (n = 7 control, n = 9 CPZ-EAE, n = 9 CPZ-EAE + DMF, n = 8 CPZ-EAE + FTY720). Abbreviations: experimental autoimmune encephalomyelitis (EAE), Cuprizone and experimental autoimmune encephalomyelitis (CPZ-EAE), Dimethyl fumarate (DMF), Fingolimod (FTY720), lactate-to-pyruvate ratio (lac./pyr.), normalized urea (nUrea). Data are shown as mean ± standard error. Control is indicated by gray circles, CPZ-EAE by orange rectangles, CPZ-EAE + DMF by green triangles, and CPZ-EAE + FTY720 by blue inverted triangles (*p ≤ 0.05, ***p ≤ 0.001, ****p ≤ 0.0001). Data to reproduce this figure are included in Supplementary Data 1.
Fig. 2
Fig. 2. T1 contrast enhancement MRI detects response to FTY720 treatment, but not to DMF therapy.
a T1 weighted MR image acquired after gadolinium-DTPA injection, in which T1 contrast enhancement (bright area), indicative of a leaky BBB, is clearly visible in untreated CPZ-EAE and DMF treated CPZ-EAE mouse brains, but not in FTY20 treated mice. b T1 weighted MR image acquired after gadolinium-DTPA injection shows T1 contrast enhancement (bright area, arrows), which corresponds to fibrinogen immunostaining (arrows) in the same mouse, confirming BBB leakiness indicated by MRI. Quantitative analyses revealed a significant increase of c T1 contrast enhancement (n = 5 control, n = 8 CPZ-EAE, n = 8 CPZ-EAE + DMF, n = 8 CPZ-EAE + FTY720) and d fibrinogen deposition in untreated CPZ-EAE mice and DMF-treated CPZ-EAE mice, but not in FTY720 treated mice (n = 4 control, n = 6 CPZ-EAE, n = 5 CPZ-EAE + DMF, n = 6 CPZ-EAE + FTY720). Abbreviations: Contrast-enhanced magnetic resonance imaging (CE MRI), Cuprizone and experimental autoimmune encephalomyelitis (CPZ-EAE), Dimethyl fumarate (DMF), Fingolimod (FTY720). Data are shown as mean ± standard error. Control is indicated by gray circles, CPZ-EAE by orange rectangles, CPZ-EAE + DMF by green triangles, and CPZ-EAE + FTY720 by blue inverted triangles (*p ≤ 0.05, **p ≤ 0.01, ***p ≤ 0.001). Scale bar is 1000 µm. Data to reproduce this figure are included in Supplementary Data 2.
Fig. 3
Fig. 3. Enzymatic and immunohistochemical histological characterization of DMF and FTY720 treatment responses.
a PDH activity from control (n = 4 mice), CPZ-EAE (n = 6 mice), CPZ-EAE + DMF (n = 6 mice) and CPZ-EAE + FTY720 (n = 7 mice). b LDH activity from control (n = 3 mice), CPZ-EAE (n = 5 mice), CPZ-EAE + DMF (n = 6 mice) and CPZ-EAE + FTY720 (n = 7 mice). Only PDH was significantly modulated following DMF and FTY720 treatments. c Representative immunofluorescence staining of the corpus callosum for microglia/macrophages (Iba1, red), pro-inflammatory marker (CD68, green), T cells (CD3, yellow), PDK1 (magenta), reactive astrocytes (GFAP, green). Quantitative analyses of d Iba1, e CD68, f CD3, g PDK1, and h GFAP from control (n = 5, 6, 6, 6 and 5 mice, respectively), CPZ-EAE (n = 5, 6, 6, 6 and 6 mice, respectively), CPZ-EAE + DMF (n = 4, 5, 5, 5 and 5 mice, respectively) and CPZ-EAE + FTY720 (n = 5, 6, 6, 6 and 6 mice, respectively). Abbreviations: Pyruvate dehydrogenase (PDH), lactate dehydrogenase (LDH), pyruvate dehydrogenase kinase 1 (PDK1), ionized calcium-binding adaptor molecule 1 (Iba1), glial fibrillary acidic protein (GFAP), Cuprizone and experimental autoimmune encephalomyelitis (CPZ-EAE), Dimethyl fumarate (DMF), Fingolimod (FTY720). Data are shown as mean ± standard error. Control is indicated by gray circles, CPZ-EAE by orange rectangles, CPZ-EAE + DMF by green triangles, and CPZ-EAE + FTY720 by blue inverted triangles (*p ≤ 0.05, **p ≤ 0.01, ***p ≤ 0.001, ****p ≤ 0.0001). Scale bar is 100 µm. Data to reproduce this figure are included in Supplementary Data 3.

References

    1. Reich DS, Lucchinetti CF, Calabresi PA. Multiple sclerosis. N. Engl. J. Med. 2018;378:169–180. doi: 10.1056/NEJMra1401483. - DOI - PMC - PubMed
    1. Wattjes MP, et al. 2021 MAGNIMS-CMSC-NAIMS consensus recommendations on the use of MRI in patients with multiple sclerosis. Lancet Neurol. 2021;20:653–670. doi: 10.1016/S1474-4422(21)00095-8. - DOI - PubMed
    1. University of California, San Francisco MS-EPIC Team. et al. Long-term evolution of multiple sclerosis disability in the treatment era. Ann. Neurol. 2016;80:499–510. doi: 10.1002/ana.24747. - DOI - PMC - PubMed
    1. Lochhead JJ, Yang J, Ronaldson PT, Davis TP. Structure, function, and regulation of the blood–brain barrier tight junction in central nervous system disorders. Front. Physiol. 2020;11:914. doi: 10.3389/fphys.2020.00914. - DOI - PMC - PubMed
    1. Vaidyanathan S, Patel CN, Scarsbrook AF, Chowdhury FU. FDG PET/CT in infection and inflammation-current and emerging clinical applications. Clin. Radiol. 2015;70:787–800. doi: 10.1016/j.crad.2015.03.010. - DOI - PubMed