. 2023 Aug;31(8):931-938.
doi: 10.1038/s41431-023-01377-x. Epub 2023 May 22.

New insights into the molecular basis of spinal neurofibromatosis type 1

Affiliations

New insights into the molecular basis of spinal neurofibromatosis type 1

Paola Bettinaglio et al. Eur J Hum Genet. 2023 Aug.

Abstract

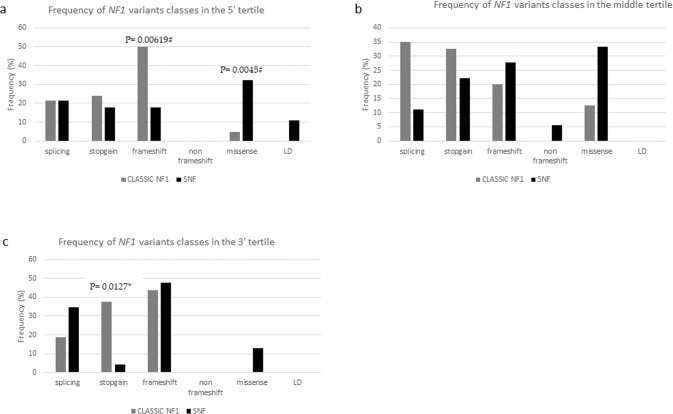
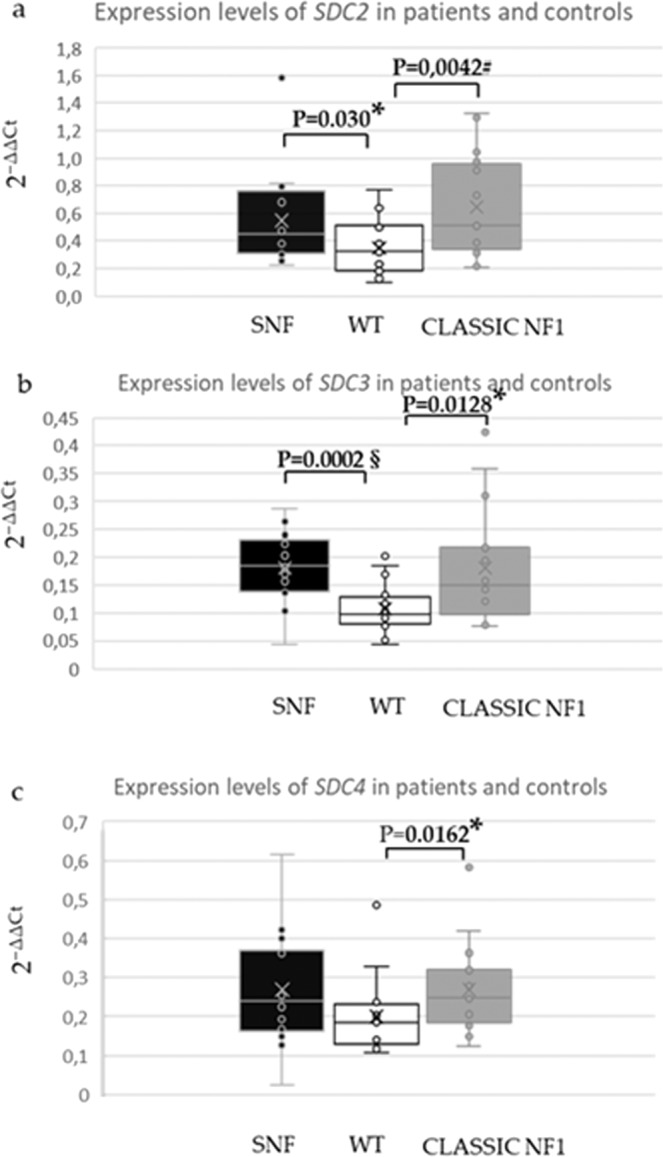
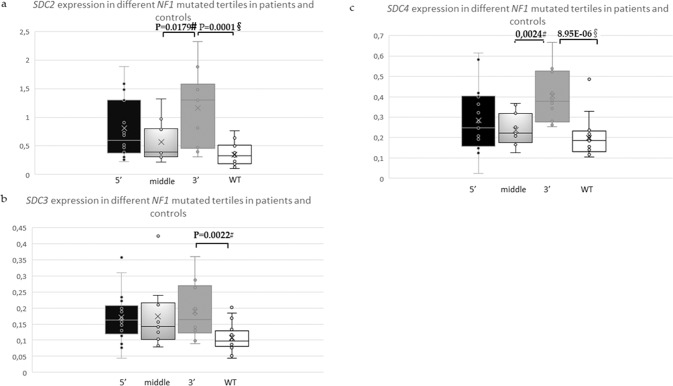
Spinal neurofibromatosis (SNF) is a form of neurofibromatosis type 1 (NF1) characterized by bilateral neurofibromas involving all spinal roots. The pathogenic mechanisms determining the SNF form are currently unknown. To verify the presence of genetic variants possibly related to SNF or classic NF1, we studied 106 sporadic NF1 and 75 SNF patients using an NGS panel of 286 genes encoding RAS pathway effectors and neurofibromin interactors and evaluated the expression of syndecans (SDC1, SDC2, SDC3, SDC4), the NF1 3' tertile interactors, by quantitative real-time PCR. We previously identified 75 and 106 NF1 variants in SNF and NF1 cohorts, respectively. The analysis of the distribution of pathogenic NF1 variants in the three NF1 tertiles showed a significantly higher prevalence of NF1 3' tertile mutations in SNF than in the NF1 cohort. We hypothesized a potential pathogenic significance of the 3' tertile NF1 variants in SNF. The analysis of syndecan expression on PBMCs RNAs from 16 SNF, 16 classic NF1 patients and 16 healthy controls showed that the expression levels of SDC2 and SDC3 were higher in SNF and NF1 patients than in controls; moreover, SDC2, SDC3 and SDC4 were significantly over expressed in patients mutated in the 3' tertile compared to controls. Two different mutational NF1 spectra seem to characterize SNF and classic NF1, suggesting a pathogenic role of NF1 3' tertile and its interactors, syndecans, in SNF. Our study, providing new insights on a possible role of neurofibromin C-terminal in SNF, could address effective personalized patient management and treatments.


Conflict of interest statement

The authors declare no competing interests.

Figures

Fig. 1
Fig. 1. Distribution of different classes of variants within the NF1 tertiles.
Distribution of splicing, stopgain, frameshift insertion-deletion, non-frameshift insertion-deletion, missense mutations and large deletions (LD) of NF1 gene in the 5’ (a), middle (b) and 3’ (c) tertile of the NF1 gene. Statistically significant p values obtained by Fisher’s exact test or chi-square and after correction for multiple tests using Benjamini–Hochberg procedure are shown above the bars. #Significant with an FDR of 0.05 and 0.025 after B-H correction for multiple tests. *Significant with an FDR of 0.05 after B-H correction for multiple tests.
Fig. 2
Fig. 2. Syndecans expression in patients and controls.
Box plots show the dispersion and quantitative expression levels of gene expression values (2−ΔCt) analyzed by qPCR of the syndecans genes SDC2, SDC3 and SDC4 in PBMCs of 16 patients with SNF (shown in black), 16 controls (WT, shown in white) and 16 patients with classic NF1 (shown in gray). SDC2 (a), SDC3 (b) and SDC4 (c) were statistically significantly overexpressed, even after B-H correction for multiple tests, in SNF and classic NF1 patients compared with controls, Student’s t test. The boxes represent the 25th and 75th percentiles. The whiskers show the minimum and maximum value of the distribution, excluding outliers. The broad horizontal lines represent the median value. Outliers are represented as points outside the boxes and excluded from the Student’s t test analysis. Statistically significant p values obtained from Student’s t test and after correction for multiple tests using Benjamini–Hochberg procedure are shown above the bars. #Significant with an FDR of 0.05 and 0.025 after B-H correction for multiple tests. *Significant with an FDR of 0.05 after B-H correction for multiple tests. §Significant with an FDR of 0.05, 0.025 and 0.01 after B-H correction for multiple tests.
Fig. 3
Fig. 3. Syndecans’ expression in different NF1 mutated tertiles in patients and controls.
The box plots show the dispersion and the quantitative expression levels of the gene expression values (2−ΔCt) analyzed by qPCR of the syndecans genes SDC2 (a), SDC3 (b) and SDC4 (c) in PBMCs from 18 patients with NF1 mutations in the 5’ tertile (5’, shown in black), 11 patients with NF1 mutations in the middle tertile (middle, shown in light gray), 10 patients with NF1 mutations in the 3’ tertile (3’, shown in gray) and 16 healthy controls (WT, shown in white). SDC2, SDC3 and SDC4 were statistically significantly hyper-expressed, even after B-H correction for multiple tests, in patients with NF1 mutations of the 3’ tertile as compared to controls. SDC2 and SDC4 were statistically significantly hyper-expressed in patients with NF1 mutations of the 3’ tertile as compared with patients carrying NF1 mutations in the middle tertile, Student’s t test. The boxes represent the 25th and 75th percentiles. The whiskers show the minimum and maximum value of the distribution, excluding the outliers. The big horizontal lines represent the median value. The outliers are represented as spots outside of the boxes and excluded from the Student’s t test analysis. Statistically significant p values obtained by Student’s t test and after correction for multiple testing using Benjamini–Hochberg procedure are showed above the bars. #Significant with a FDR of 0.05 and 0.025 after B-H correction for multiple tests. §Significant with a FDR of 0.05, 0.025 and 0.01 after B-H correction for multiple tests.

References

    1. Kang E, Kim YM, Seo GH, Oh A, Yoon HM, Ra YS, et al. Phenotype categorization of neurofibromatosis type I and correlation to NF1 mutation types. J Hum Genet. 2020;65:79–89. doi: 10.1038/s10038-019-0695-0. - DOI - PubMed
    1. Ruggieri M, Polizzi A, Spalice A, Salpietro V, Caltabiano R, D’Orazi V, et al. The natural history of spinal neurofibromatosis: a critical review of clinical and genetic features. Clin Genet. 2015;87:401–10. doi: 10.1111/cge.12498. - DOI - PubMed
    1. Nguyen R, Dombi E, Akshintala S, Baldwin A, Widemann BC. Characterization of spinal findings in children and adults with neurofibromatosis type 1 enrolled in a natural history study using magnetic resonance imaging. J Neurooncol. 2015;121:209–15. doi: 10.1007/s11060-014-1629-5. - DOI - PubMed
    1. Sharif S, Upadhyaya M, Ferner R, Majounie E, Shenton A, Baser M, et al. A molecular analysis of individuals with neurofibromatosis type 1 (NF1) and optic pathway gliomas (OPGs), and an assessment of genotype-phenotype correlations. J Med Genet. 2011;48:256–60. doi: 10.1136/jmg.2010.081760. - DOI - PubMed
    1. Bergoug M, Doudeau M, Godin F, Mosrin C, Vallée B, Bénédetti H. Neurofibromin structure, functions and regulation. Cells. 2020;9:2365. - PMC - PubMed

Publication types