. 2023 Jun;4(6):908-924.
doi: 10.1038/s43018-023-00566-3. Epub 2023 May 22.

Phenotypic diversity of T cells in human primary and metastatic brain tumors revealed by multiomic interrogation

Affiliations

Phenotypic diversity of T cells in human primary and metastatic brain tumors revealed by multiomic interrogation

Vladimir Wischnewski et al. Nat Cancer. 2023 Jun.

Abstract

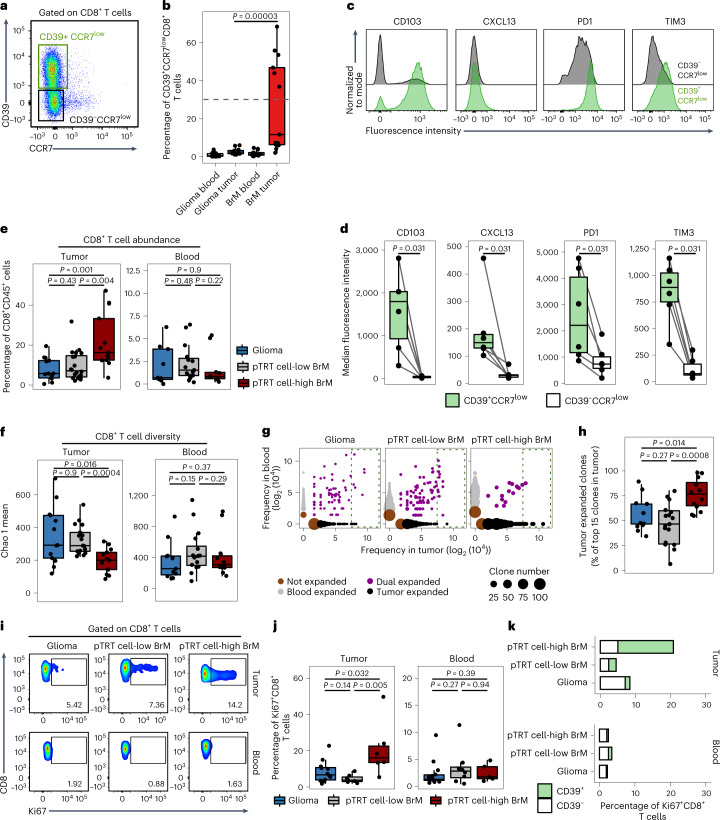
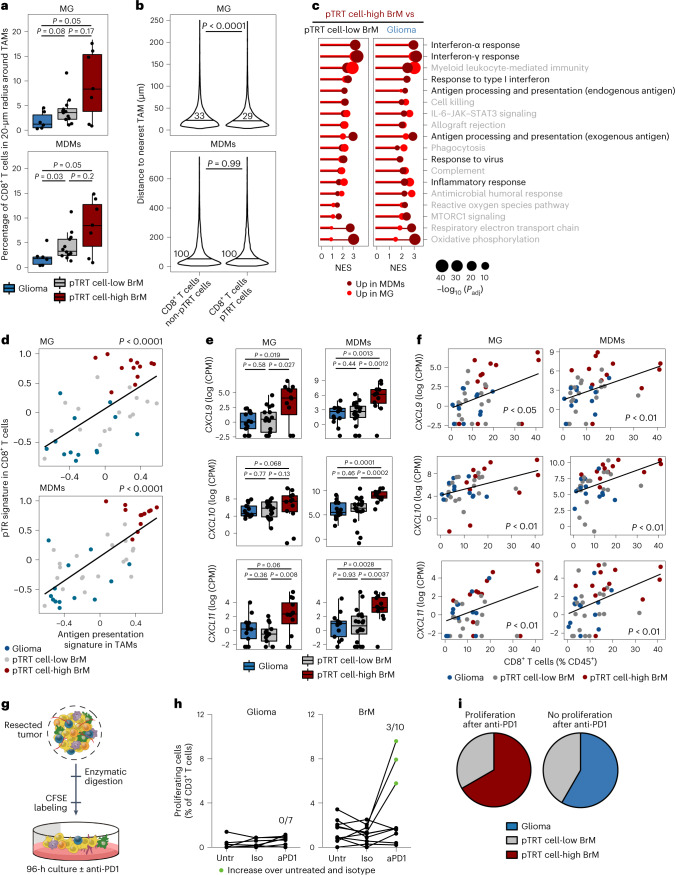
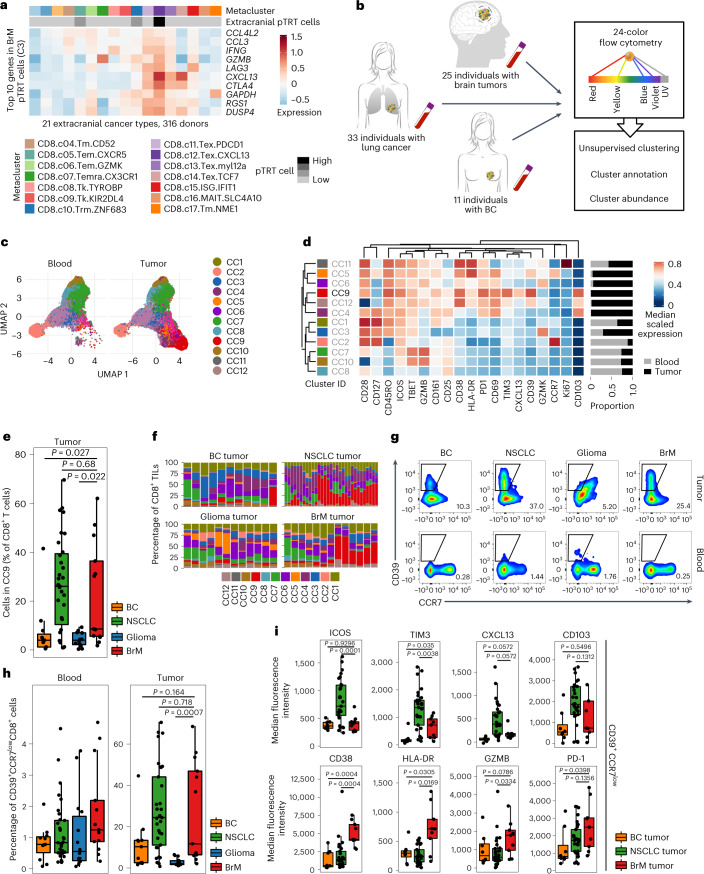
The immune-specialized environment of the healthy brain is tightly regulated to prevent excessive neuroinflammation. However, after cancer development, a tissue-specific conflict between brain-preserving immune suppression and tumor-directed immune activation may ensue. To interrogate potential roles of T cells in this process, we profiled these cells from individuals with primary or metastatic brain cancers via integrated analyses on the single-cell and bulk population levels. Our analysis revealed similarities and differences in T cell biology between individuals, with the most pronounced differences observed in a subgroup of individuals with brain metastasis, characterized by accumulation of CXCL13-expressing CD39+ potentially tumor-reactive T (pTRT) cells. In this subgroup, high pTRT cell abundance was comparable to that in primary lung cancer, whereas all other brain tumors had low levels, similar to primary breast cancer. These findings indicate that T cell-mediated tumor reactivity can occur in certain brain metastases and may inform stratification for treatment with immunotherapy.


Conflict of interest statement

M.E.H. has an advisory role at TME Pharma. E.L. receives research grants from Bristol Meyers Squibb on a topic unrelated to this manuscript. J.A.J. currently serves on the scientific advisory board of Pionyr Immunotherapeutics and received an honorarium for speaking at a research symposium organized by Bristol Meyers Squibb (last 3 years). All other authors have no competing interests.

Figures

Fig. 1
Fig. 1. scRNA-seq identifies pTRT cells in a subset of individuals with BrM and defines a BrM pTRT cell-specific gene signature.
ac, UMAP of T cells from nine individuals with brain cancer colored by tissue (a), cell type (b) and cluster ID (c). d, Stacked bar plots showing the abundance of each cluster in blood and tumors, respectively, from individuals with BrM (n = 6) and glioma (n = 3). e, Expression heat map showing the top ten genes in each CD8+ T cell cluster from n = 9 individuals. f, Enrichment of neoantigen-reactive CD8+ T cell gene signatures in each CD8+ T cell cluster, as indicated by the corresponding matched colors. The five different gene signatures analyzed are denoted by first author and year and can be found in the references. g, Stacked bar plot showing the clonality of the TCR in each CD8+ T cell cluster. TCR clonotypes are grouped into five categories based on their prevalence in each individual and are colored accordingly; ND, not detected. h, Alluvial plots visualizing the frequency of the top 15 TCR clonotypes within C1 (left) and C3 (right), respectively. Each clonotype within one cluster is annotated with a unique color. i, Number of TCR clonotypes perfectly matched with published virus-specific TCRs from VDJdb in each CD8+ T cell cluster from n = 9 individuals; CMV, cytomegalovirus; EBV, Epstein–Barr virus; HCV, hepatitis C virus. j, Abundance of C3 within each tumor. Samples are annotated as C3 high with a cumulative abundance of >30% (dotted horizontal line) or as C3 low. k, Dot plot showing average expression for each gene in n = 5,188 cells from C3 in C3-high tumors (n = 3 tumors) versus n = 920 cells from C3 in C3-low tumors (n = 6 tumors). Genes identified as DEGs in Seurat are highlighted. l, Bar plots showing the difference in abundance of defined T cell states in C3-high (n = 3 tumors) versus C3-low (n = 3 tumors) tumors depicted as fold change; Eff. Mem., effector memory; TFH, follicular helper T cells; TH1, type 1 helper T cells. Source data
Fig. 2
Fig. 2. T cell activation and differentiation is a common feature of brain tumor-infiltrating T cells.
a, Principal-component analysis based on the 250 most variably expressed genes (see Supplementary Table 2a for gene list) across all T cells (CD4+ and CD8+ from the blood and tumors) colored by tissue (top) or cell type (bottom) sorted from 54 individuals with brain cancer (tumor and blood) and blood from 12 HDs. For clinical details, see Supplementary Table 1a; PC, principal component. b, Bar plot showing GSEA of the comparison between T cells from blood (n = 85) and tumor (n = 102) samples using the MSigDB C7 collection filtered to contain only T cell-related pathways (see Supplementary Table 2b for full pathway list); NES, normalized enrichment score. c, Box plots representing the proportion of CD45RO+ cells among CD8+ (top) and CD4+ (bottom) T cells in n = 11 HD, n = 10 glioma and n = 19 BrM blood samples, and n = 9 glioma and n = 19 BrM tumor samples. Matched brain cancer samples are denoted by connected lines. Significance was determined by paired two-sided Wilcoxon test. Box plots represent first and third quartiles with the medians as the center; whiskers show 1.5× the interquartile range of the 25th and 75th percentiles. d, Dot plot showing the fold change (FC) of each gene between matched blood and tumor CD8+ T cells in n = 33 individuals with BrM (x axis) and n = 14 individuals with glioma (y axis). Genes passing the indicated significance cutoff in one or both diseases are colored as indicated. Most enriched shared genes in tumors or blood are highlighted, including CXCL13 as the most DEG between glioma and BrM CD8+ TILs; FDR, false discovery rate. e, Expression heat map and hierarchical clustering of top genes from C3 in CD8+ T cells from n = 47 tumors in the bulk RNA-seq cohort. Columns and rows (z score) are hierarchically clustered. Disease and pTRT cell status are annotated per column; RT, radiotherapy; Hormone, hormone therapy; Targeted, targeted therapy; Immuno, immunotherapy; Chemo, chemotherapy; Dexa, dexamethasone; SRS, stereotactic radiosurgery. f, Box plots showing the enrichment of neoantigen-reactive CD8+ T cell gene signatures in CD8+ TILs in n = 14 individuals with glioma, n = 20 individuals with pTRT cell-low BrM and n = 13 individuals with pTRT cell-high BrM (five different signatures). Significance was determined with an unpaired two-sided Wilcoxon test and a Benjamini–Hochberg multiple comparison correction. Box plots are defined as in c. Source data
Fig. 3
Fig. 3. CD8+ T cells in pTRT cell-high tumors are highly abundant and clonally expanded.
a, Representative FCM plot showing the gating strategy for CD39+CCR7lowCD8+ and CD39CCR7lowCD8+ T cells. b, Box plot showing the percentage of CD39+CCR7low cells among CD8+ T cells in individuals with glioma (n = 14 blood and n = 12 tumor samples) and BrM (n = 13 blood and n = 13 tumor samples). Significance was determined with a two-sided Wilcoxon test and Benjamini–Hochberg multiple comparison correction. c, FCM histograms showing the expression of indicated markers in one representative pTRT cell-high sample from an individual with BrM. d, Box plots comparing the median fluorescence intensity of each of the markers indicated in CD39+CCR7lowCD8+ and CD39CCR7lowCD8+ T cells in n = 6 individuals with pTRT cell-high BrM. Significance was determined with a paired two-sided Wilcoxon test. e, Box plots showing the abundance of CD8+ T cells in tumors (left, n = 14 glioma, n = 20 pTRT cell-low and n = 13 pTRT cell-high BrM samples) and blood (right, n = 9 glioma, n = 15 pTRT cell-low and n = 10 pTRT cell-high BrM samples) as the proportion of all CD45+ immune cells. Significance was determined by unpaired two-sided Wilcoxon test with a Benjamini–Hochberg multiple comparison correction. f, Box plots summarizing the diversity of TCR β-chain in tumors (left, n = 13 glioma, n = 17 pTRT cell-low and n = 13 pTRT cell-high BrM samples) and blood (right, n = 9 glioma, n = 15 pTRT cell-low and n = 11 pTRT cell-high BrM samples) as the Chao 1 index. Significance was determined by unpaired two-sided Wilcoxon test with a Benjamini–Hochberg multiple comparison correction. g, Scatter plots of TCR clones are shown for three representative individuals with normalized frequency of clones in the tumor and blood. Dots are colored by expansion profile (not expanded, expanded only in tumor, expanded only in blood or dually expanded) and sized by the number of clones with the same expansion statistic. h, Box plot summarizing the proportion of clones detected only in the tumor from the 15 most-expanded clones in n = 11 individuals with glioma, n = 17 individuals with pTRT cell-low BrM and n = 12 individuals with pTRT cell-high BrM. Significance was determined by unpaired two-sided Wilcoxon test with a Benjamini–Hochberg multiple comparison correction. i, Representative FCM plots showing Ki67 staining gated on CD8+ T cells. j, Box plots showing the percentage of Ki67+ cells among CD8+ T cells in n = 12 glioma, n = 7 pTRT cell-low BrM and n = 6 pTRT cell-high BrM tumor samples, and n = 14 glioma, n = 8 pTRT cell-low BrM and n = 5 pTRT cell-high BrM blood samples. Significance was determined by unpaired two-sided Wilcoxon test with a Benjamini–Hochberg multiple comparison correction. k, Stacked bar plots showing the mean proportion of Ki67+CD8+ T cells in n = 12 glioma, n = 7 pTRT cell-low BrM and n = 6 pTRT cell-high BrM tumor samples, and n = 14 glioma, n = 8 pTRT cell-low BrM and n = 5 pTRT cell-high BrM blood samples. CD39 positivity is indicated in green. Box plots in b, df, h and j are defined as explained in Fig. 2c. Source data
Fig. 4
Fig. 4. pTRT cells in BrM are located in PVNs and the stroma and within tumor nests.
a, Representative IF images from a pTRT cell-high BrM, a pTRT cell-low BrM and a glioma. Insets on the far right of each image show a higher magnification of the CD8+ T cell indicated by a white arrow. b, Box plots showing the quantification of CD103+PD1+CD8+ TILs in n = 5 glioma, n = 9 pTRT cell-low BrM and n = 6 pTRT cell-high BrM tumor samples, shown as cells per square millimeter (left), proportion of CD45+ cells (middle) and proportion of CD8+ cells (right). Significance was determined by unpaired two-sided Wilcoxon test with a Benjamini–Hochberg multiple comparison correction. Box plots are defined as explained in Fig. 2c. c, Representative image of T cells within (white arrow) and outside (yellow arrow) the PVN, defined as a 15-µm radius surrounding the nearest vessel. d, Quantification of CD103+PD1+CD8+ TILs within or outside the PVN (n = 79,586 CD8+ T cells). e, Violin plot showing the mean distance of CD8+ TILs from the respective nearest vessel stratified by the coexpression of CD103 and PD1. The mean distance for each group is indicated. Significance was determined by unpaired two-sided Wilcoxon test. f, Neighborhood analysis summarizing the cell types within a 20-µm radius around CD103+PD1+CD8+ TILs. Source data
Fig. 5
Fig. 5. Myeloid cells with antigen presentation capacity are associated with high pTRT cell abundance.
a, Box plots showing the percentage of CD8+ TILs within a 20-µm radius around MG (top) or MDMs (bottom) in n = 6 individuals with glioma, n = 12 individuals with pTRT cell-low BrM and n = 7 individuals with pTRT cell-high BrM. Significance was determined by unpaired two-sided Wilcoxon test with a Benjamini–Hochberg multiple comparison correction. b, Violin plots showing the distance of CD8+ TILs from the respective nearest TAM (MG, top; MDMs, bottom) stratified by the coexpression of CD103 and PD1 in n = 5 individuals with glioma and n = 16 individuals with BrM. The mean distance for each group is indicated. Significance was determined by unpaired two-sided Wilcoxon test. c, Balloon plot showing results from a GSEA of Hallmark and Gene Ontology biological process gene sets in MDMs and MG from pTRT cell-high BrM versus pTRT cell-low BrM or gliomas, respectively. Pathways mentioned in the main text are highlighted in black. Adjusted P values (Benjamini–Hochberg method) and normalized enrichment scores (NES) were calculated with the fgsea package in R; IL-6, interleukin 6; Padj, adjusted P value. d, Dot plots indicating a correlation between the expression of antigen presentation programs in MG (top) or MDMs (bottom) and the pTRT cell signature enrichment in CD8+ T cells. Significance was determined by linear regression. Dots are colored by disease group; n = 13 individuals with glioma, nMG = 17 individuals with pTRT cell-low BrM, nMDM = 20 individuals with pTRT cell-low BrM and n = 12 individuals with pTRT cell-high BrM. e, Box plots showing the expression of T cell recruitment cytokines as log2 (CPM) in n = 13 individuals with glioma, nMG = 17 individuals with pTRT cell-low BrM, nMDM = 20 individuals with pTRT cell-low BrM and n = 12 individuals with pTRT cell-high BrM. Adjusted P values (Benjamini–Hochberg method) were calculated with the limma package in R. CPM, counts per million. f, Dot plots indicating the correlation between the abundance of CD8+ T cells and the expression of CXCL9, CXCL10 and CXCL11 in MG (left) or MDMs (right). Significance was determined by linear regression. Dots are colored by disease group; n = 13 individuals with glioma, nMG = 17 individuals with pTRT cell-low BrM, nMDM = 20 individuals with pTRT cell-low BrM and n = 12 individuals with pTRT cell-high BrM. g, Schematic of the ex vivo anti-PD1 treatment and T cell proliferation assay. h, Summary of ex vivo T cell proliferation in n = 7 glioma (left) and n = 10 BrM (right) tumor samples under the indicated conditions. Samples showing a proliferation increase compared to both untreated (Untr) and isotype control (Iso) conditions are highlighted; aPD1, anti-PD1. i, Pie charts indicating the disease group of n = 7 glioma and n = 8 BrM tumors used in the ex vivo proliferation assay profiled by at least one other method (FCM or RNA-seq) and grouped by their response to anti-PD1. Box plots in Fig. 5a,e are defined as explained in Fig. 2c. Source data
Fig. 6
Fig. 6. Abundance of pTRT cells in BrM and primary NSCLC is comparable, while the phenotypes are distinct.
a, Expression heat map of the top ten genes from BrM C3 in the pan-cancer single-cell T cell atlas data. Rows represent normalized and scaled expression. Metacluster and pTRT cell status are annotated per column. b, Schematic of the high-dimensional FCM analysis. c, UMAP of the full cohort grouped by tissue with the cytometry cluster (CC) annotated. d, Heat map showing median scaled expression of individual markers in each cluster and the proportion among blood or tumor CD8+ T cells. e, Box plot visualizing the abundance of the pTRT cell cluster CC9 in n = 11 individuals with BC, n = 32 individuals with NSCLC, n = 12 individuals with glioma and n = 12 individuals with BrM. Significance was determined with a Kruskal–Wallis test and a Benjamini–Hochberg multiple comparison correction. f, Stacked bar plots showing the abundance of each cluster in individual tumors grouped by disease. g, Representative FCM plots illustrating the expression of CD39 and CCR7 in the blood and tumor of each disease group. h, Box plot summarizing the abundance of CD39+CCR7low cells among all CD8+ T cells in the blood of n = 11 individuals with BC, n = 33 individuals with NSCLC, n = 14 individuals with glioma and n = 13 individuals with BrM, and in the tumors of n = 11 individuals with BC, n = 32 individuals with NSCLC, n = 12 individuals with glioma and n = 13 individuals with BrM. Significance was determined with a Kruskal–Wallis test with a Benjamini–Hochberg multiple comparison correction. i, Box plots showing median fluorescence intensity of the indicated markers expressed on CD39+CCR7lowCD8+ TILs from n = 8 individuals with BC, n = 29 individuals with NSCLC and n = 9 individuals with BrM. Significance was determined by a Kruskal–Wallis test with a Benjamini–Hochberg multiple comparison correction. Box plots in Fig. 6e,h,i are defined as explained in Fig. 2c. Source data
Extended Data Fig. 1
Extended Data Fig. 1. Single-cell RNAseq identifies pTRT in a subset of BrM patients and defines a BrM pTRT-specific gene signature.
a, Schematic of the experimental analysis pipeline. b, Gating strategy for, and purity of, the sorting of T cells from whole tumor suspensions for single-cell RNAseq. c, Representative Uniform Manifold Approximation and Projection (UMAP) of blood and tumor T cells isolated from one patient, before and after cryopreservation. d, Stacked bar plots showing the frequency of each cluster before (fresh) and after (frozen) cryopreservation. e, Similarity analysis of the TCR repertoire in the blood and tumor of fresh and cryopreserved samples. f, Stacked bar plots showing the abundance of CD8 + clusters in BrM and glioma tumors and blood. g, Reference map of canonical T cell states (left panel) and projections (right panels) of T cells onto the map colored by cluster identity. h, Dot plot showing the relationship between the abundance of cluster C3 among CD8 + T cells and the frequencies of CD8 + T cells among all CD45 + immune cells in nine brain cancer patient samples. Source data
Extended Data Fig. 2
Extended Data Fig. 2. T cell activation and differentiation is a common feature of brain tumor-infiltrating T cells.
a, Gating strategy to sort T cells from whole tumor for bulk RNA-seq and control of sorting purity. b, The most-enriched pathways in tumor or blood T cells from MSigDB C7 collection are shown. Pathways from (Fig. 2b) are highlighted. For full pathway list, see Supplementary Table 2b. c, Representative flow cytometry (FCM) plots showing the expression of CD45 isoforms in blood and tumor T cells. d, Venn diagram highlighting the private and shared differentially expressed genes (DEG) from the comparison of matched blood CD8 + T cells versus CD8 + tumor-infiltrating lymphocytes (TILs) using the indicated statistical cutoffs. e, Log2(fold-change) versus -log10(adjusted p value) volcano plot showing differential expression analysis contrasting CD8 + TILs from BrM to CD8 + TILs from glioma calculated with limma package in R. DEG with log2(fold-change) > 3 or log2(fold-change) < -3 and P.adj < 0.05 are highlighted. f, Box plots showing normalized RNA expression of CXCL13 as log2(cpm) in CD8 + T cells from blood (nhealthy = 9, nglioma = 9, nBrM = 25), or tumor tissue (nglioma = 14, nBrM = 33). Adjusted P-values (Benjamini & Hochberg method) were calculated with limma package in R. g, Stacked bar plots visualizing clinical factors of the n = 47 patients grouped in Fig. 2f. No statistically significant differences between the pTRT-high and the pTRT-low group were observed with respect to patient treatment history, sex, or age (lower left panel). h, Heatmap of gene set variation analysis (GSVA) results of five neoantigen-reactive T cell gene signatures in CD8 + T cells isolated from tumors, matched patient blood, and healthy donor blood. Columns and rows are hierarchically clustered. For f and g, the box plots represent first and third quartiles with median as center; whiskers show 1.5 × interquartile range of the 25th and 75th percentiles. Source data
Extended Data Fig. 3
Extended Data Fig. 3. CD8 + pTRT are expanded predominantly in tumor tissue and can be detected by flow cytometry as CD39 + CCR7low cells.
a, Dot plot showing the relationship between the abundance of cluster C3 among CD8 + T cells and the frequencies of CD39 + CCR7low cells among all CD8 + T cells in six brain tumors profiled by FCM and scRNA-seq. Significance determined with linear regression. b, CD8 + T cells in pTRT-high tumors are highly abundant and clonally expanded. Representative alluvial plots visualizing the frequency of the top 15 T cell receptor (TCR) clones within three patients (pTRT-high BrM, pTRT-low BrM, and a glioma patient) in the blood and tumor, respectively. Each clone within an individual patient sample is annotated with a unique color. Source data
Extended Data Fig. 4
Extended Data Fig. 4. pTRT in BrM are located in perivascular niches, stroma, and within tumor nests.
a, Schematic of multiplexed immunofluorescence (IF) imaging. b, Representative IF images and quantification using QuPath and R software from one patient are shown. c, Patient stratification strategy for IF analysis based on FCM, scRNA-seq, and bulk RNA-seq data. d, Heatmap summarizing the pTRT status for each patient using the strategy described in (c). e, Box plot showing the abundance of CD8 + T cells in tumors (nglioma = 5, nBrM_pTRT-low = 9, and nBrM_pTRT-high = 6) as the proportion of all CD45 + immune cells detected by IF. Significance determined with unpaired two-sided Wilcoxon-test with Benjamini-Hochberg multiple comparison correction. f, Full section with IF-derived cell annotation of the indicated populations and tissue regions for one representative patient sample. g, Stacked bar plots showing the quantification of the location of CD103 + PD1 + CD8 + TILs and all other CD8 + TILs in each individual patient. Color indicates the location within (perivascular niches, PVN) or outside (non-PVN) a 15 µm radius surrounding the nearest vessel. h, Full section IF-derived annotation of the indicated cell populations for one representative patient sample. i, Neighborhood analysis summarizing the cell types within a 20 µm radius around CD103 + PD1 + CD8 + TILs in individual patients with > ten CD103 + PD1 + CD8 + cells in each analyzed tissue section. j, Representative image (left panel) and quantification (right panel) of the proportion of tumor cells (pan-cadherin + ) among all CD45neg non-immune cells in n = 19 brain metastasis samples. k, Dot plot showing the relationship between the enrichment of C3-specific genes in CD8 + T cells profiled by bulk RNA-seq and the frequencies of pTRT measured by IF, FCM, and scRNA-seq. Significance determined with linear regression. Confidence interval of 0.95 is indicated in grey. For e and j, the box plots represent first and third quartiles with median as center; whiskers show 1.5 × interquartile range of the 25th and 75th percentiles. Source data
Extended Data Fig. 5
Extended Data Fig. 5. Distance of myeloid cells to CD8 + TILs.
Representative IF images and quantification using QuPath and R software from two patients are shown, indicating T cells, MG (upper set of images) and MDMs (lower set of images).
Extended Data Fig. 6
Extended Data Fig. 6. Myeloid cells with antigen-presentation capacity are associated with high pTRT abundance.
a, Gating strategy to sort MG and MDM from whole tumors for bulk RNA-seq. b, Schematic of the differential expression analysis (DEA). c, Box plots showing expression of IDO1 as log2(cpm) in nMG = 42 and nMDM = 45 patients. Adjusted P-values (Benjamini & Hochberg method) were calculated with limma package in R. d, Log2(fold-change) versus -log10(adjusted P-value, Benjamini & Hochberg method) volcano plot showing DEA results contrasting MG or MDMs from pTRT-high BrM to respective cells in pTRT-low BrM or glioma tumors calculated with limma package in R. Number of DEG using log2(fold-change) > 2 or log2(fold-change) < -2 and P.adj < 0.05 as cutoff are indicated. For full gene lists, see Supplementary Table 3b. e, Representative FCM plots showing CFSE dilution in CD3 + cells from one tumor sample under the experimental conditions indicated. Percentage of proliferating T cells is annotated for each panel. f, Box plots summarizing the proliferation of T cells isolated from n = 9 glioma or n = 8 BrM tumors, respectively, with or without anti-CD3/anti-CD28 stimulation. For c and f, the box plots represent first and third quartiles with median as center; whiskers show 1.5 × interquartile range of the 25th and 75th percentiles. Source data
Extended Data Fig. 7
Extended Data Fig. 7. Abundance of pTRT in BrM and primary NSCLC is comparable, while the phenotypes are distinct.
a, Abundance of each cytometry cluster (CC) in the blood and tumor of nBC = 11, nNSCLC = 30, nglioma = 12, and nBrM = 13 patients. b, Stacked bar plots showing the abundance of each CC in individual patient blood samples grouped by the disease. c, Balloon plot summarizing the differences in the abundance of each cluster in tumors of the four disease groups. Balloon size represents the -log10(adjusted p value), and the color indicates the fold change. For a, the box plots represent first and third quartiles with median as center; whiskers show 1.5 × interquartile range of the 25th and 75th percentiles. Source data

References

    1. Azzarelli, R., Simons, B. D. & Philpott, A. The developmental origin of brain tumours: a cellular and molecular framework. Development145, dev162693 (2018). - PMC - PubMed
    1. Steindl A, et al. Changing characteristics, treatment approaches and survival of patients with brain metastasis: data from 6,031 individuals over an observation period of 30 years. Eur. J. Cancer. 2022;162:170–181. doi: 10.1016/j.ejca.2021.12.005. - DOI - PubMed
    1. Poon MTC, Sudlow CLM, Figueroa JD, Brennan PM. Longer-term (≥2 years) survival in patients with glioblastoma in population-based studies pre- and post-2005: a systematic review and meta-analysis. Sci. Rep. 2020;10:11622. doi: 10.1038/s41598-020-68011-4. - DOI - PMC - PubMed
    1. Sperduto PW, et al. Survival in patients with brain metastases: summary report on the updated diagnosis-specific graded prognostic assessment and definition of the eligibility quotient. J. Clin. Oncol. 2020;38:3773–3784. doi: 10.1200/JCO.20.01255. - DOI - PMC - PubMed
    1. Klemm F, et al. Interrogation of the microenvironmental landscape in brain tumors reveals disease-specific alterations of immune cells. Cell. 2020;181:1643–1660. doi: 10.1016/j.cell.2020.05.007. - DOI - PMC - PubMed

Publication types