. 2023 Jun;3(6):722-733.
doi: 10.1038/s43587-023-00421-1. Epub 2023 May 22.

Immunovirological and environmental screening reveals actionable risk factors for fatal COVID-19 during post-vaccination nursing home outbreaks

Collaborators, Affiliations

Immunovirological and environmental screening reveals actionable risk factors for fatal COVID-19 during post-vaccination nursing home outbreaks

Lize Cuypers et al. Nat Aging. 2023 Jun.

Abstract

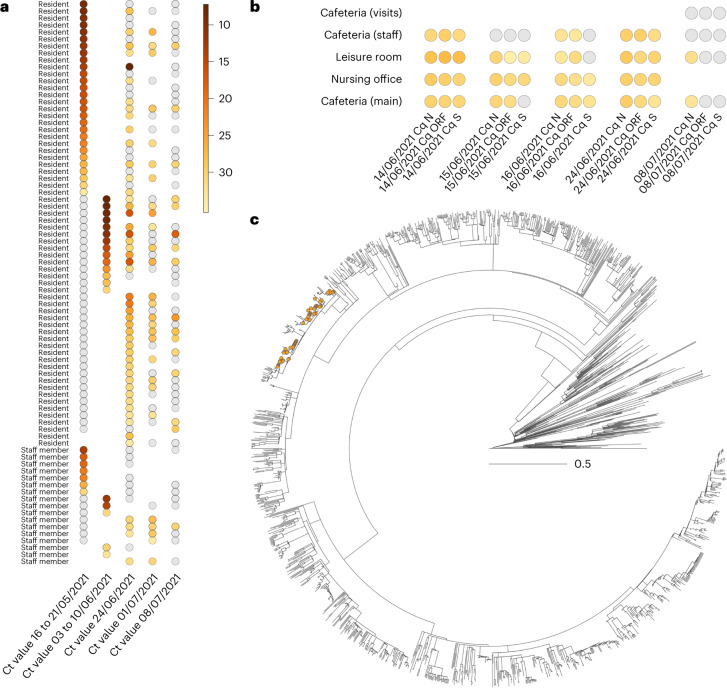
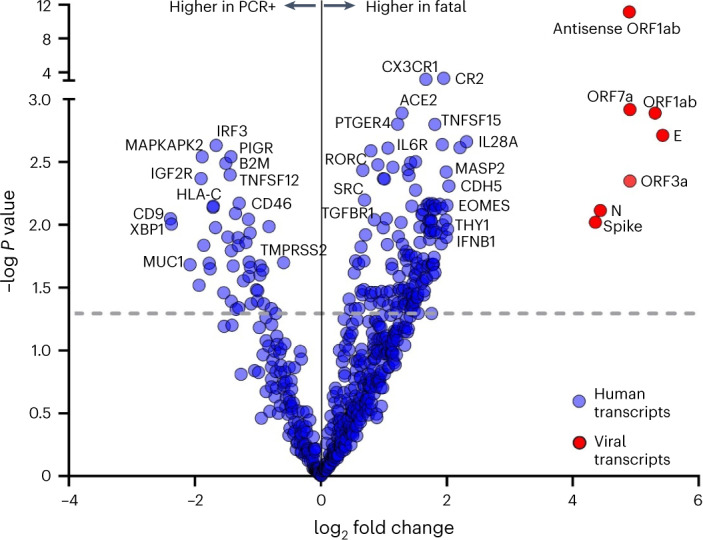
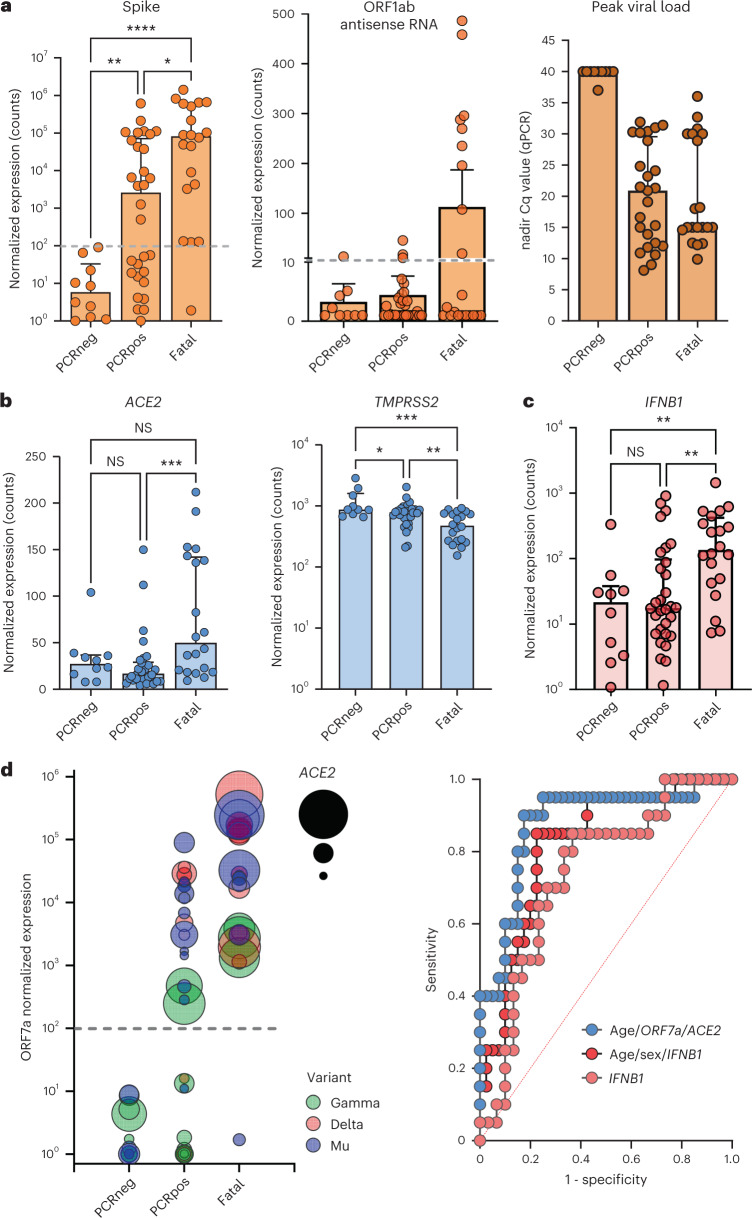
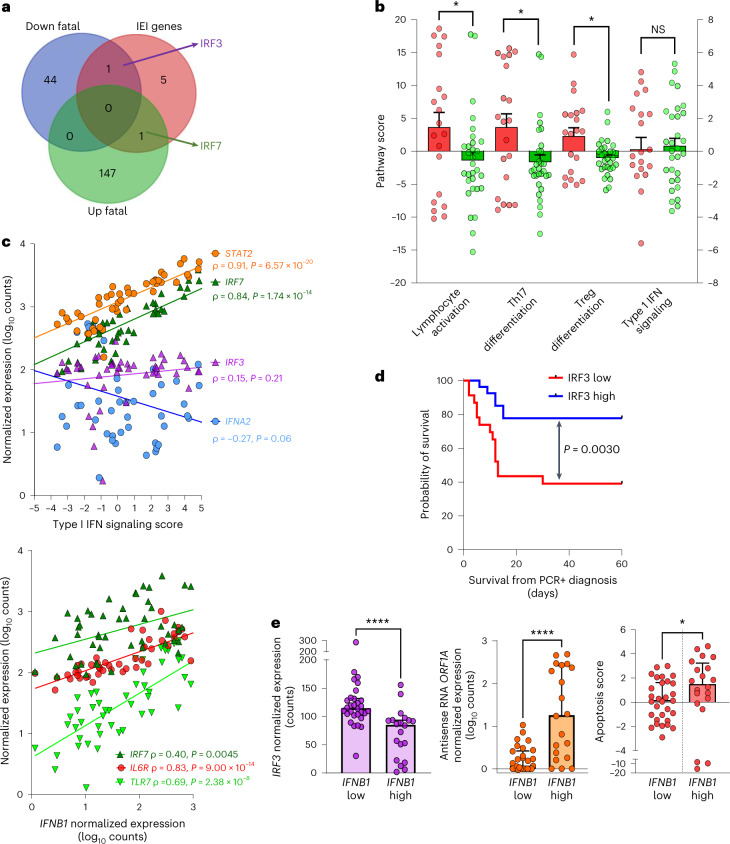
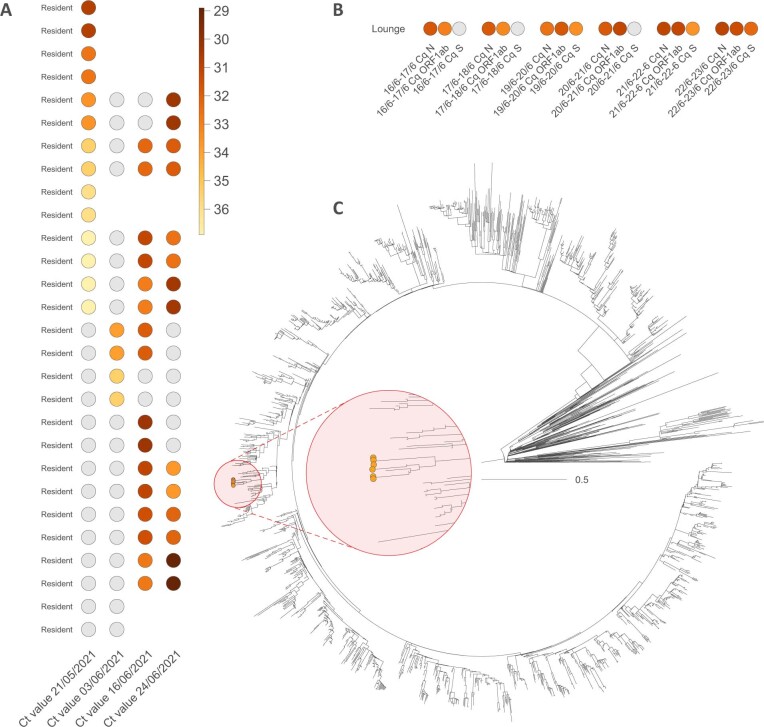
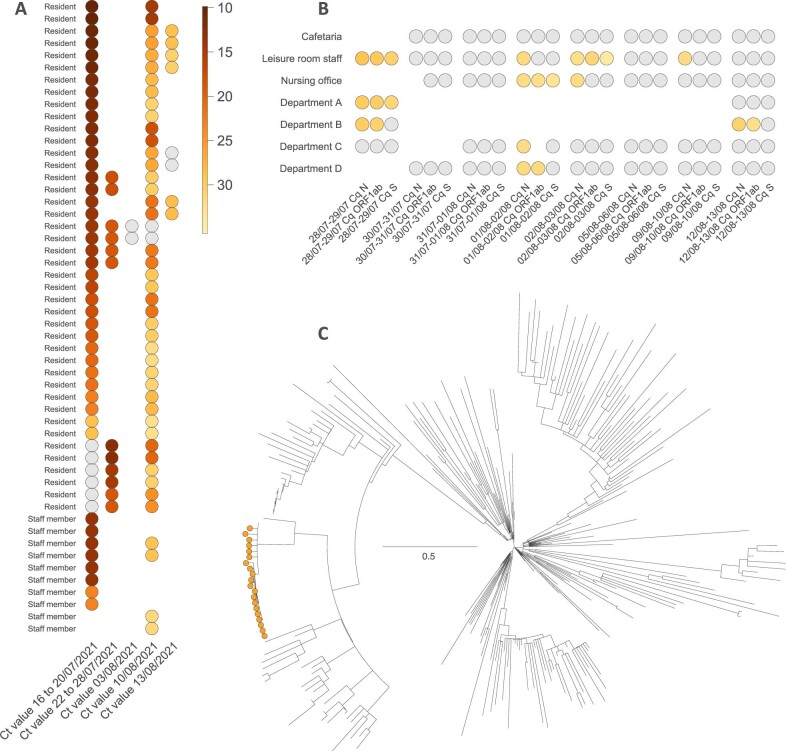
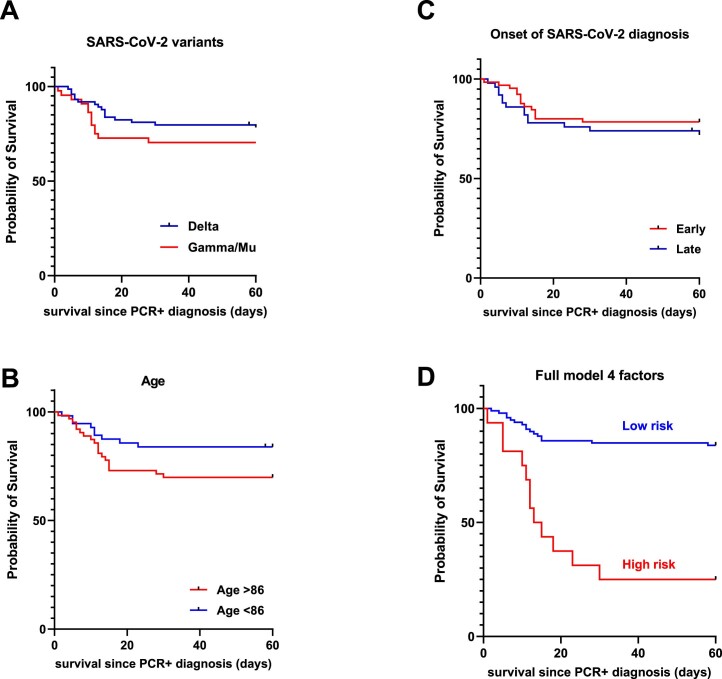
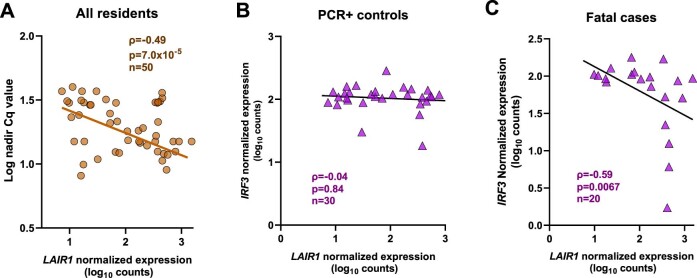
Coronavirus Disease 2019 (COVID-19) vaccination has resulted in excellent protection against fatal disease, including in older adults. However, risk factors for post-vaccination fatal COVID-19 are largely unknown. We comprehensively studied three large nursing home outbreaks (20-35% fatal cases among residents) by combining severe acute respiratory syndrome coronavirus 2 (SARS-CoV-2) aerosol monitoring, whole-genome phylogenetic analysis and immunovirological profiling of nasal mucosa by digital nCounter transcriptomics. Phylogenetic investigations indicated that each outbreak stemmed from a single introduction event, although with different variants (Delta, Gamma and Mu). SARS-CoV-2 was detected in aerosol samples up to 52 d after the initial infection. Combining demographic, immune and viral parameters, the best predictive models for mortality comprised IFNB1 or age, viral ORF7a and ACE2 receptor transcripts. Comparison with published pre-vaccine fatal COVID-19 transcriptomic and genomic signatures uncovered a unique IRF3 low/IRF7 high immune signature in post-vaccine fatal COVID-19 outbreaks. A multi-layered strategy, including environmental sampling, immunomonitoring and early antiviral therapy, should be considered to prevent post-vaccination COVID-19 mortality in nursing homes.


Conflict of interest statement

K.L. received consultancy fees from MRM Health and Merck Sharp & Dohme, speaker fees from Pfizer and Gilead and service fees from Thermo Fisher Scientific and TECOmedical, all outside the reported work. The other authors report no competing interests.

Figures

Fig. 1
Fig. 1. Overview of the outbreak in nursing home A (Delta/B.1.617.2).
a,b, We report the evolution through time of Ct values measured in both infected residents and staff members (a) and aerosols analyzed in various sections within the nursing home (b). Gray dots refer to negative PCR results. c, Time-scaled phylogenetic analysis involving Delta (B.1.617.2) genomes sampled and sequenced from this outbreak reveals that all 58 full genomes originating from nursing home A are clearly clustered within the overall phylogenetic tree (orange dots), suggesting a single introduction event. The phylogenetic tree is time calibrated, meaning that branch lengths are in units of time (year).
Fig. 2
Fig. 2. Differentially expressed genes in nasal mucosa of fatal COVID-19 outbreak cases as compared to matched PCR-positive residents from three nursing homes.
Volcano plot of differentially expressed genes in nasal mucosa of fatal (n = 20) versus age-matched, sex-matched and outbreak-matched non-fatal PCR-positive cases (n = 30), quantified by nCounter digital transcriptomics (uncorrected P values from linear model, negative binomial distribution, dotted line showing P < 0.05, FDR q values provided in Source Data). Selected viral (red circles) and host immune transcripts (blue circles) significantly upregulated or downregulated in fatal versus non-fatal cases are highlighted with gene names. Details on immune genes are given in the Results section. PCR+, PCR positive. Source data
Fig. 3
Fig. 3. Immunological and virological risk factors identified in fatal COVID-19 outbreak cases among residents in three nursing homes.
ac, Viral transcript levels for spike protein (left: fatal versus PCRpos P = 0.012, fatal versus PCRneg P = 0.000022, PCRneg versus PCRpos P = 0.0089) and ORF1ab antisense RNA (middle), measured by nCounter digital transcriptomics. Right panel shows peak viral load (nadir Cq values) as quantified by qPCR. Viral receptors (ACE2: fatal versus PCRpos P = 0.0009; TMPRSS2: fatal versus PCRpos P = 0.0036, fatal versus PCRneg P = 0.0005, PCRneg versus PCRpos P = 0.0422) (b) and antiviral cytokine IFNB1 (fatal versus PCRpos P = 0.0022, fatal versus PCRneg P = 0.0022) (c) were quantified by nCounter digital transcriptomics. Data are presented as median values ± s.d. d, Left: visualization of best predictive model (multivariate logistic regression, selected by cAIC), including age (not depicted) and ORF7a and ACE2 transcripts. Dashed gray lines indicate the detection limit of SARS-CoV-2 transcripts. Each circle represents a resident, and the size of the circle is proportional to ACE2 normalized expression. Right: comparison of ROC curves of predictive models by univariate (IFNB1) or multivariate (IFNB1/age/sex and age/ORF7a/ACE2) logistic regression. ROC curves showing significant prediction of fatal versus non-fatal COVID-19 according to IFNB1 transcript levels (right), with and without age and sex as additional factors (detailed in the Results section). For ac, statistical results are from Kruskal–Wallis test with FDR correction for multiple testing (PCRneg n = 10, PCRpos n = 30, fatal n = 20), ****P < 0.0001, ***P < 0.001, **P < 0.01, *P < 0.05, NS, not significant. PCRpos, PCR positive; PCRneg, PCR negative. Source data
Fig. 4
Fig. 4. IRF3/IRF7 dichotomy in type I IFN signaling underlies IFN-β link to inflammation, apoptosis and mortality in nursing home residents during post-vaccine COVID-19 outbreaks.
a, Venn diagram shows overlap between gene transcripts upregulated (‘up Fatal’) or downregulated (‘down Fatal) in fatal cases versus PCR-positive controls (quantified by nCounter digital transcriptomics) and the gene mutations (IEI) identified in life-threatening COVID-19 (ref. ) (pre-vaccine era). The five IEI genes not differentially expressed between cases and controls are TICAM1, TBK1, UNC93B1, IFNAR1 and TLR3. b, Pathway scores (calculated by nSolver from gene expression profiling by nCounter) for lymphocyte activation (P = 0.043), Th17 (P = 0.028) and Treg differentiation (P = 0.022) were increased in fatal cases versus PCR-positive controls, whereas type I IFN signaling was not (t-test with Welch’s correction). No pathways were significant after stringent Bonferroni correction for multiple testing. Data are presented as median values ± s.d. Red circles: fatal cases; green circles: PCR-positive controls. c, Spearmanʼs correlation of type I signaling score (upper panel) and IFNB1 expression (lower panel) with drivers of IFN signaling (STAT2, IRF7, IRF3, IFNA2 and TLR7) and inflammation (IL6R), across all 50 residents (20 fatal cases and 30 PCR-positive controls). d, Kaplan–Meier curve demonstrating significantly lower (log-rank test) survival in nursing home residents with ‘IRF3 low’ status (nCounter normalized expression below the median). e, Classification of nursing home residents into ‘IFNB1 high’ versus ‘IFNB1 low’ (below or above 100 normalized counts) reveals a significant link with IRF3 expression (Mann–Whitney test P = 0.000011), intracellular viral replication (measured as SARS-CoV-2 antisense RNA, Mann–Whitney test P = 0.000072) and apoptosis score (calculated by nSolver, Mann–Whitney test P = 0.044) in upper airway mucosa. Data are presented as median values ± s.d. ****P < 0.0001, **P < 0.01, *P < 0.05, NS, not significant. PCR+, PCR positive. Source data
Extended Data Fig. 1
Extended Data Fig. 1. Overview of the outbreak in nursing home B (Gamma/P.1).
We report the evolution through time of Ct values measured in both infected residents (a) and aerosols analyzed in the lounge of the nursing home (b). Grey dots refer to negative PCR results. In addition, we also report the time-scaled phylogenetic analysis involving Gamma (P.1) genomes sampled and sequenced from this outbreak (c), showing one phylogenetic cluster (zoomed in the red circle, scale bar corresponds to the full tree) among 6 full genomes (orange dots), likely corresponding to a single introduction event into nursing home B. The phylogenetic tree is time-calibrated, meaning that branch lengths are in units of time (year).
Extended Data Fig. 2
Extended Data Fig. 2. Overview of the outbreak in nursing home C (Mu/B.1.621).
We report the evolution through time of Ct values measured in both infected resident/staff members (a) and aerosols analyzed in various sections within the nursing home (b). Grey dots refer to negative PCR results. In addition, we also report the time-scaled phylogenetic analysis involving Mu (B.1.621) genomes sampled and sequenced from this outbreak (c), showing one phylogenetic cluster (with short branch lengths) among 24 full genomes (orange dots) likely corresponding to a single introduction event. The phylogenetic tree is time-calibrated, meaning that branch lengths are in units of time (year).
Extended Data Fig. 3
Extended Data Fig. 3. Univariate and multivariate Kaplan-Meier survival curves.
Kaplan-Meier survival curves comparing (a) SARS-CoV-2 variants Delta vs. non-Delta (Gamma/Mu, Log-rank test, p = 0.28), (b) Age above or below the median (86 years, Log-rank test, p = 0.078); (c) Onset of SARS-CoV-2 diagnosis (PCR+): early (0–7 days) vs. late (>7 days), with regard to the start of the respective outbreaks, Log-rank test, p = 0.40; (d) Combined probability of age, sex, variant, and late onset of diagnosis (Log-rank test, p = 1.1 × 10⁻⁷). Source data
Extended Data Fig. 4
Extended Data Fig. 4. LAIR1 expression (a surrogate marker for anti-type I IFN neutralizing antibodies) correlates with IRF3 expression in fatal cases only.
(a) LAIR1 expression (nasal mucosa, quantified by nCounter digital transcriptomics) correlates positively with peak SARS-CoV-2 viral load (that is negatively with nadir Cq value) across all residents. (b) LAIR1 expression does not correlate with IRF3 expression (nasal mucosa) in PCR-positive residents. (c) LAIR1 expression correlates negatively with IRF3 expression (nasal mucosa) in fatal COVID-19 cases. All correlations Spearman. Source data

References

    1. Hardy JO, et al. A world apart: levels and determinants of excess mortality due to COVID-19 in care homes: the case of the Belgian region of Wallonia during the spring 2020 wave. Demogr. Res. 2021;45:1011–1040. doi: 10.4054/DemRes.2021.45.33. - DOI
    1. Dellicour S, et al. Investigating the drivers of the spatio-temporal heterogeneity in COVID-19 hospital incidence—Belgium as a study case. Int. J. Health Geogr. 2021;20:29. doi: 10.1186/s12942-021-00281-1. - DOI - PMC - PubMed
    1. Gillain S, Belche J-L, Moreau J-F. COVID-19 epidemic in the nursing homes in Belgium. J. Nursing Home Res. 2020;6:40–42.
    1. Suñer C, et al. A retrospective cohort study of risk factors for mortality among nursing homes exposed to COVID-19 in Spain. Nat. Aging. 2021;1:579–584. doi: 10.1038/s43587-021-00079-7. - DOI - PubMed
    1. Collier DA, et al. Age-related immune response heterogeneity to SARS-CoV-2 vaccine BNT162b2. Nature. 2021;596:417–422. doi: 10.1038/s41586-021-03739-1. - DOI - PMC - PubMed